%2520(1).png)
B2B marketing is more complex than ever. Marketers use over 100 platforms on a regular basis. Sales cycles are long. Buying committees have multiple decision-makers. Attributing revenue to specific campaigns feels like a puzzle. Without clear reporting, marketing leaders fly blind. They struggle to justify budgets and prove their impact on the bottom line.
This guide changes that. We will break down every aspect of a powerful B2B marketing report. You'll learn what to measure, how to present it, and how to turn data into decisive action. Forget confusing spreadsheets and vanity metrics.
Key Takeaways:
- A B2B marketing report is a strategic tool that aligns marketing efforts with business goals, focusing on long sales cycles and multiple stakeholders.
- Effective reports must include objective alignment, key performance metrics (KPIs), financial analysis (ROI, CPA), and qualitative insights.
- Content marketing and account-based marketing (ABM) require specialized reporting metrics to accurately measure influence and engagement.
- AI and automation are transforming B2B reporting. They enable predictive analytics, anomaly detection, and massive efficiency gains.
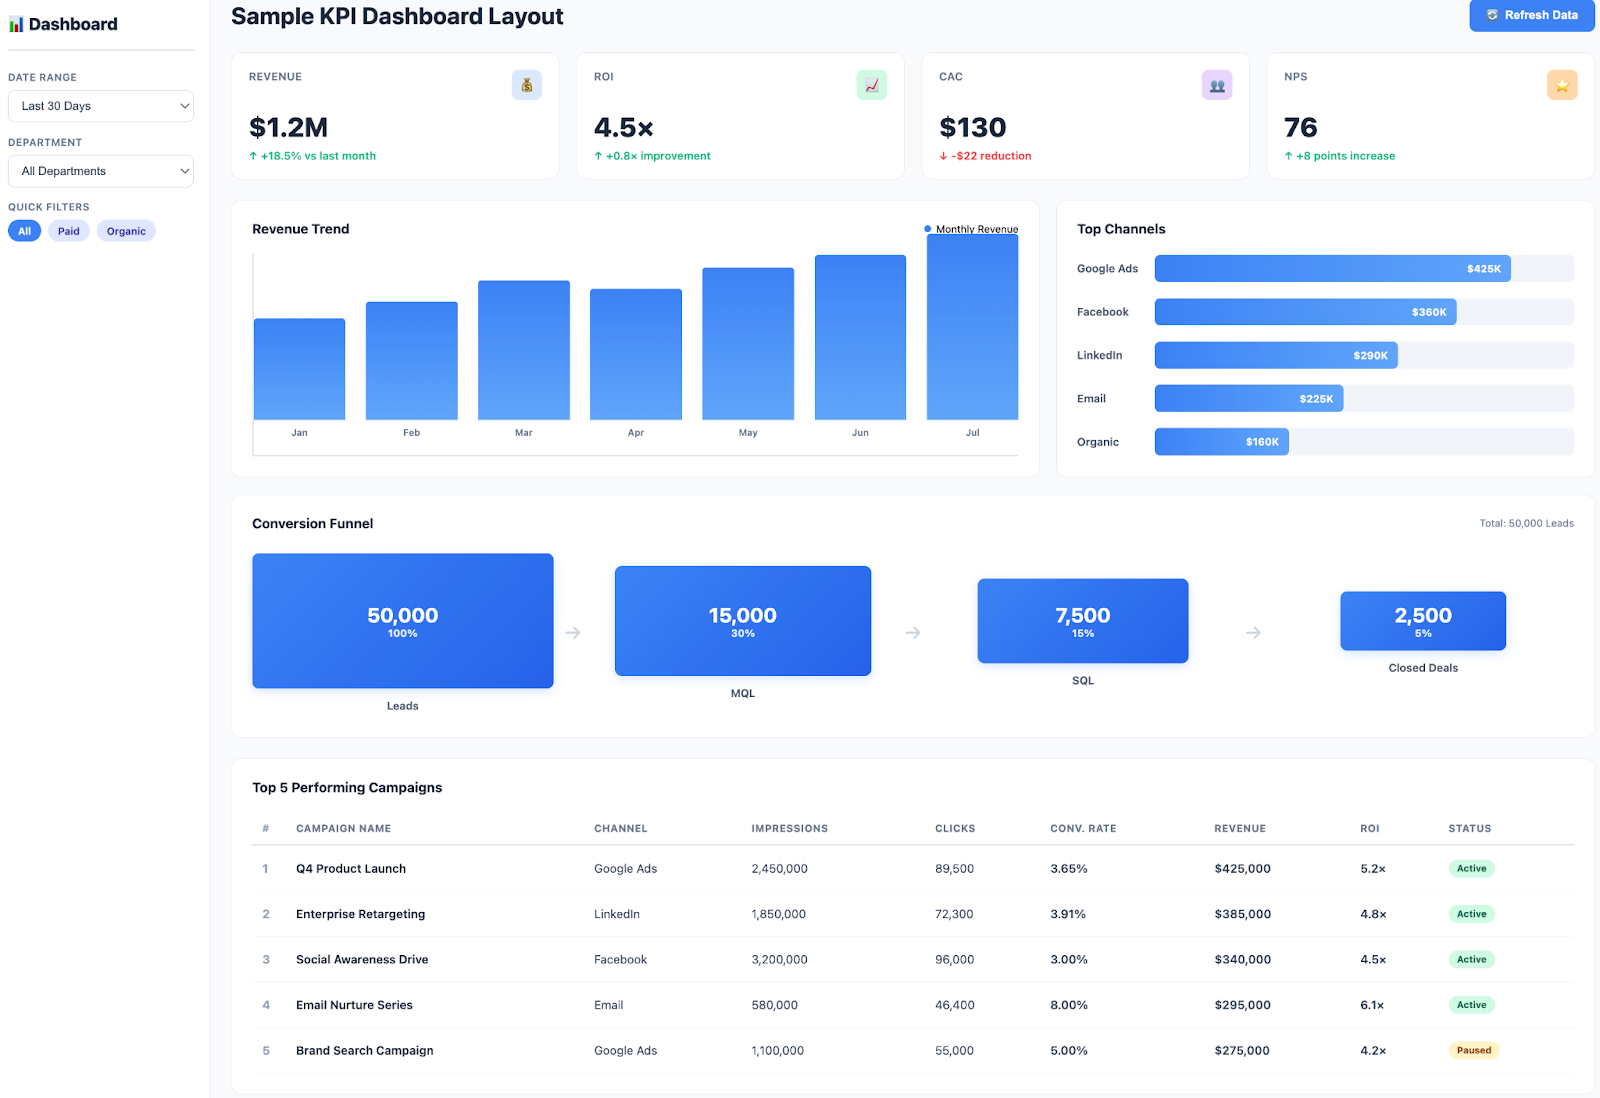
- Visual dashboards are crucial for making complex data digestible for stakeholders, moving beyond static spreadsheets to interactive, real-time insights.
What Is a B2B Marketing Report? And What It's Not
A B2B marketing report is a strategic document. It analyzes and presents data from business-to-business marketing campaigns. Its primary goal is to measure performance against business objectives. This process informs future strategy and demonstrates marketing's value.
Unlike B2C reports, which focus on high-volume, individual sales, B2B reporting tackles a different beast. It must account for complex customer journeys, high-value deals, and relationships built over months or even years.
The Purpose: Beyond Just Numbers
A great B2B report is not a data dump. It’s a narrative. It tells the story of your marketing efforts. The report should answer critical questions for leadership:
- Which channels are driving the most qualified leads?
- How is marketing influencing the sales pipeline?
- What is our return on marketing investment (ROMI)?
- Are we on track to meet our revenue goals?
It provides the insights needed for smart, data-driven decision-making. It aligns teams and holds them accountable for results.
Core Components of an Actionable B2B Marketing Report
To create a report that commands attention, you need to include the right components. Each piece adds context and contributes to the overall story.
A comprehensive report moves beyond simple metrics to provide a full 360-degree view of performance.
1. Executive Summary
Start with the bottom line. The executive summary is for busy stakeholders. It should be a concise overview of the key findings, major wins, and critical challenges. Highlight the most important takeaways and recommended actions in a few bullet points or a short paragraph.
2. Objective Alignment
Connect your report directly to business goals. Clearly state the objectives the marketing activities were designed to support.
For example, was the goal to increase Marketing Qualified Leads (MQLs) by 20%? Or to generate $5M in sales pipeline?
This context makes the data meaningful.
3. Key Performance Indicators (KPIs)
This is the heart of your report. Present the most important metrics that track progress toward your objectives. Group them logically, such as by funnel stage or marketing channel.
We'll cover specific KPIs in the next section. Effective KPI dashboards are essential for presenting this information clearly.
4. In-Depth Channel Analysis
Break down performance by individual channels. Show how SEO, PPC, social media, email, and events are contributing. This helps you understand what’s working and where to optimize your budget.
For instance, you might find LinkedIn ads drive higher-quality leads than Google Ads, despite a higher cost.
5. Financial Metrics & ROI
Money talks. This section connects marketing spend to revenue. Include metrics like Customer Acquisition Cost (CAC), Return on Investment (ROI), and Customer Lifetime Value (CLV). Calculating the ROI of marketing campaigns is often the most scrutinized part of any report, so accuracy is key.
6. Insights and Recommendations
Data is useless without interpretation. This is where the true value of a marketer shines. Explain what the data means. What trends do you see? What surprised you? Based on these insights, provide clear, actionable recommendations for the next period.
Key B2B Marketing Metrics That Actually Matter
Vanity metrics like likes and impressions don't pay the bills. Successful B2B marketers focus on metrics that connect to the sales pipeline and revenue. It's helpful to structure these metrics by the marketing and sales funnel to show the complete customer journey.
Top-of-Funnel (TOFU): Awareness & Engagement
At this stage, your goal is to attract your target audience and engage them with your brand. The focus is on reach and education.
- Website Traffic: Total sessions, unique visitors, and traffic by source.
- Brand Mentions: Tracking how often your brand is mentioned online.
- Content Engagement: Blog post views, resource downloads, video watch time.
- Social Media Reach: How many unique users see your content.
Middle-of-Funnel (MOFU): Lead Generation & Nurturing
Here, you convert anonymous visitors into known leads and nurture them until they are sales-ready. This is where powerful marketing analytics tools become critical for tracking behavior.
- Lead Generation: Total number of new leads acquired.
- Conversion Rate: Percentage of visitors who complete a desired action (e.g., form fill).
- Cost Per Lead (CPL): The average cost to acquire one new lead.
- Marketing Qualified Leads (MQLs): Leads that meet specific criteria and are ready for sales nurturing.
Bottom-of-Funnel (BOFU): Conversion & Revenue
This is where marketing and sales alignment is crucial. These metrics show how marketing efforts translate directly into business.
- Sales Qualified Leads (SQLs): MQLs that the sales team has accepted as viable opportunities.
- Opportunity Creation Rate: The percentage of leads that become sales opportunities.
- Customer Acquisition Cost (CAC): The total cost to acquire a new customer.
- Pipeline Contribution: The amount of sales pipeline generated by marketing.
- Return on Marketing Investment (ROMI): The revenue generated for every dollar spent on marketing.
| Metric Category | Top-of-Funnel (Awareness) | Middle-of-Funnel (Consideration) | Bottom-of-Funnel (Decision) |
|---|---|---|---|
| Primary Goal | Attract target audience | Capture leads and nurture interest | Convert leads into customers |
| Key Metrics | Website Sessions, Keyword Rankings, Social Reach, Video Views | MQLs, Gated Content Downloads, Webinar Registrations, Email CTR | SQLs, Sales Opportunities, Closed-Won Deals, Pipeline Value |
| Financial Focus | Cost Per Mille (CPM) | Cost Per Lead (CPL) | Customer Acquisition Cost (CAC), ROI |
| Content Type | Blog posts, infographics, social media updates, podcasts | Whitepapers, e-books, case studies, webinars | Demos, free trials, consultations, pricing pages |
| Call to Action | "Learn More", "Read Our Blog" | "Download Now", "Register Here" | "Request a Demo", "Talk to Sales" |
| Reporting Question | Are we reaching the right people? | Are we generating qualified interest? | Are we driving revenue? |
Reporting on B2B Content Marketing: From Benchmarks to ROI
Content is the engine of B2B marketing. Yet, reporting on its effectiveness is a common challenge. A B2B content marketing report needs to go beyond page views. It must show how content influences the entire buyer's journey and contributes to business goals.
Establishing Your Content Benchmarks
Before you can measure success, you need a baseline.
Analyze your historical performance to set realistic benchmarks. Look at metrics like average time on page for blog posts, conversion rates for landing pages, and lead quality from different content assets.
Industry reports can also provide valuable benchmarks, but your own data is the best starting point.
Connecting Content to the Funnel
Map your content assets to different stages of the funnel. This allows you to measure their specific impact.
For example, a top-of-funnel blog post should be judged on its ability to attract organic traffic and new users. A bottom-of-funnel case study, however, should be measured by how many demo requests it generates.
Measuring Content-Driven Leads and Pipeline
This is the holy grail of content reporting. You need a system to track which content a lead consumed before converting.
This often requires robust analytics and proper UTM tracking. Understanding which e-book generated the most MQLs or which case study influenced the most closed-won deals is a game-changer. This level of detail is a core component of advanced marketing attribution.
Audience Growth and Engagement Metrics
Don't forget to report on audience growth. Metrics like email subscriber growth, social media follower increases, and repeat visitor rates show that your content is building a valuable, owned audience. High engagement rates (comments, shares, time on page) indicate that your content resonates with your target market.
The Rise of AI-Powered B2B Marketing Reporting
Artificial intelligence is no longer a futuristic concept; it's a present-day reality in marketing analytics. AI is revolutionizing how B2B marketers approach reporting, moving from retrospective analysis to predictive insights and automation.
Automated Insights and Anomaly Detection
AI-powered tools can sift through massive datasets in seconds. They automatically surface key insights you might have missed.
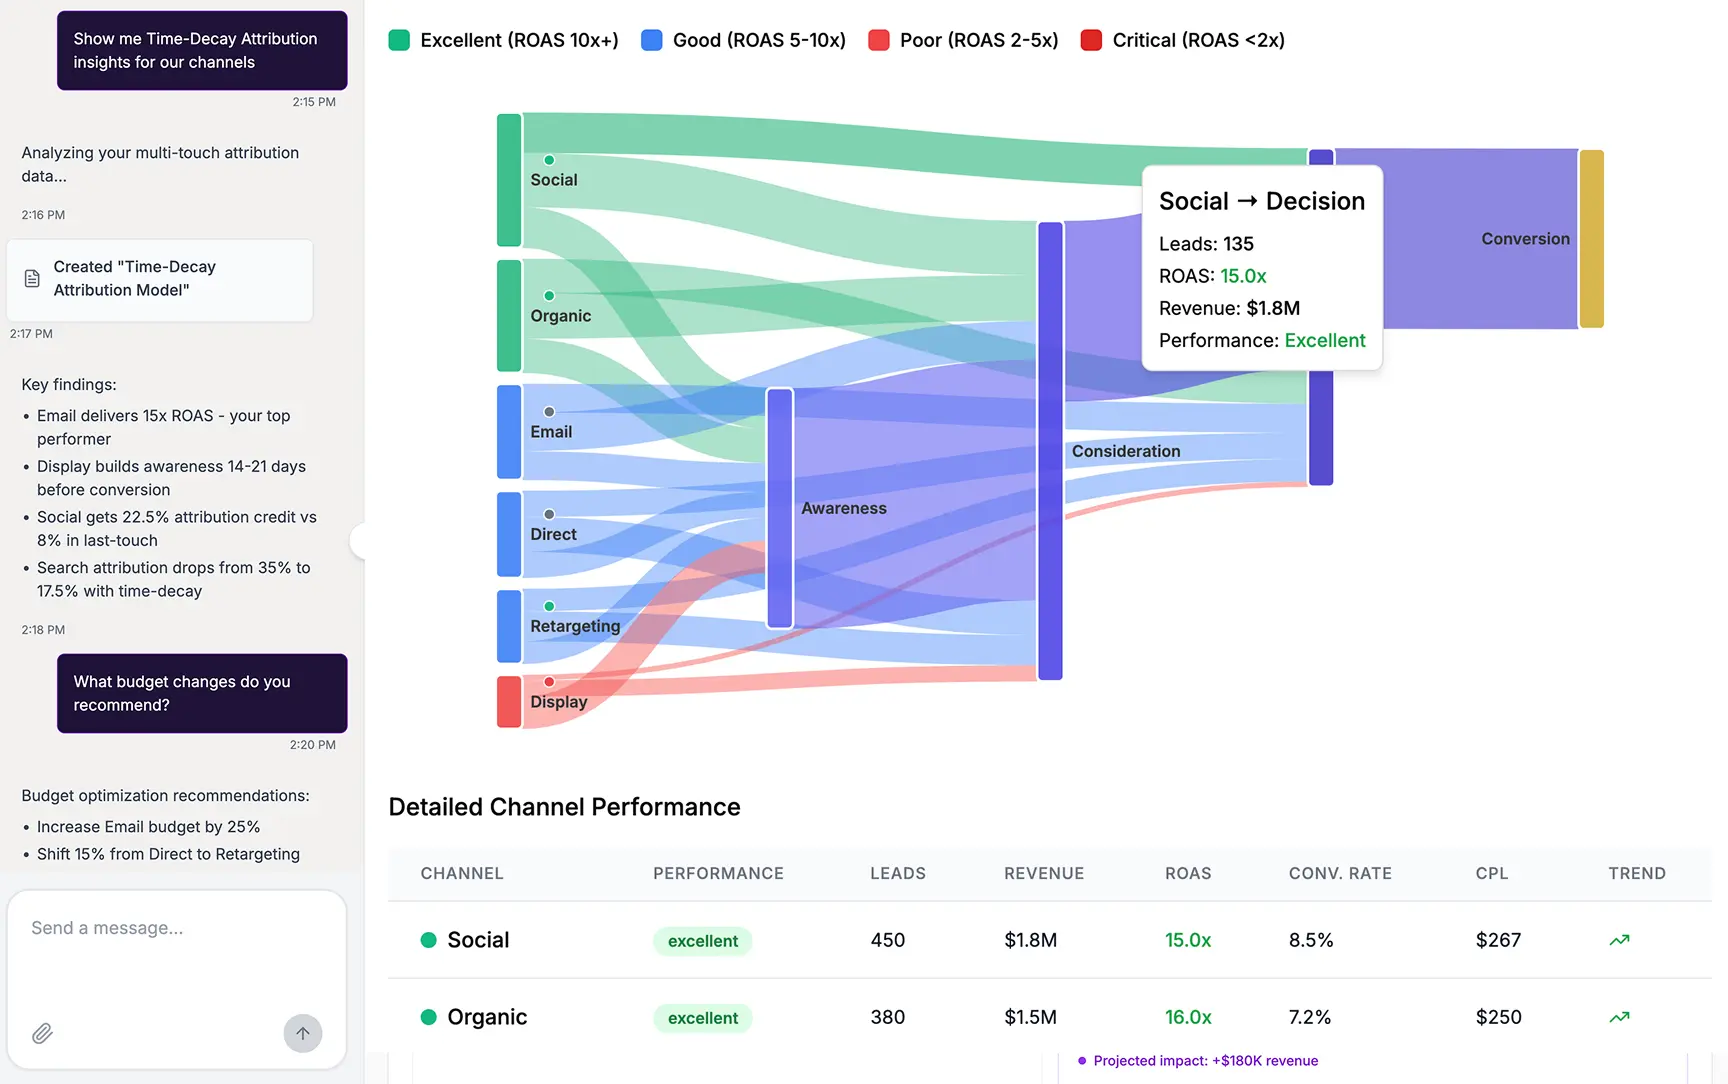
For instance, with Improvado’s AI Agent, marketers can ask natural-language questions and instantly understand which segments, campaigns, or channels are driving performance without digging through spreadsheets or dashboards.
The AI Agent can also generate dashboards, build reports on demand, highlight optimization opportunities, and provide recommendations based on real-time trends. This turns raw marketing data into actionable intelligence that teams can use immediately.
Predictive Analytics for Forecasting
Imagine knowing which leads are most likely to close. Or forecasting your quarterly pipeline with high accuracy. Predictive analytics uses historical data to model future outcomes.
This helps marketing teams allocate resources more effectively. They can focus sales efforts on high-potential accounts and adjust campaign spend based on predicted ROI.
Generative AI for Report Summaries

The latest evolution is generative AI. These tools can analyze your dashboards and write natural-language summaries. A marketing leader can simply ask, "What were our top-performing campaigns last month?" and receive a concise, data-backed answer. This makes data accessible to everyone, not just analysts.

The Role of a Unified Data Foundation
To leverage AI, you need clean, consolidated data. AI algorithms are only as good as the data they are trained on. Fragmented platforms, inconsistent naming, and siloed reporting limit the value of even the most advanced AI tools.
This is where Improvado provides the foundation modern B2B teams need. Improvado centralizes all marketing, sales, and revenue data into a single governed environment, ensuring accuracy, consistency, and trust before AI ever touches it.
Improvado provides:
- 1,000+ pre-built data connectors for marketing, sales, and revenue systems, flat data ingestion capabilities, and an option to build a custom connector to a niche or legacy system.
- Data normalization and harmonization that align metrics, dimensions, and naming across platforms.
- A robust transformation engine for aggregations, calculated fields, business logic, and modeling, all without SQL.
- Marketing Data Governance for naming conventions, data validations, and structural enforcement.
- Centralized data quality checks and monitoring to eliminate inconsistencies before analysis.
- Flexible delivery to warehouses, BI tools, or Improvado’s own AI-powered interface.
“Improvado allows us to have all information in one place for quick action. We can see at a glance if we're on target with spending or if changes are needed—without having to dig into each platform individually.
On the reporting side, we saw a significant amount of time saved! Some of our data sources required lots of manipulation, and now it's automated and done very quickly. Now we save about 80% of time for the team.”

Crafting Your Report: A Step-by-Step Guide
Building a great report is a systematic process. Following these steps will ensure your report is accurate, insightful, and easy for stakeholders to understand. It all starts with a solid data foundation.
Step 1: Define Your Audience and Objectives
Who is this report for? The CEO cares about ROI and pipeline.
The sales manager wants to see lead quality.
The content team needs to know which blog posts are performing.
Tailor the content and level of detail to your audience. Then, clearly define what questions the report should answer.
Step 2: Consolidate Your Data
B2B marketing data lives in dozens of places: your CRM, Google Analytics, ad platforms, social media tools, and more. The most time-consuming part of reporting is often just collecting this data.
An automated ETL process can save hundreds of hours by pulling all this data into a single source of truth, like a data warehouse.
Step 3: Structure Your Narrative
Organize your report in a logical flow. Start with the big picture (executive summary) and then drill down into the details. Use the core components we discussed earlier as your template. A good structure guides the reader through your performance story, making it easy to follow.
Step 4: Visualize the Data
No one wants to read a wall of numbers. Use charts, graphs, and tables to make your data visually appealing and easy to digest. We'll explore this more in the next section. The right visualization can make a complex trend immediately obvious.
Step 5: Add Your Analysis and Recommendations
This is where you add your unique value. Go beyond simply stating the facts. Explain the "why" behind the numbers. Connect the dots between different data points. Then, propose concrete, data-backed next steps to improve performance.
Step 6: Schedule and Automate
Reporting should be a consistent rhythm. Set up a regular cadence (weekly, monthly, quarterly) for your reports. Better yet, move from static reports to live dashboards that stakeholders can access anytime. This fosters a culture of data-driven decision-making.
Visualizing B2B Data: Dashboards That Drive Decisions
How you present your data is as important as the data itself. A well-designed dashboard can communicate complex information at a glance. It replaces static, quickly outdated reports with a dynamic, real-time view of marketing performance.
Moving Beyond Spreadsheets
Spreadsheets are flexible but have major limitations. They are manual, prone to errors, and poor at visualizing data over time.
Modern business intelligence (BI) tools and marketing analytics platforms offer a far superior solution. They connect directly to your data sources for automated updates.
Key Principles of Effective Dashboard Design
- Audience-centric: Design different dashboards for different users. An executive dashboard should be high-level, while a channel manager's dashboard should be granular.
- Clarity over clutter: Don't try to cram every possible metric onto one screen. Focus on the most important KPIs. Use white space effectively to guide the eye.
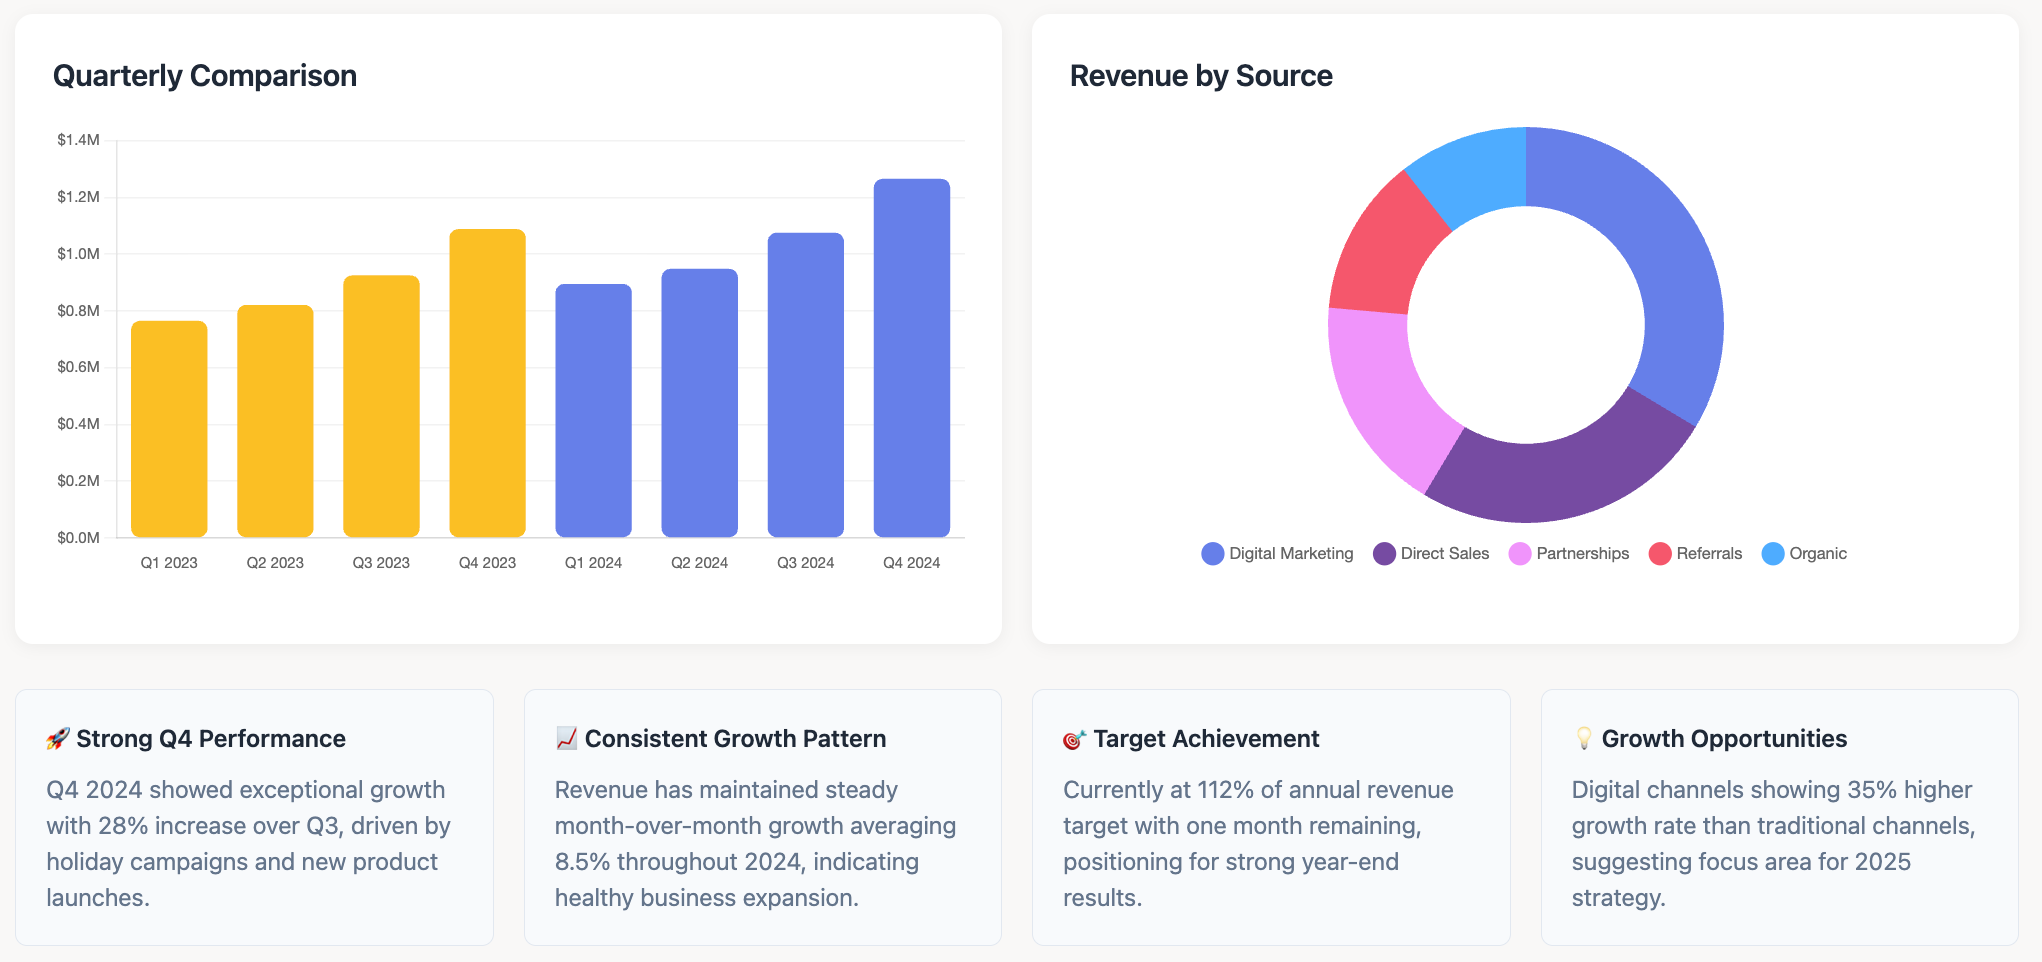
- Use the right chart type: Use line charts for trends over time. Use bar charts for comparisons. Use pie charts sparingly (if at all). The goal is to make the data as clear as possible.
- Provide context: A number on its own is meaningless. Compare it to a target, a previous period, or an industry benchmark. This tells the viewer if the number is good or bad.
Examples of B2B Marketing Dashboards
A B2B marketer might use several different dashboards:
- Lead generation dashboard: Tracks MQLs by source, CPL, and conversion rates.
- Content performance dashboard: Shows traffic, engagement, and leads generated by content assets.
- ABM dashboard: Monitors engagement levels across target accounts and key contacts.
- Full-funnel ROI dashboard: Connects marketing spend to pipeline and closed-won revenue.
Common Pitfalls in B2B Reporting (And How to Avoid Them)
Even with the best intentions, reporting can go wrong. Being aware of common mistakes can help you create reports that are trusted and valued by your organization. Avoiding these pitfalls is key to building credibility.
1. Overwhelming with Data (The "Data Puke")
The Pitfall: Including every metric you can find, creating a cluttered and confusing report.
How to Avoid: Be ruthless in your selection of KPIs. Focus only on the metrics that are directly tied to your objectives. If a metric doesn't help answer a key business question, leave it out.
2. Ignoring the Narrative
The Pitfall: Presenting numbers without context or interpretation.
How to Avoid: Always include a section for insights and analysis. Explain what the data means in plain language. Tell the story behind the numbers. Your job is to be an interpreter, not just a data provider.
3. Using Inconsistent Data Sources
The Pitfall: Pulling metrics from different platforms that measure things differently (e.g., a "click" in Google Ads vs. a "session" in Google Analytics).
How to Avoid: Establish a single source of truth. Use a data integration platform to unify your data and create standardized definitions for your key metrics. This ensures everyone is looking at the same information.
Improvado makes this easy by automatically extracting and normalizing metrics across 1,000+ marketing and revenue platforms, enforcing consistent naming and taxonomies, and delivering fully harmonized datasets to your warehouse or BI tools.
With standardized data flowing through one governed pipeline, teams can trust that every metric means the same thing everywhere.
4. Forgetting the "So What?"
The Pitfall: Ending your report without clear next steps.
How to Avoid: Every report should conclude with actionable recommendations. Based on the findings, what should the team start, stop, or continue doing? This transforms the report from a historical document into a strategic planning tool.
Choosing Your B2B Marketing Reporting & Analytics Stack
The tools you use have a massive impact on the quality and efficiency of your reporting. Your technology stack should support data consolidation, visualization, and analysis. Let's compare the common approaches.
| Aspect | Manual Spreadsheets (e.g., Excel) | Business Intelligence (BI) Tools (e.g., Tableau) | Unified Analytics Platform (e.g., Improvado) |
|---|---|---|---|
| Data Collection | 100% manual. Copy-paste from platforms. | Requires separate ETL/ELT tools and data engineering resources. | Automated. Built-in connectors to 1,000+ marketing sources. |
| Data Integration | Highly prone to errors. Difficult to blend sources. | Powerful but complex. Needs a data warehouse and skilled analysts. | Handled automatically. Data is cleaned, mapped, and unified. |
| Time to Value | Immediate for simple tasks, but slow for complex reports. | Months. Requires significant setup and configuration. | Days or weeks. Pre-built models and dashboards accelerate setup. |
| Scalability | Very low. Breaks with large data volumes or many sources. | High, but requires ongoing maintenance and engineering. | High. Built to handle massive marketing data volumes seamlessly. |
| Required Skills | Advanced spreadsheet skills. | Data engineers, SQL analysts, BI developers. | Marketers and marketing analysts. No coding required. |
| Real-Time Data | No. Data is always outdated. | Possible, but requires complex streaming pipelines. | Yes. Dashboards are updated automatically in near real-time. |
| Best For | Very small teams with one or two marketing channels. | Large enterprises with dedicated data teams. | Growth-focused B2B marketing teams that need speed and accuracy. |
Automating Your B2B Reports for Maximum Efficiency
The ultimate goal is to spend less time building reports and more time acting on them. Automation is the key to achieving this. By automating the manual, repetitive tasks of reporting, you free up your team for high-value strategic work.
The High Cost of Manual Reporting
Studies show that marketing teams spend 24% of their data-related time collecting data, 22% analyzing data, 20% visualizing data, 19% cleaning data, and 18% presenting data. This amounts to over a third of their total work time focused on data preparation tasks that can be partially or fully automated.
This is not only a massive time sink but also a source of frustration and burnout. The opportunity cost is huge; that's time that could be spent on strategy, creative development, or campaign optimization.
Benefits of Reporting Automation
Automating your reporting process offers transformative benefits:
- Time Savings: Drastically reduce the hours spent on manual data gathering and report creation.
- Increased Accuracy: Eliminate human error from copy-pasting and manual calculations.
- Real-Time Insights: Move from stale monthly reports to always-on, live dashboards.
- Greater Agility: Make faster decisions based on up-to-the-minute data.
- Improved Scalability: Easily add new marketing channels and data sources without breaking your reporting process.
Before Improvado, preparing reports at Signal Theory was a labor-intensive process, often taking four hours or more per report. Switching to Improvado reduced that time by over 80%, making reporting significantly more efficient and far less stressful.
"Reports that used to take hours now only take about 30 minutes. We're reporting for significantly more clients, even though it is only being handled by a single person. That's been huge for us.”

How to Get Started with Automation
Automating B2B marketing reporting starts with replacing manual data collection and spreadsheet stitching with a unified, end-to-end data pipeline.
The first step is implementing a platform that automatically extracts data from every channel, harmonizes inconsistent metrics, and transforms raw inputs into clean, analysis-ready datasets. Improvado does exactly this — handling ingestion, normalization, transformation, and delivery without requiring SQL, engineering support, or custom scripts.
Once your data is centralized, standardized, and refreshed on an automated schedule, you can build dashboards in any BI tool that remain up-to-date without manual intervention. Reports that used to take days now update themselves continuously, enabling real-time visibility into pipeline performance, campaign efficiency, attribution trends, and ROI.
This “set it and forget it” infrastructure frees your team to focus on analysis and strategy rather than operations, unlocking efficiency, accuracy, and faster decision-making across the entire marketing organization.


