.png)
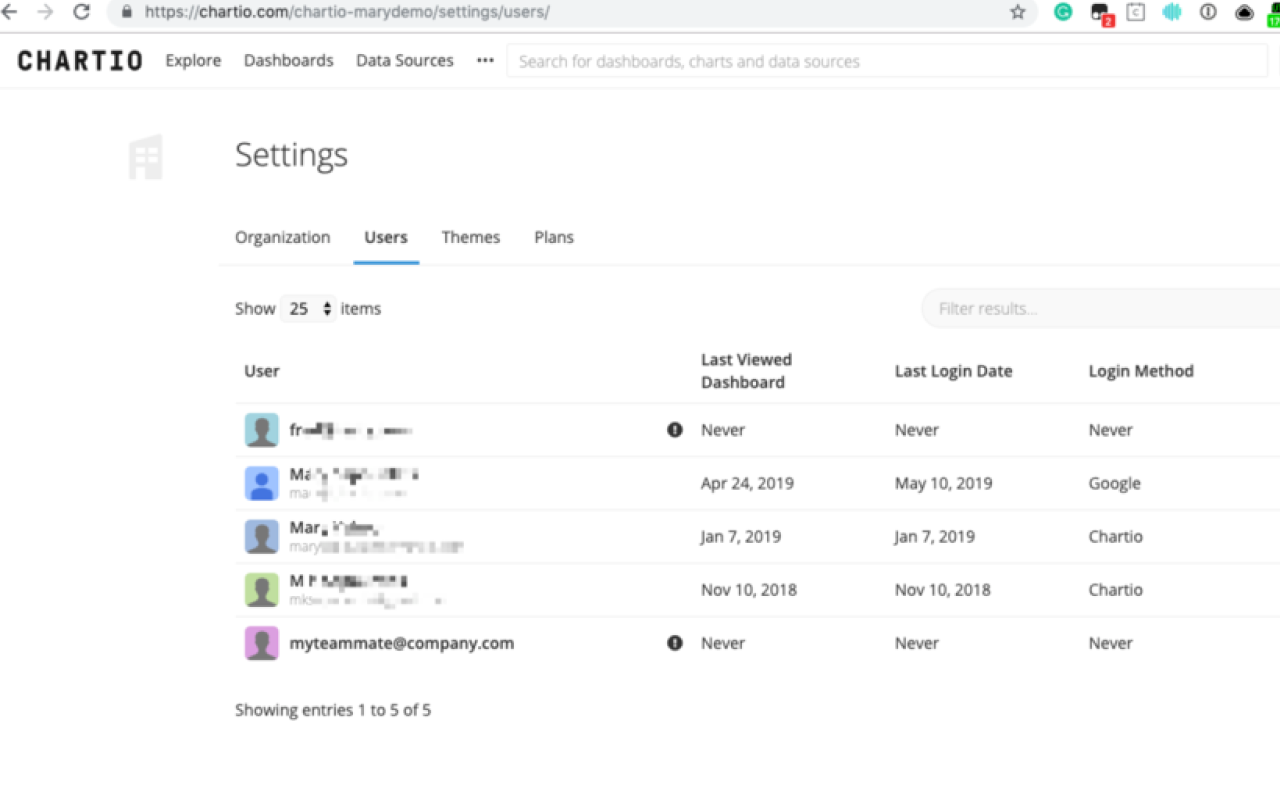
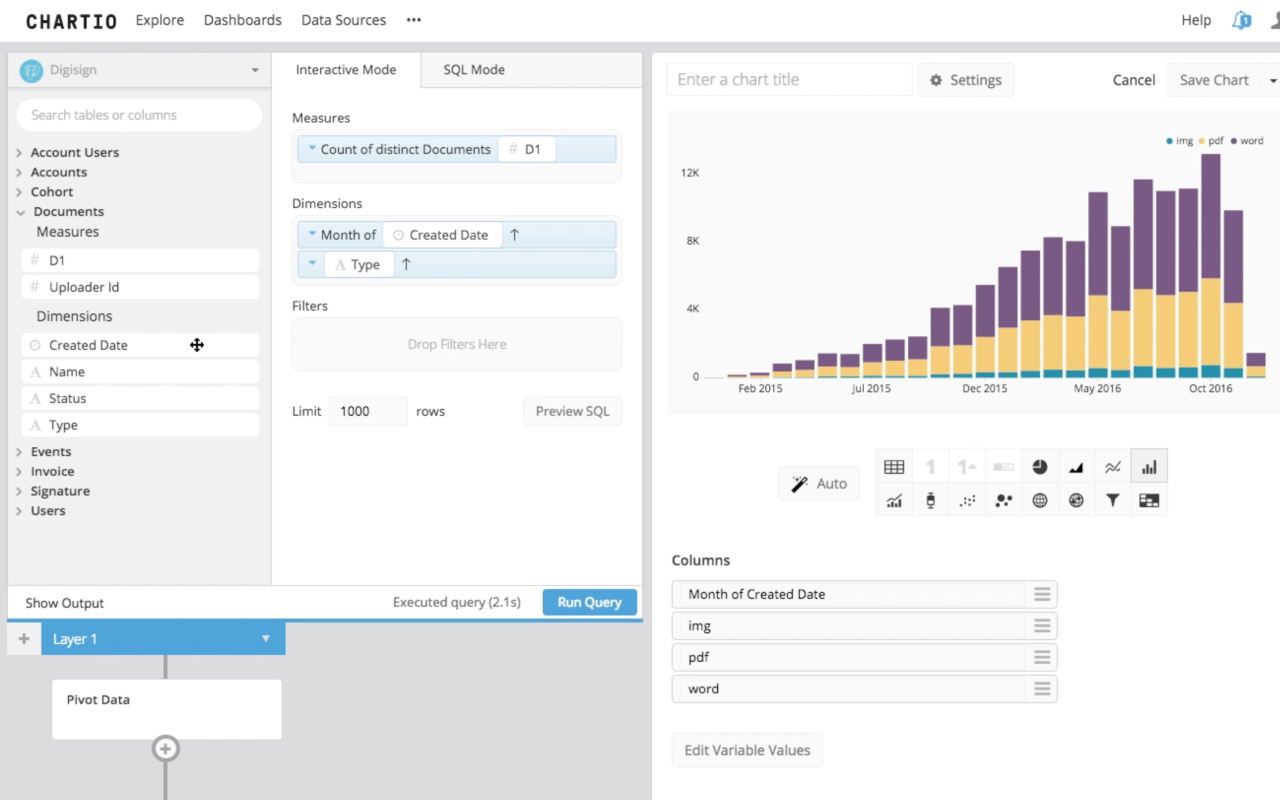
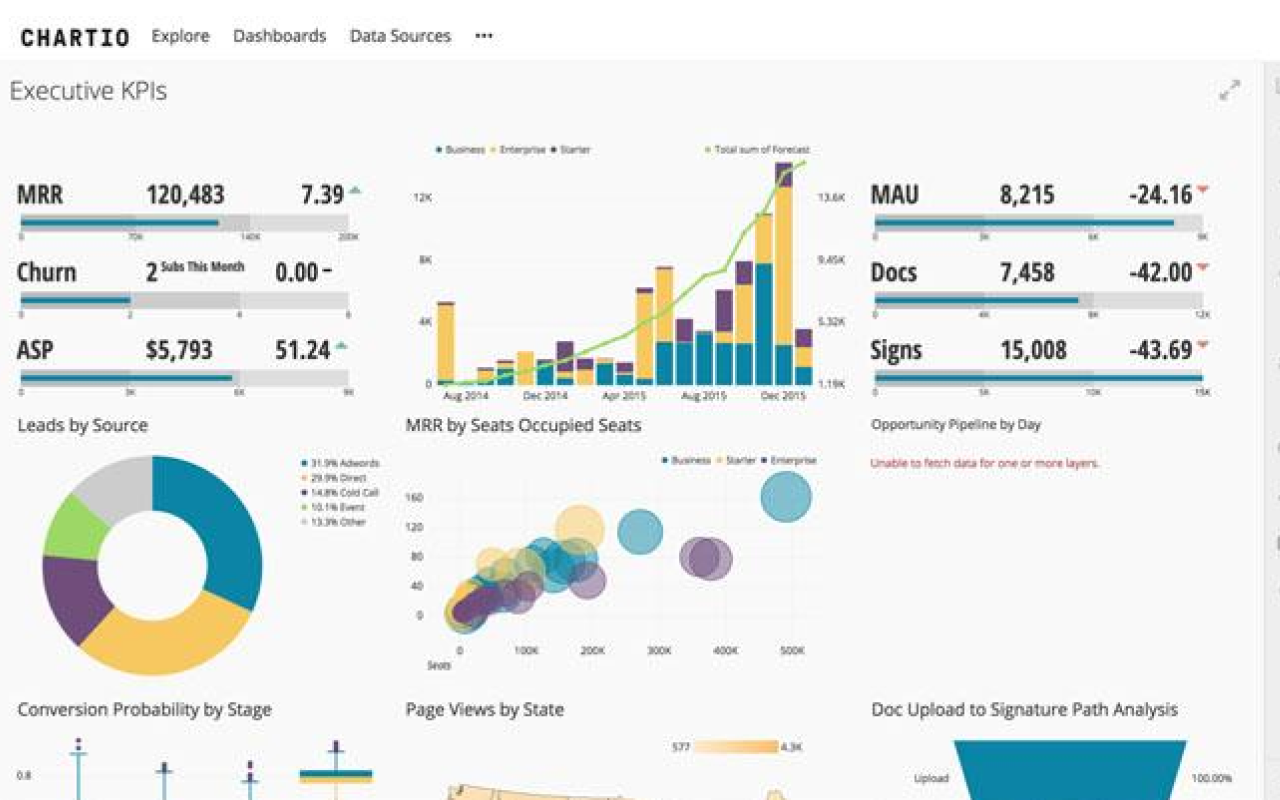
Chartio is a cloud-based business intelligence and analytics solution that allows its users to easily analyze data from business applications and represent it through various customizable charts. Chartio is suitable for people with no technical background and professionals, as you can choose between intuitive Interactive and SQL modes.
Chartio is a business intelligence platform that helps companies track, analyze and make sense of their data. The Chartio platform was designed to be used by everyone across an organization, with no need for developers, IT support or coding knowledge. Through a series of integrations, Chartio users can sync their data from multiple sources and analyze it in one place. Chartio’s visualization tool allows users to create custom graphs, charts and reports, which can be shared instantly through email, Slack or downloads.


You can now use Improvado to automatically send all your marketing data to Chartio for live marketing reports and dashboards. Improvado does not require you to have any technical skills, as you can effortlessly sync your data with just a few clicks.
Let’s chat about how to automate your Chartio data with Improvado.
Every platform uses different words to describe its metrics. What one platform calls “impressions” another calls “imps” and another calls “views.” This is a major hassle for marketers who want to combine and analyze the data they’ve gathered from multiple platforms. Instead of diving into analytics, they waste 90% of their time just preparing the data for analysis, resulting in hours of productive time lost.
With Improvado, you get analysis-ready data with unified naming across all platforms. You always have access to the raw data and unified reports should you need them. This flexibility allows you to get answers faster and uncover more valuable insights.
%20(1).png)
You can explore an extensive overview of the full list of all common report types by providers in Improvado Data Dictionary
This list includes such fields as metrics, properties, dimensions, etc.
Talk to our experts to get more details on it.
%20(1).png)
%20(1).png)
Connect and manage all your marketing data sources in one platform, both in the cloud or on-premise.
Connect multiple data sources and analyze them as if they were a single database.
Combine, map, and normalize data to produce a comprehensive data set surrounding your marketing activities.
You can use it directly with your favorite business intelligence tools, ingest it to econometric models and populate the enterprise data warehouse
.png)

Over 500+ data sources empower your marketing team to use their favorite tools to map data, build and visualize custom reports and more.
Load data into your warehouse of choice within minutes.

Auditing procedure that ensures secure management of data.
.png)
Complies with Health Insurance Portability
and Accountability Act (HIPAA)

General Data Protection Regulation (GDPR) Certified

Complies with California Consumer Privacy Act (CCPA)

.png)

.png)
A great customer service that always tries to be helpful with a "how can we make it" approach. They understand your needs, provide all relevant solutions to successfully implement them, and make your job done.
.png)


A great customer service that always tries to be helpful with a "how can we make it" approach. They understand your needs, provides all relevant solutions to successfully implement them, and make your job done.
If you consider hiring Improvado, you are also a hiring team that supports you to achieve your goals to become a more data-driven company.
Improvado is helping us to aggregate our paid marketing data from multiple channels and present it in a meaningful way. We are more efficient with reporting our campaign results and have better ideas about what's going on easily.

.png)

.png)
Professional, responsive and willing to go the extra mile to help. They are a solution to connect to most advertising platforms and provide a multitude of metrics from these platforms
.png)

They are willing to go the extra mile to attend to your query and help to the best they can.
Helping to connect to various advertising platform such as Google Ads, Facebook, DV360, Trade Desk.
They are a solution to connect to most advertising platform and provide a multitude of metrics from these platforms