.png)
In 2026, effective dashboards integrate real-time data refresh rates. They distinguish hourly versus daily batch updates. These dashboards map campaign objectives to priority metrics. Campaign objectives include Reach, Website Clicks, and Engagement. They surface alerting thresholds for key performance drops. For example, CTR drops >20% week-over-week signal creative fatigue. They also signal audience saturation. This guide covers dashboard architecture. It addresses metric selection frameworks. It explains reporting limitations. It outlines troubleshooting workflows. The guide helps B2B marketing analysts build decision-grade infrastructure. It assists data teams in Twitter Ads reporting. A Twitter (X) Ads dashboard consolidates campaign performance metrics from the Twitter Ads API into a unified view, enabling marketing analysts to monitor CPM, CTR, conversions, and budget pacing without navigating multiple native reports.
Key Takeaways
• Twitter Ads dashboards transform siloed campaign data into unified visual reports with time-series charts, comparison matrices, and alert-driven notifications for optimization.
• Choose dashboard architecture based on campaign complexity, data volume, and integration requirements rather than defaulting to native Twitter Ads Manager limitations.
• Native Twitter Analytics lacks cross-channel visibility and diagnostic context needed for complete performance monitoring across multiple advertising platforms simultaneously.
• Track impressions, click-through rate, and cost per click metrics with campaign-objective-specific priorities to align measurement with actual business goals.
• API-sourced dashboard data enables active campaign management and performance optimization beyond passive monitoring that built-in tools typically provide marketers.
• Essential metrics require diagnostic context to drive actionable insights; raw numbers alone cannot explain performance changes or inform strategic optimizations effectively.
What Is a Twitter Ads Dashboard?
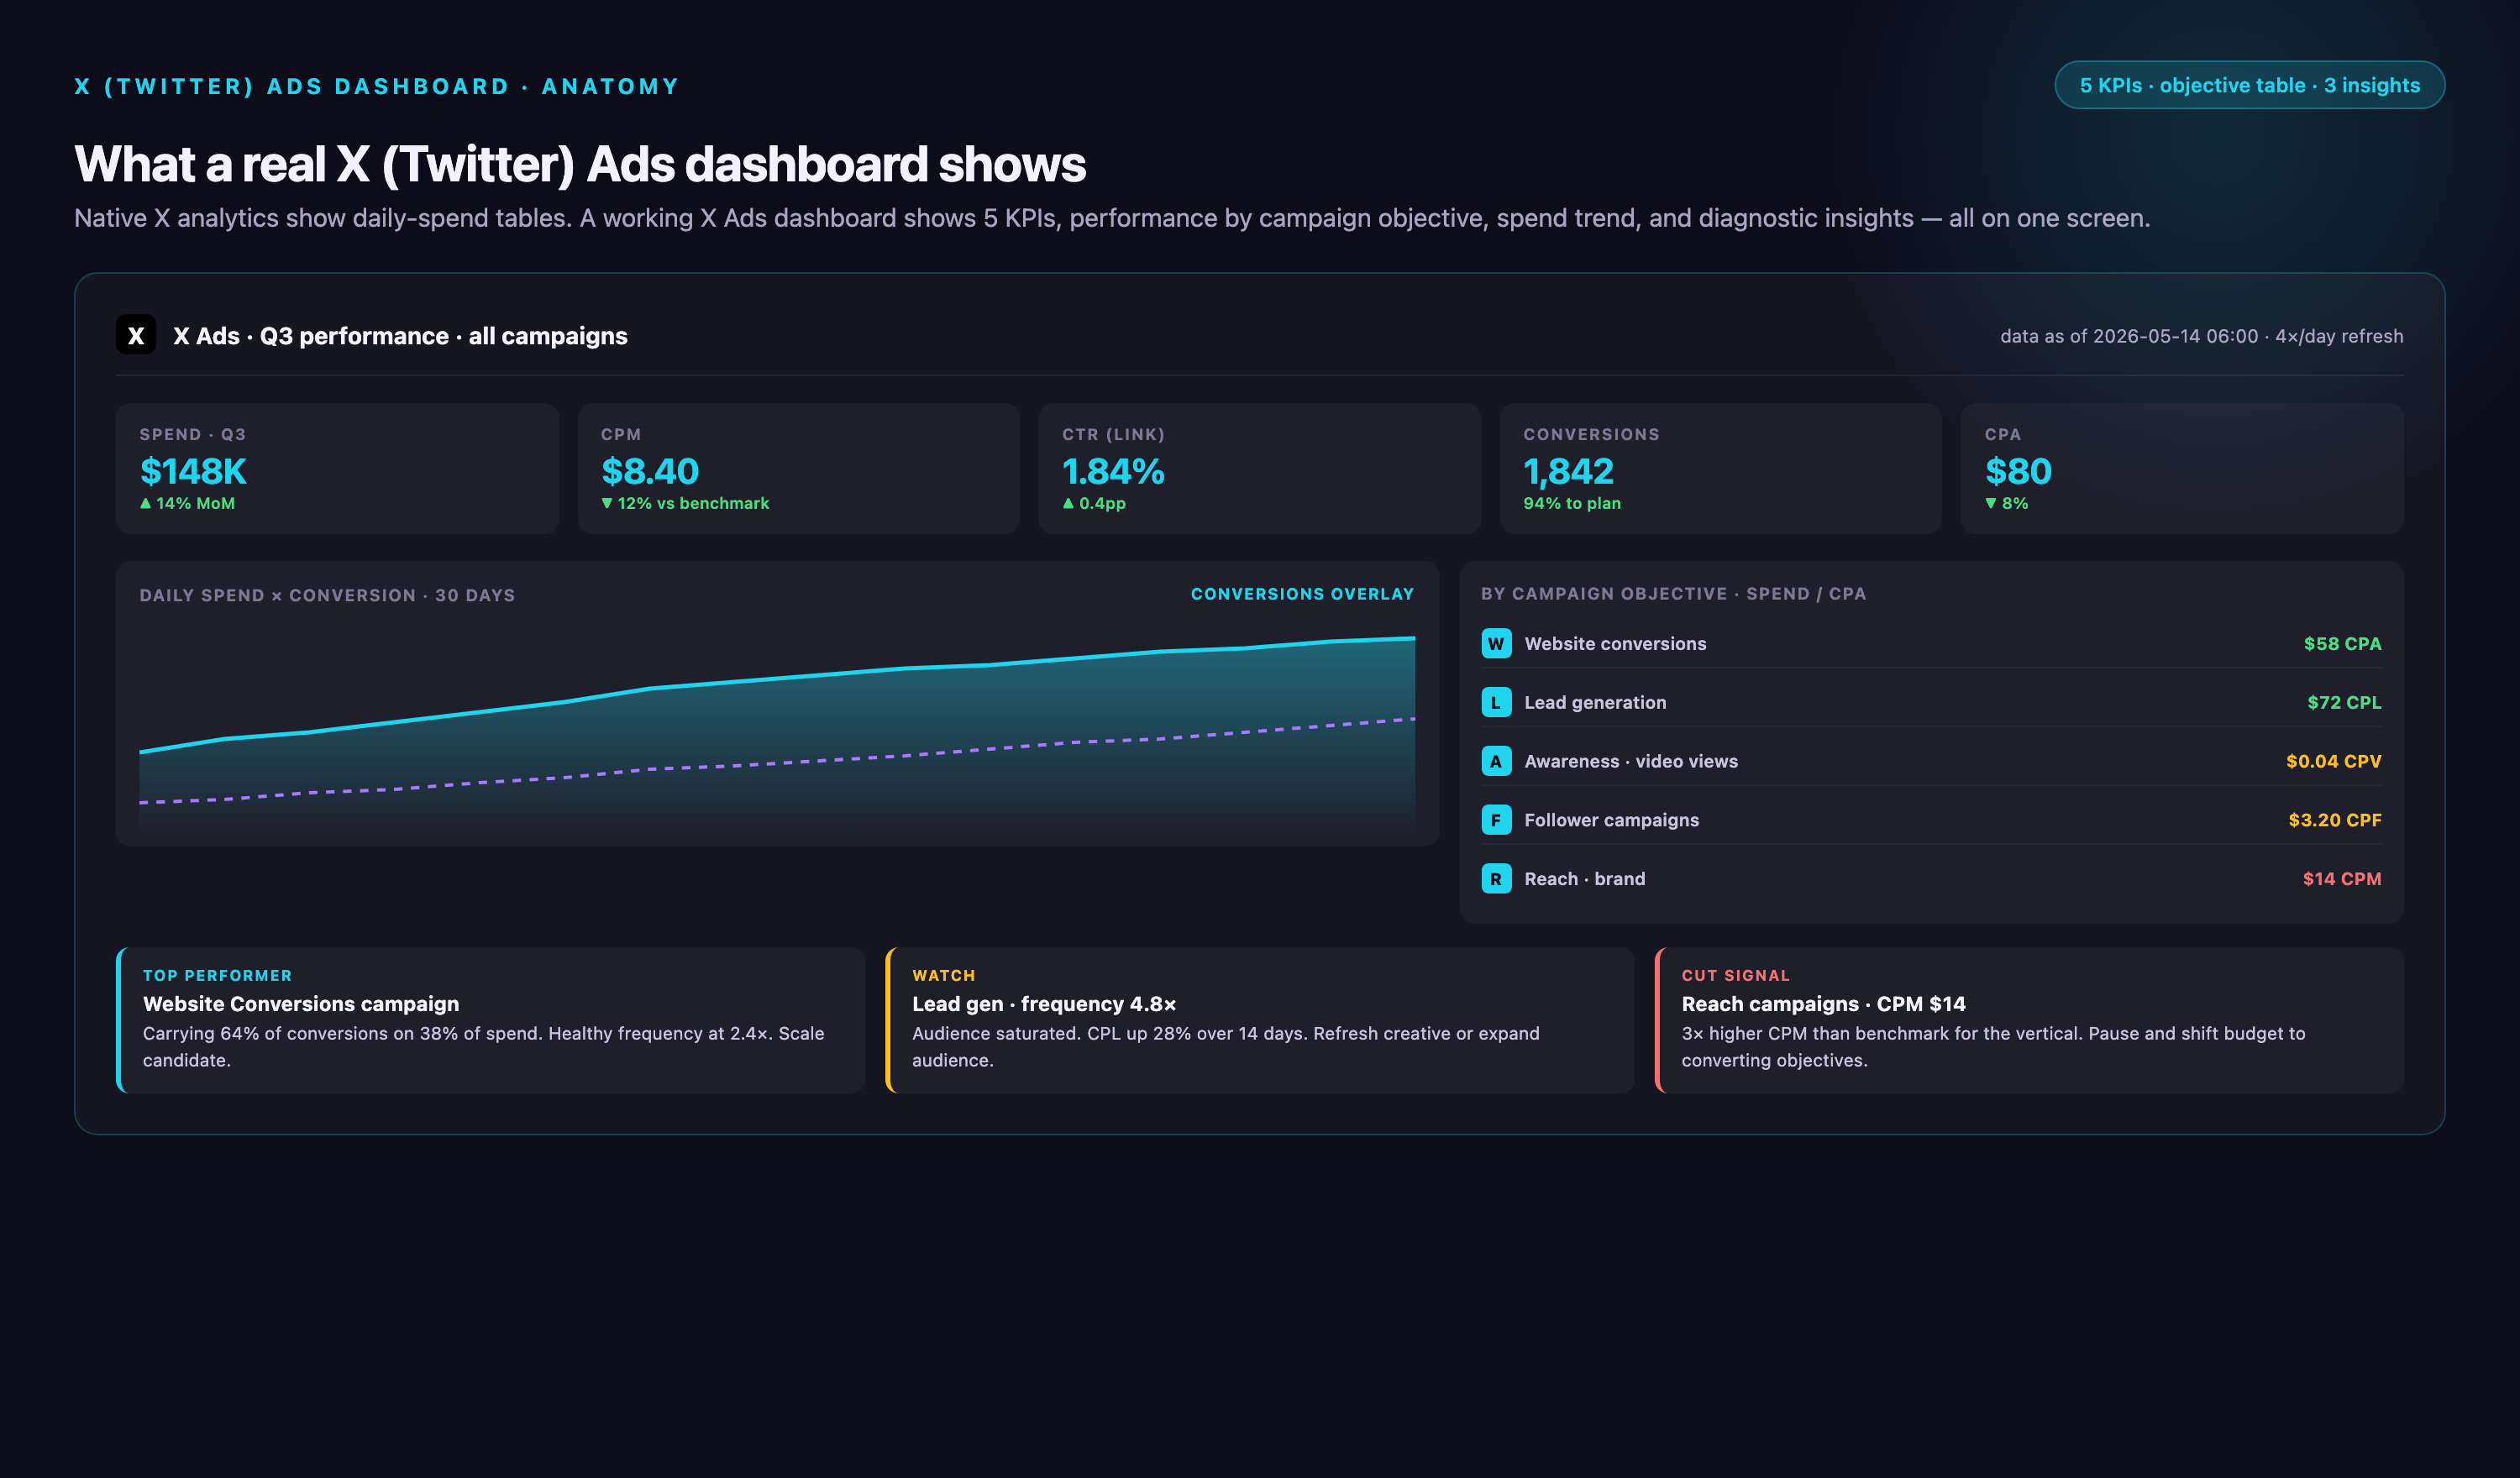
A Twitter Ads dashboard is a visual reporting interface. It aggregates Twitter Ads campaign data into a single view. This data includes impressions, clicks, conversions, and spend. The dashboard enables performance monitoring and optimization. Unlike the native Twitter Ads Manager, dashboards display siloed campaign tables. A dashboard transforms API-sourced data into time-series charts. It also creates comparison matrices and alert-driven notifications.
The foundation of any Twitter Ads dashboard is the Twitter Ads API, which provides programmatic access to campaign metrics with configurable refresh intervals. Marketing teams must decide between:
• Real-time dashboards (API pulls every 15–60 minutes): Essential for high-velocity campaigns where budget pacing and creative rotation require intraday intervention. Best for teams running >$5,000/day in ad spend or managing time-sensitive product launches.
• Batch dashboards (API pulls daily at scheduled intervals): Sufficient for awareness campaigns, monthly budget tracking, or teams analyzing trends over weeks. Reduces API rate limit consumption and data warehouse storage costs.
Dashboard use cases extend beyond passive monitoring to active campaign management:
• : Track CTR, CPM, and engagement rate by campaign objective. For example, monitor "Video Views campaigns." Pause if CPV exceeds $0.15 after 1,000 impressions. Test new creative instead. Campaign performance monitoring
• : Alert when daily spend hits 80% of budget by noon. This prevents campaigns from exhausting funds. It also prevents missing evening traffic windows. Budget pacing detection
• Audience saturation alerts: Rising CPM + flat impressions = audience exhaustion. Dashboard triggers expansion of targeting parameters or audience refresh.
• Creative fatigue signals: CTR decline >20% week-over-week with stable impressions indicates ad creative decay. Dashboard flags campaigns for asset rotation.
A functional Twitter Ads dashboard must answer three diagnostic questions within 30 seconds: (1) Are ads reaching the target audience at planned scale? (2) Which campaigns convert impressions to desired actions at acceptable cost? (3) Where is budget leaking to low-performing placements or audience segments?
Twitter Ads Dashboard Complexity Matrix: Choosing the Right Architecture
Not all teams need the same dashboard sophistication. Complexity should scale with campaign volume and stakeholder reporting requirements. Building an enterprise-grade dashboard for a single $2,000/month campaign wastes engineering time; conversely, using spreadsheet exports for a 50-campaign portfolio creates unmanageable manual overhead.
| Campaign Volume | Reporting Stakeholders | Dashboard Complexity | Must-Have Metrics | Refresh Frequency | Visualization Density |
|---|---|---|---|---|---|
| Low (1–5 campaigns, <$5K/mo spend) | Internal team only | Simple (Google Sheets or native Twitter) | Spend, impressions, CTR, conversions, CPA | Daily manual export or weekly batch | Single table + 2–3 line charts |
| Low (1–5 campaigns, <$5K/mo spend) | Client-facing / executive | Moderate (Google Data Studio or Tableau Public) | Spend, impressions, CTR, conversions, ROAS, top 3 performing ads | Daily automated refresh | 3–5 cards with summary KPIs + trend comparison |
| High (10+ campaigns, >$20K/mo spend) | Internal team only | Advanced (Power BI, Looker, or Tableau) | All core metrics + audience segment breakdowns, creative performance by format, budget pacing, frequency caps | Hourly or 4x/day batch | Multi-tab layout: overview, campaign deep-dive, creative analysis, audience diagnostics |
| High (10+ campaigns, >$20K/mo spend) | Client-facing / executive | Enterprise (Custom BI + marketing analytics platform) | All metrics + cross-channel attribution, LTV projections, cohort retention, competitive benchmarking | Real-time (15–60 min intervals) | Role-based views: exec summary (5 KPIs), analyst workspace (20+ metrics), client portal (white-labeled, filtered) |
Decision rule: If you're exporting Twitter Ads Manager CSV files more than once per week, you've outgrown manual reporting. If stakeholders ask "Why did CTR drop?" and you need >10 minutes to answer, your dashboard lacks diagnostic depth. If campaigns pause due to budget overruns you didn't see coming, your refresh frequency is too slow.
Why Built-In Twitter Analytics Falls Short for Dashboard Reporting
Twitter Ads Manager provides campaign-level tables and basic charts, but lacks the technical foundation and flexibility required for analyst-grade reporting. Three structural limitations make custom dashboards necessary:
Limited Cross-Channel Visibility
Twitter Ads Manager displays only Twitter campaign data—there's no native way to compare Twitter CPM (reported at $2.09–$5.00 avg. in 2026; verify against current benchmark sources) against LinkedIn CPM (reported at approximately $34.50 for B2B; verify against LinkedIn Marketing Solutions data) or Google Ads CPM in a unified view. For marketing teams running multi-platform campaigns, this creates three workflow blockers:
• : To answer "Should I shift $10K from Twitter to LinkedIn this quarter?" requires several steps. First, export data from both platforms. Next, manually align date ranges. Then, reconcile naming inconsistencies (Twitter "engagements" ≠ LinkedIn "interactions"). No cross-platform metric benchmarking
• Fragmented conversion attribution: A user may click a Twitter ad, research via Google, and convert via LinkedIn retargeting. Twitter Ads Manager only shows Twitter touchpoints—full customer journey mapping requires separate attribution tools.
• Manual data consolidation errors: Metric definitions vary across platforms (e.g., Twitter counts video views at 2 seconds; Facebook at 3 seconds). Spreadsheet-based reporting introduces calculation mistakes when teams don't standardize formulas.
Twitter Ads Reporting Technical Limitations
| Limitation Category | Twitter Ads Manager Constraint | Impact on Reporting |
|---|---|---|
| Data Retention | 3-year historical data window | Cannot analyze campaigns older than 36 months; limits year-over-year seasonal trend analysis for mature accounts |
| API Rate Limits | 250 requests per 15-minute window (standard access) | Real-time dashboards must throttle API calls; high-volume accounts (50+ campaigns) cannot refresh all metrics hourly without exceeding limits |
| Missing Metrics | No view-through conversions, limited demographic breakdowns (age/gender only, no income/education) | Cannot measure full attribution funnel; B2B teams lack firmographic data for account-based analysis |
| Custom Calculated Metrics | No native support for ROAS, cost-per-qualified-lead, engagement rate by audience segment | Analysts must export raw data and calculate in external tools; introduces version control issues when formulas differ across team members |
| Export File Size | CSV exports capped at 100,000 rows | Large accounts with granular targeting (keyword-level reporting) hit export limits; must split into multiple files and manually merge |
These technical constraints explain why many marketing teams running Twitter Ads at scale prefer third-party dashboards and marketing analytics platforms over native reporting.
- →1,000+ data sources including Twitter Ads API, Google Ads, Meta, LinkedIn, Salesforce—centralize all marketing data in one warehouse without engineering overhead
- →Marketing Cloud Data Model harmonizes Twitter 'engagements' with LinkedIn 'interactions' and Facebook 'reactions' into unified metrics—no more spreadsheet reconciliation
- →46,000+ metrics and dimensions queryable via no-code interface or SQL—track Twitter Ads performance by campaign, audience, device, and creative without writing custom joins
- →AI Agent answers natural language questions like 'Which Twitter campaigns have CPA <$50 this month?'—instant visualizations for non-technical stakeholders
- →250+ data quality rules detect broken tracking pixels and budget mismatches before dashboards go live—Marketing Data Governance prevents costly reporting errors
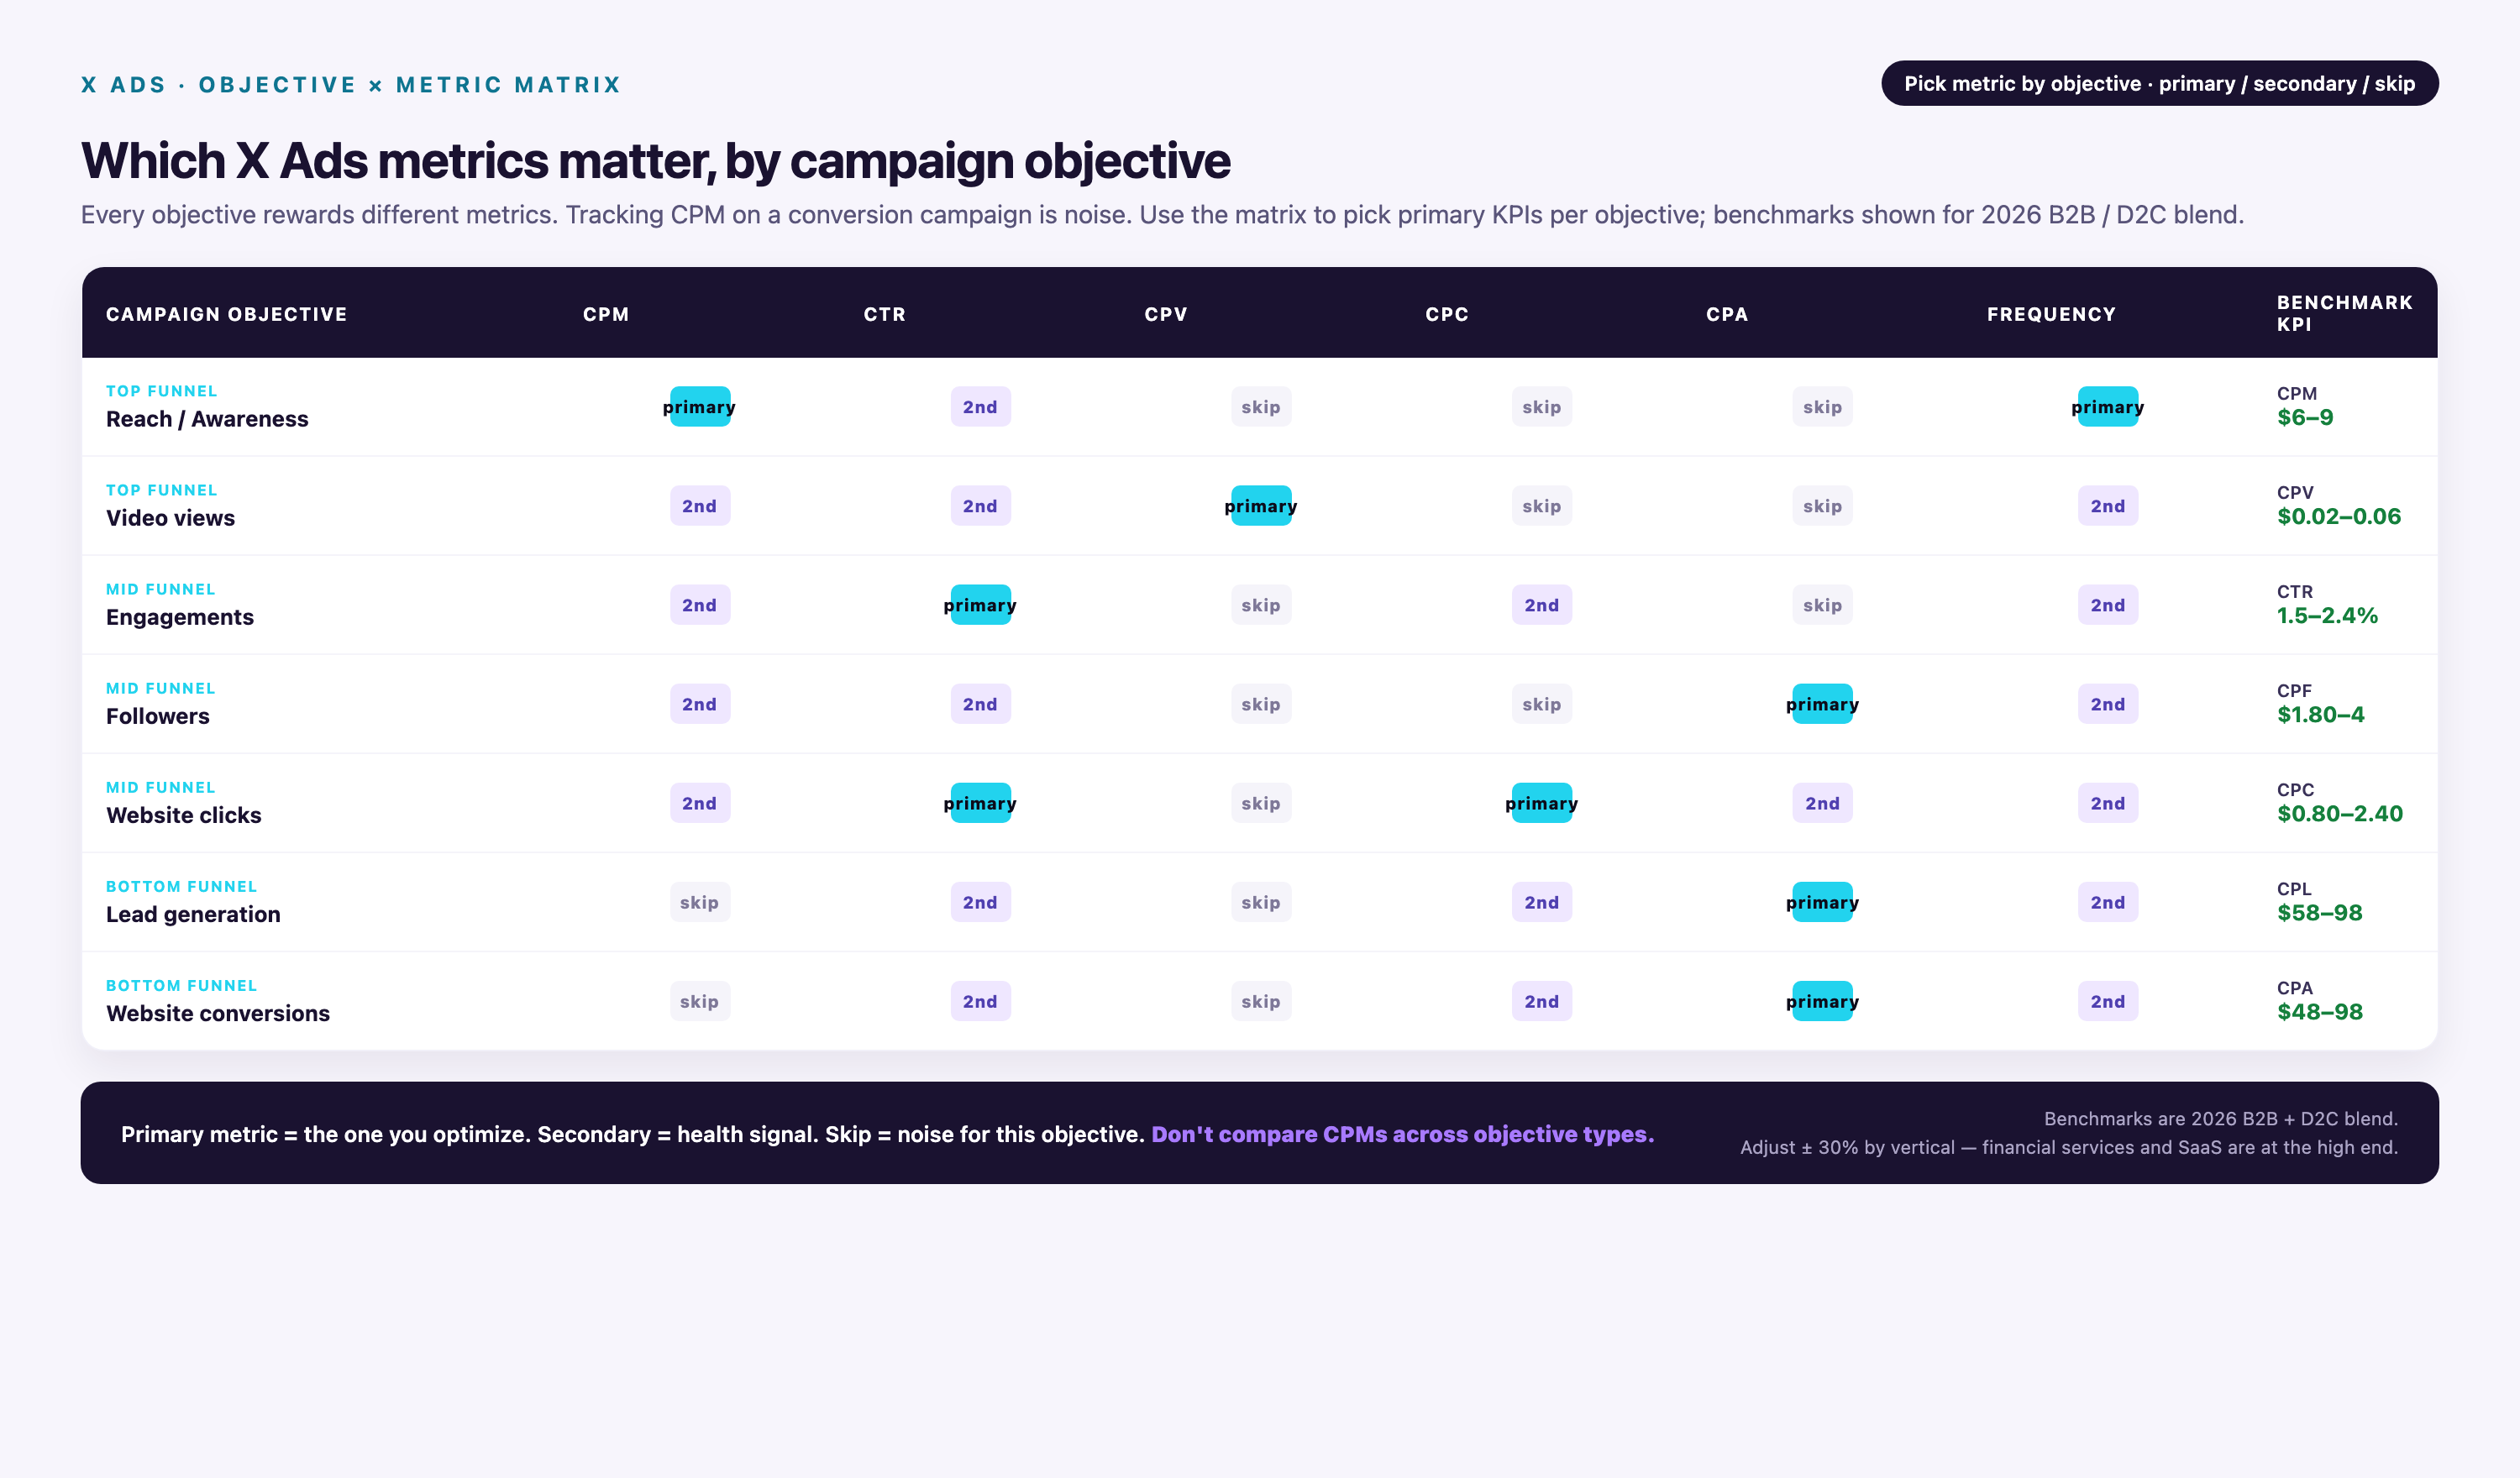
Campaign Objective → Metric Priority Matrix: What to Track for Each Twitter Ads Goal
The most common dashboard mistake is tracking identical metrics across all campaigns regardless of objective. A Reach campaign optimized for CPM has opposite success criteria from an App Installs campaign optimized for CPI. This matrix maps Twitter's six primary campaign objectives to the 3–4 metrics that actually determine performance, plus kill thresholds that signal when to pause underperforming ads.
| Campaign Objective | Primary Metrics (Top 3 to Track) | 2026 Benchmarks | Kill Threshold (When to Pause) | Ignore These Metrics |
|---|---|---|---|---|
| Reach | 1. CPM 2. Unique impressions 3. Frequency |
CPM: $2.09–$5.00 Frequency: 2–4 views per user Reach: 70–80% of target audience in 7 days |
CPM >$6.00 after 5,000 impressions = audience too narrow Frequency >5 = overexposure, creative fatigue likely |
CTR, conversions, engagement rate (Reach campaigns rarely drive clicks—measuring CTR creates false negatives) |
| Video Views | 1. Cost per video view (CPV) 2. Video completion rate 3. View-through rate (VTR) |
CPV: $0.08–$0.15 Completion rate: 25–40% for 30s videos CTR: 4.7% (industry avg CTR for video ads) |
CPV >$0.20 after 1,000 impressions Completion rate <15% after 2,000 views = creative doesn't hook audience |
CPC, CPM (Video Views campaigns bid on watch time, not clicks or impressions) |
| App Installs | 1. Cost per install (CPI) 2. Install rate 3. Day-7 retention (from GA/attribution tool) |
CPI: $1.50–$3.50 (gaming/social apps) Install rate: 8–12% Day-7 retention: 20–30% |
CPI >$5.00 after 500 installs Install rate <5% after 10,000 impressions = poor app store page or targeting mismatch |
CTR, CPM, engagement rate (App Installs optimize for install events, not clicks or impressions) |
| Website Clicks | 1. Click-through rate (CTR) 2. Cost per click (CPC) 3. Landing page conversion rate (from GA) |
CTR: 1–3% CPC: $0.38–$0.75 Landing page CVR: 2–5% (B2B), 1–3% (ecommerce) |
CTR <0.8% after 5,000 impressions = poor ad copy or creative CPC >$2.00 = audience too competitive, expand targeting |
Impressions, CPM (Website Clicks campaigns bid on link clicks, not impression volume) |
| Engagement | 1. Engagement rate 2. Cost per engagement (CPE) 3. Engagement type breakdown (likes vs retweets vs replies) |
Engagement rate: 0.77–1.5% CPE: $0.50–$1.50 Retweets generate 150% more reach than likes |
Engagement rate <0.5% after 10,000 impressions = content doesn't resonate CPE >$3.00 = too expensive for top-of-funnel awareness |
Conversions, landing page metrics (Engagement campaigns optimize for on-platform interactions, not website actions) |
| Followers | 1. Cost per follower 2. Follower growth rate 3. Follower engagement rate (30-day post-follow) |
Cost per follower: $2.00–$4.00 Growth rate: 5–10% monthly for active campaigns Post-follow engagement: 15–25% of new followers interact within 30 days |
Cost per follower >$6.00 = targeting too broad or content doesn't match audience Post-follow engagement <10% = low-quality followers (bots or disinterested users) |
CTR, CPC, conversions (Followers campaigns optimize for profile follows, not clicks or conversions) |
How to use this matrix in your dashboard: Create filtered views by campaign objective. A dashboard showing CTR for Reach campaigns or CPM for App Installs campaigns creates cognitive overhead—stakeholders see metrics that don't align with optimization goals. Instead, use objective-based tabs or dropdown filters that surface only the 3–4 relevant KPIs per campaign type.
Essential Twitter Ads Metrics with Diagnostic Context
The following metrics form the foundation of most Twitter Ads dashboards. Each entry includes not just the definition, but the diagnostic question it answers and the red flags that signal deeper problems.
Impressions
Impressions count the total number of times your ads appeared in user feeds, regardless of whether users scrolled past or engaged. In 2026, Twitter has reported strong year-over-year impressions growth driven by mobile usage, with a significant share of user sessions including some ad exposure (verify current figures in X/Twitter's latest earnings disclosures).
Diagnostic question: Is my campaign reaching sufficient scale to generate statistically significant results?
Red flags:
• Impressions plateau at 20–30% of available audience despite high bids = targeting too narrow (expand keywords, interests, or lookalike audiences)
• Impressions spike but engagement/clicks remain flat = ad served to wrong audience or creative doesn't hook attention in first 2 seconds
• Impressions drop >40% week-over-week with no budget changes = audience fatigue or competitor outbidding you in auction
Click-Through Rate (CTR)
CTR measures the percentage of impressions that resulted in a click on your ad. Formula: (Clicks ÷ Impressions) × 100. In 2026, Twitter Ads CTR averages 1–3% for B2B campaigns, generally above LinkedIn's reported average CTR but below benchmarks observed for video ad formats (verify current figures against platform-published benchmark reports).
When to track CTR: Website traffic campaigns, lead generation, ecommerce. When to ignore CTR: Engagement campaigns (optimize for likes/retweets, not clicks), Follower campaigns (optimize for profile follows), Reach campaigns (optimize for impressions, not clicks).
Diagnostic question: Is my ad creative compelling enough to drive action?
Red flags:
• CTR drops >20% week-over-week = check ad fatigue (rotate creative), audience saturation (expand targeting), or creative decay (competitors running better ads)
• High CTR (>4%) but low landing page conversions in GA = bot traffic, accidental mobile clicks, or landing page doesn't match ad promise
• Organic tweet CTR 0.5–1.5% but paid CTR <1% = paid targeting misaligned with organic audience.
• Use organic high-performers to validate creative before scaling to paid.
Cost Per Click (CPC)
CPC measures the average cost each time a user clicks your ad. Formula: Total Ad Spend ÷ Total Clicks. In 2026, Twitter Ads CPC ranges $0.38–$0.75 (generally below LinkedIn B2B CPC but above Facebook broad-targeting CPC benchmarks; verify current figures against platform-published or reputable third-party benchmark reports).
Diagnostic question: Am I paying a competitive rate to acquire website traffic?
Red flags:
• CPC > $2.00 = audience too competitive. For example, targeting "SaaS CMO" competes with every B2B vendor. Expand to related but less expensive keywords.
• CPC increases >30% month-over-month with stable targeting indicate auction competition intensified. This is common in Q4. Alternatively, your Quality Score declined. Twitter rewards relevant ads with lower CPCs.
• CPC varies wildly by time of day (e.g., $0.50 at 3am, $1.20 at 2pm) = dayparting opportunity—pause campaigns during expensive hours
Cost Per Mille (CPM)
CPM measures the cost to deliver 1,000 ad impressions. Formula: (Total Ad Spend ÷ Impressions) × 1,000. In 2026, Twitter Ads CPM averages $2.09–$5.00, significantly lower than LinkedIn B2B CPM of $34.50.
When to track CPM: Awareness/reach campaigns only. When to ignore CPM: Lead-gen or conversion campaigns where cost-per-acquisition (CPA) is the only metric that matters—a $10 CPM that generates $5 CPA is better than a $3 CPM that generates $20 CPA.
Red flags:
• Rising CPM + flat impressions = audience saturation. Your existing audience has seen your ad 4–5+ times. Twitter's algorithm is raising costs to find new users.
• CPM >$6.00 for reach campaigns indicates targeting that's too specific. A 20K user audience cannot deliver scale economies. Expand targeting or shift budget to other platforms.
Engagement Rate
Engagement rate measures the percentage of impressions that resulted in any interaction: likes, retweets, replies, profile clicks, or media views. Formula: (Total Engagements ÷ Impressions) × 100. In 2026, Twitter Ads engagement rate averages 0.77–1.5%, with platform engagement reported to be growing year-over-year (verify current figures against X/Twitter's latest published data).
Diagnostic question: Is my content resonating with the target audience?
Red flags:
• High engagement rate (>2%) but low conversion rate = content is entertaining but not persuasive.
• Ad creative is optimized for virality instead of purchase intent.
• Reply engagement has declined year-over-year due to bot/spam pollution. Ignore raw reply counts. Filter for verified users instead. Use sentiment analysis to identify genuine interactions.
• Retweets generate significantly more reach than likes—if engagement is 80% likes and 5% retweets, creative lacks shareability
Conversions and Conversion Rate
Conversions track completed actions on your website or app after a user clicked your Twitter ad: form submissions, purchases, sign-ups, downloads. Conversion rate = (Conversions ÷ Clicks) × 100. In 2026, Twitter Ads conversion rates range 1–3% for B2B (finance/tech sectors) and 1–6% across industries depending on funnel stage.
Critical dashboard requirement: Conversion tracking requires integration between Twitter's conversion pixel and your analytics platform (Google Analytics, Adobe Analytics, or CRM). Dashboard must pull conversion data from the tracking source, not Twitter Ads Manager alone.
Red flags:
• Twitter Ads Manager reports 100 conversions; Google Analytics reports 75 conversions = attribution discrepancy (see Twitter Ads Reporting Discrepancy Matrix below)
• Conversion rate <0.5% after 1,000 clicks indicates issues. Landing page may be misaligned with ad promise. Page load time may exceed 3 seconds. Mobile experience may be broken.
• Conversions cluster in first 3 days of campaign then drop 70%. This indicates targeting burned through high-intent audience. Expand targeting or introduce audience exclusions. This prevents repeat impressions.
Cost Per Acquisition (CPA)
CPA measures the average cost to generate one conversion. Formula: Total Ad Spend ÷ Total Conversions. This is the ultimate profitability metric—if your customer lifetime value (LTV) is $500 and your CPA is $600, the campaign is unprofitable regardless of CTR, engagement, or other vanity metrics.
Diagnostic question: Can I scale this campaign profitably?
Red flags:
• CPA increases >40% when scaling budget from $1K/day to $5K/day = moved beyond core high-intent audience into lower-converting peripheral audience
• CPA identical across all audience segments = you're not segmenting audiences in dashboard
• Some segments always outperform others
• For example, retargeting CPA typically runs 50–70% lower than prospecting CPA
Return on Ad Spend (ROAS)
ROAS measures revenue generated per dollar spent on ads. Formula: Revenue from Twitter Ads ÷ Total Twitter Ad Spend. A ROAS of 3:1 means every $1 spent generates $3 in revenue. Twitter Ads Manager does not calculate ROAS natively—dashboards must pull revenue data from ecommerce platforms, CRMs, or Google Analytics Enhanced Ecommerce.
Minimum viable ROAS thresholds:
• Ecommerce (low margin): 4:1 minimum to cover product costs, fulfillment, overhead
• SaaS (high margin): 3:1 minimum for new customer acquisition; 5:1+ for sustainable growth
• Lead-gen (enterprise B2B): Calculate ROAS based on pipeline value, not closed revenue, since sales cycles span 6–18 months
Ad Spend and Budget Pacing
Ad Spend tracks cumulative dollars spent on campaigns. Budget pacing compares actual spend trajectory against planned spend to detect overruns or underspend.
Dashboard must show: Daily ad spend vs. daily budget, month-to-date spend vs. monthly budget projection. Alert threshold: if spend hits 80% of daily budget by noon, campaigns may exhaust budget and miss evening traffic (Twitter users peak 12pm–3pm and 6pm–9pm ET).
Red flags:
• Spent 40% of monthly budget in first 10 days = pacing too fast.
• Campaigns will exhaust budget mid-month.
• Campaigns will go dark during final two weeks.
• Spent 15% of monthly budget in first 20 days = pacing too slow.
• Either bids are too low (losing auctions) or targeting is too narrow (not enough inventory).
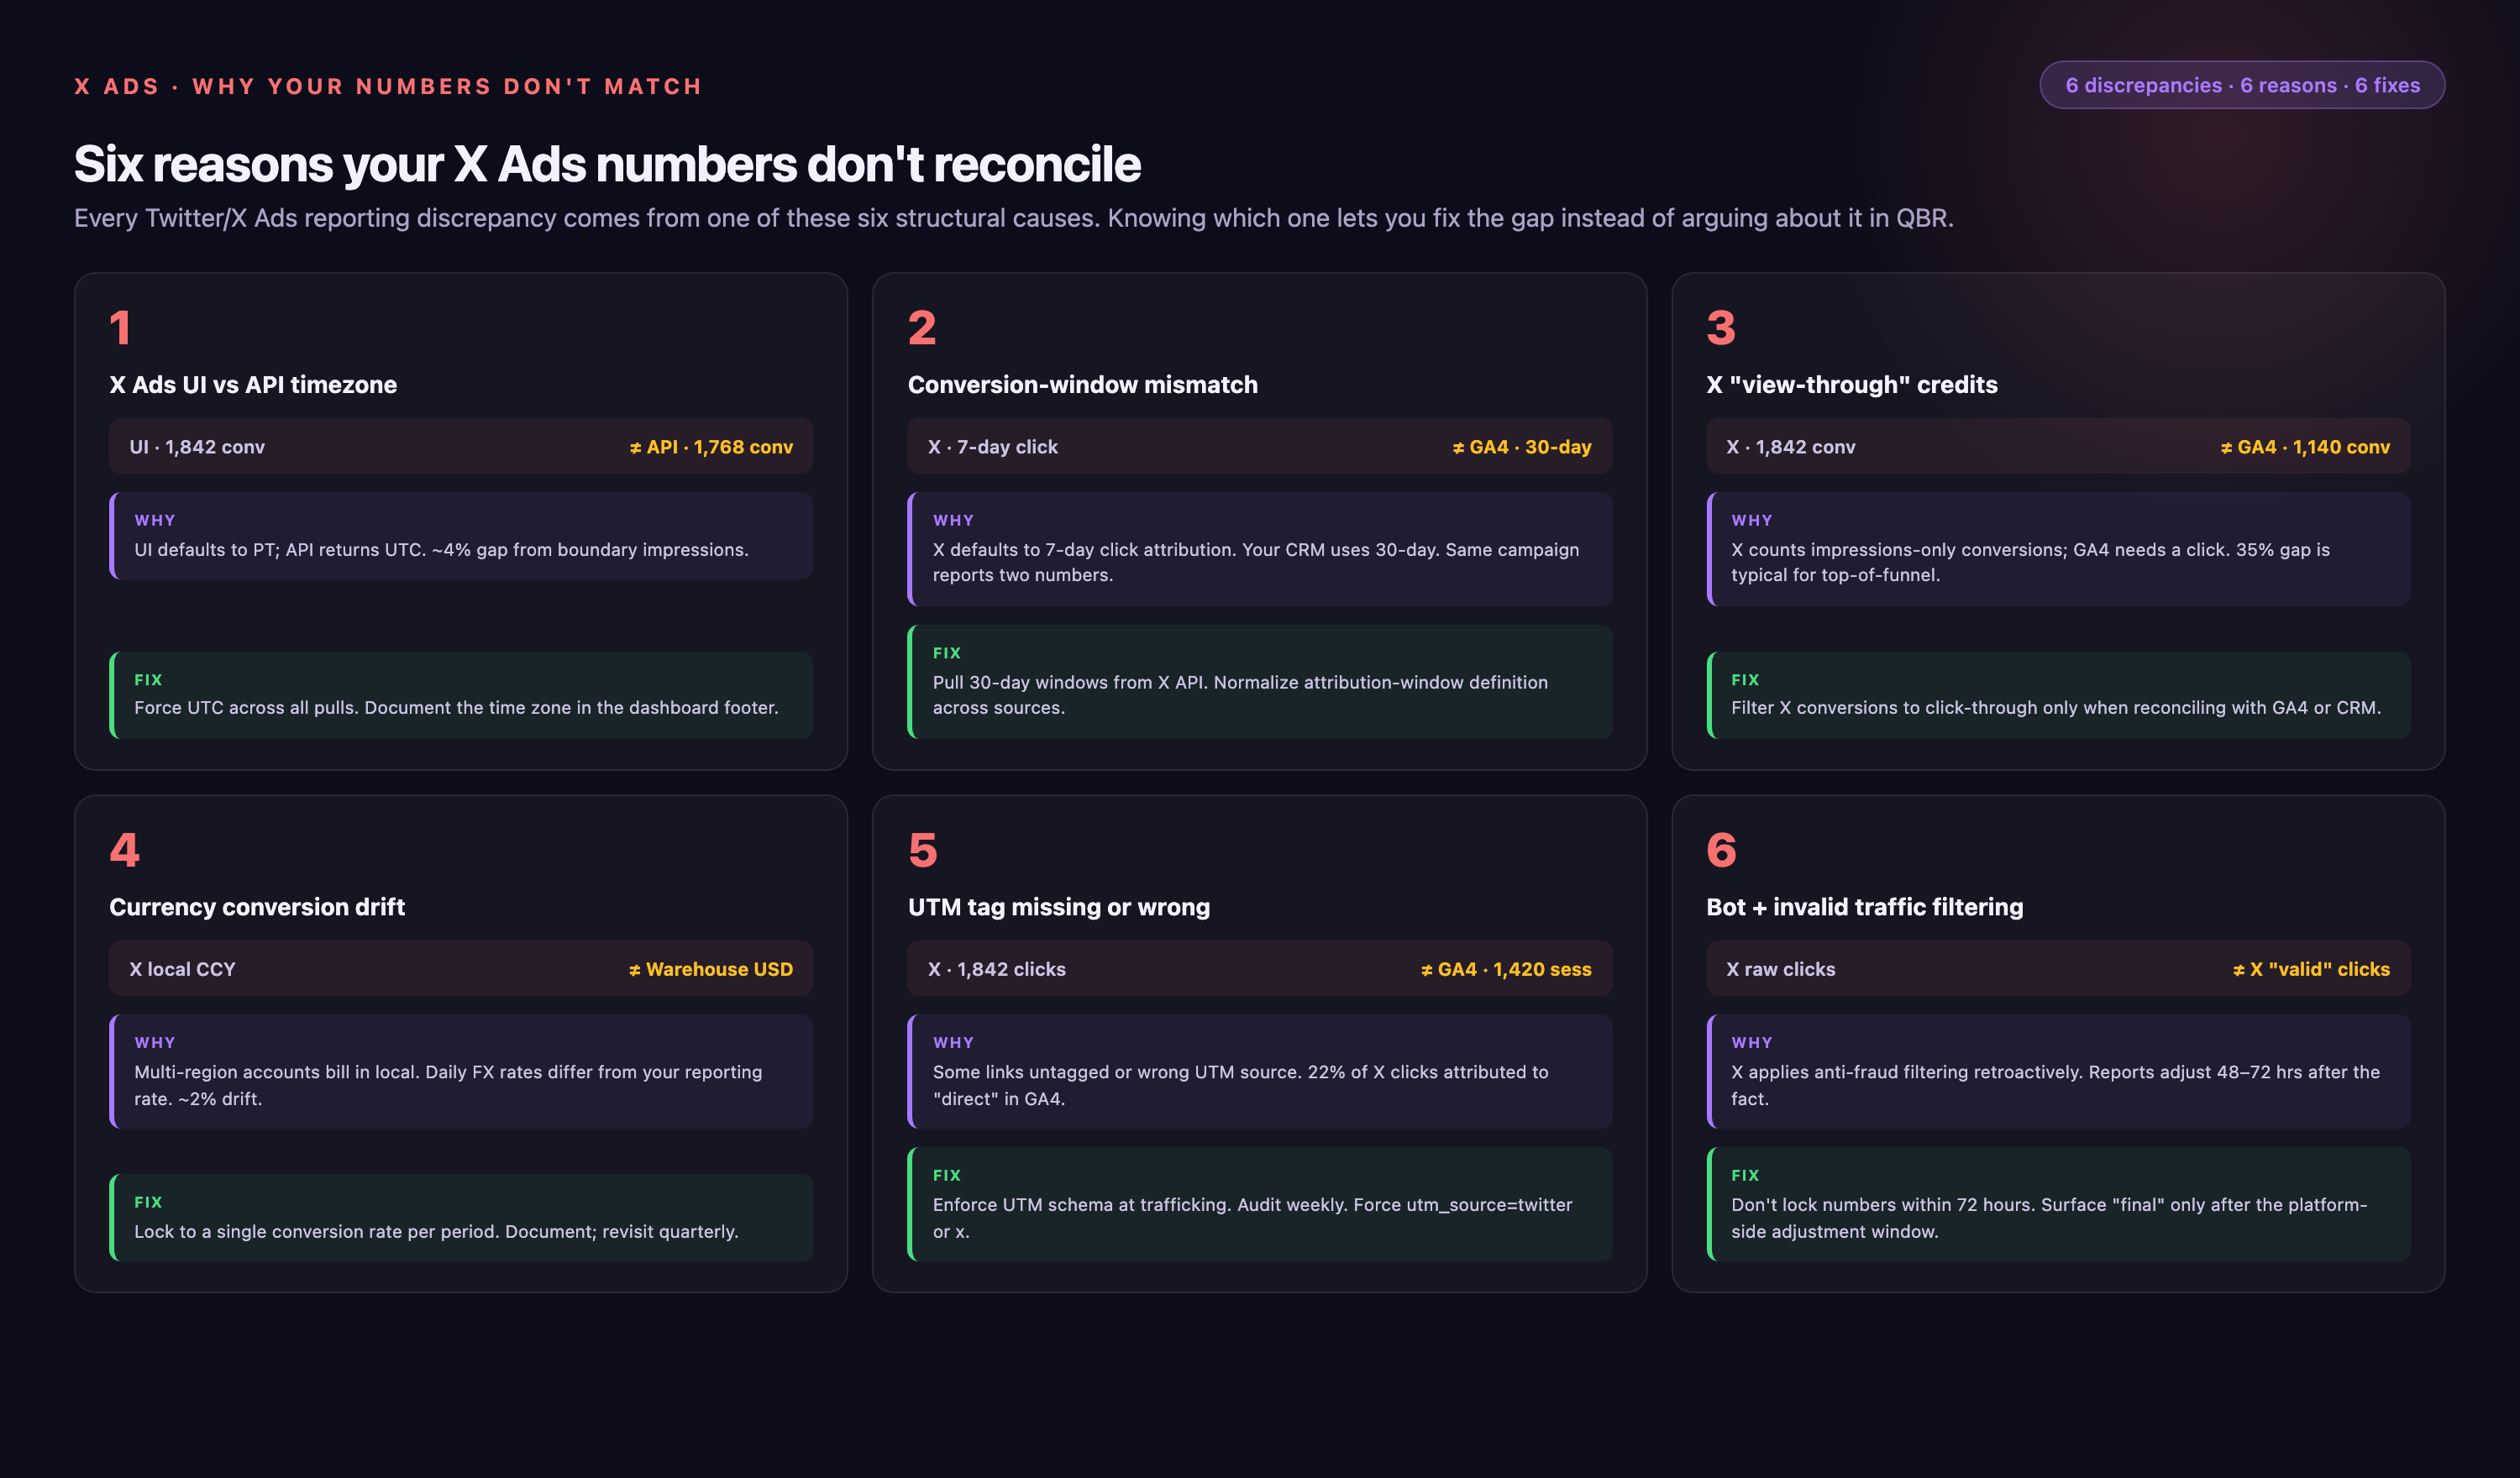
Twitter Ads Reporting Discrepancy Matrix: Why Your Numbers Don't Match
Marketing analysts frequently encounter conversion count mismatches between Twitter Ads Manager, Google Analytics, and third-party attribution tools. A campaign reports 120 conversions in Twitter but only 90 in GA4—which number is "correct"? The answer depends on understanding each platform's attribution logic, tracking methodology, and technical limitations.
| Reporting Platform | Attribution Window | Cookie / Tracking Method | Click vs. View-Through Logic | Why Counts Differ |
|---|---|---|---|---|
| Twitter Ads Manager | 1-day click, 1-day view (default) Adjustable to 7- or 30-day |
Twitter Pixel (first-party cookie + session storage) | Attributes conversions to last Twitter ad click OR last Twitter ad view within attribution window | Includes view-through conversions (user saw ad but didn't click, converted later); may double-count if user clicked multiple Twitter ads in same session |
| Google Analytics 4 (GA4) | 30-day lookback for non-direct clicks, 90-day for direct traffic; no view-through tracking by default (data-driven attribution) | Google Analytics tag (first-party + third-party cookies, degrades to session-only on Safari/Firefox) | Attributes conversions to last non-direct click (requires UTM parameters on Twitter ads) | Undercounts vs. Twitter if UTM parameters missing (traffic appears as "direct"); overcounts if attribution window longer than Twitter's; no view-through tracking |
| Third-Party Attribution (e.g., Improvado, HubSpot) | Configurable (typically 30-day click, optional view-through) | Integrates Twitter Ads API + CRM/ecommerce data; no additional pixel required | Multi-touch attribution: assigns fractional credit across all touchpoints in customer journey | Shows different numbers than last-click models (Twitter, GA4); reveals Twitter's assist role in multi-platform journeys; most accurate for complex B2B funnels with 5–10 touchpoints |
Step-by-Step Reconciliation Workflow
When Twitter Ads Manager and GA4 show conflicting conversion counts, follow this diagnostic sequence:
• Verify UTM parameters are appended to all Twitter ad URLs. In Twitter Ads Manager, go to campaign settings → Website URL and confirm structure: https://yoursite.com/page?utm_source=twitter&utm_medium=cpc&utm_campaign=campaign_name. Missing UTMs cause GA4 to categorize traffic as "direct" instead of "twitter / cpc".
• Align date ranges and time zones. Twitter Ads Manager defaults to account time zone; GA4 defaults to property time zone. A conversion at 11:00pm ET on March 15 may appear as March 16 in GA4 if the property is set to UTC or a time zone ahead of ET (e.g., CET/GMT+1).
• Check attribution windows. Twitter's 1-day click window is narrower than GA4's 90-day click window. Export conversion timestamps from both platforms and filter GA4 to 1-day post-click to match Twitter's logic.
• Inspect view-through conversions. Twitter Ads Manager includes view-through conversions by default (user saw ad, didn't click, converted later). GA4 does not track view-through without custom implementation. Export Twitter conversions and filter to "click" conversions only for apples-to-apples comparison.
• Audit for duplicate conversions. If a user clicks three different Twitter ads in one session then converts, Twitter may count three conversions. GA4 counts one conversion attributed to the last click. Check Twitter's "conversion path" report to identify multi-click journeys.
• Verify tracking pixel health. Use Twitter Pixel Helper browser extension to confirm pixel fires on conversion pages. Common issues: pixel not installed on thank-you page, pixel fires before page loads (conversion not recorded), or ad blockers preventing pixel from sending data (15–30% of users block tracking).
Recommended dashboard approach: Display both Twitter Ads Manager conversions and GA4 conversions side-by-side with a "variance %" column. Add tooltip explaining: "Twitter includes view-through; GA4 is click-only. 10–20% variance is normal. Investigate if variance >30%." This sets stakeholder expectations and prevents false alarm from natural discrepancies.
Twitter Ads Dashboard Troubleshooting: Diagnostic Flowchart for Poor Performance
When a Twitter Ads dashboard shows declining performance—CTR drops, CPA spikes, ROAS falls—the root cause is rarely obvious. This decision tree walks through systematic diagnosis, starting with data accuracy checks before moving to campaign optimization.
| Symptom | Diagnostic Check #1 | Diagnostic Check #2 | Diagnostic Check #3 | Remediation Steps |
|---|---|---|---|---|
| CTR dropped >20% week-over-week | Impressions stable or increasing? → Yes = creative fatigue | Frequency >5 views per user? → Yes = audience overexposure | Competitors launched new campaigns? → Check Twitter ad library for competitor creative | Rotate 2–3 new creative variations; expand audience by 30–50%; pause top-spending campaigns for 72 hours to reset frequency |
| CPC increased >30% month-over-month | Check auction competition: Twitter Ads Manager → Tools → Auction Insights → see competitor overlap % | Ad quality ranking declining? → Twitter's auction rewards relevant, engaging ads with lower CPCs—review ad relevance signals in Twitter Ads Manager | Seasonality? → Q4 (Oct-Dec) CPCs typically 40–60% higher than Q2 | Expand to related but less competitive keywords; improve ad relevance (match headline to keyword); increase budget to win more auctions; or pause until off-peak season |
| High clicks, low conversions | Landing page load time? → Test with Google PageSpeed Insights; >3 seconds load time is associated with significantly higher bounce rates | Mobile vs. desktop conversion rate? → Twitter is 80% mobile; if mobile CVR <50% of desktop, page not mobile-optimized | Message match? → Ad headline = landing page H1? If mismatched, users bounce thinking they clicked wrong link | Optimize landing page speed (compress images, enable caching); A/B test mobile-specific page; ensure ad copy and landing page promise identical offer |
| Impressions plateau despite high bids | Audience size? → Twitter Ads Manager shows estimated audience; if <50K users, you've saturated the pool | Frequency >4? → You're re-showing ads to same users because audience too small | Budget exhausted early? → Check hourly spend curve; if 80% of budget gone by 2pm, campaigns go dark for evening traffic | Expand targeting: add related keywords, broader interests, lookalike audiences; or increase daily budget by 50% to capture evening inventory |
| Conversions cluster in first 3 days then drop | Burned through high-intent audience? → Check audience overlap; if targeting identical audiences across 3+ campaigns, first campaign captures best users | Conversion lag? → B2B conversions often occur 7–14 days post-click; expand attribution window to 30 days in Twitter Ads Manager | Seasonal demand? → Product launches, events, or news cycles create short-lived intent spikes | Introduce audience exclusions (users who converted or engaged); expand to colder audiences (broader interests); or accept natural decay and shift budget to other channels |
Dashboard alert automation: Configure alerts for these thresholds in your BI tool—CTR <1% for 2 consecutive days, CPC >$1.50 for Website Clicks campaigns, conversion count drops >40% week-over-week with stable clicks. Alerts trigger diagnostic workflow before performance craters.
When NOT to Build a Twitter Ads Dashboard
Dashboards incur setup costs (engineering time, BI tool licenses, API maintenance) that don't always justify the return. These scenarios indicate native Twitter Ads Manager reporting suffices:
• Monthly ad spend <$2,000: With 1–2 campaigns and <100 conversions/month, statistical noise exceeds signal. Weekly CSV exports into Google Sheets provide adequate visibility.
• Single-objective campaigns: If you're only running Follower campaigns with one KPI (cost per follower), Twitter Ads Manager's native campaign table is sufficient. Custom dashboards add value when tracking 6+ metrics across multiple objectives.
• No cross-channel strategy: Teams running Twitter Ads in isolation (not integrated with Facebook, LinkedIn, Google Ads, or email) gain limited value from unified dashboards. Native Twitter reporting answers all relevant questions.
• No attribution complexity: Ecommerce brands with last-click attribution and single-session purchase journeys don't need multi-touch attribution dashboards. Twitter Ads Manager's conversion tracking is adequate.
• Stakeholders check performance <1x/week: If leadership reviews Twitter Ads results in monthly QBRs only, real-time dashboards are overbuilt. Scheduled email reports (PDF exports) meet stakeholder needs at lower cost.
• Team lacks dashboard maintenance capacity: Dashboards degrade—API schema changes break connectors, metrics definitions shift, new campaign types require updated logic. If your team can't dedicate 2–4 hours/month to dashboard maintenance, stick with native reporting.
Threshold rule: If you're exporting Twitter Ads data to answer the same question more than 2x/week, you've crossed the automation threshold—build the dashboard. If questions arise <1x/week, manual exports remain more cost-effective.
Twitter Ads Performance Benchmarks by Industry (2026)
Contextualizing your dashboard metrics requires industry-specific benchmarks. A 1.2% CTR may signal underperformance in tech/SaaS (where 2–3% is achievable) but exceed expectations in automotive (where 0.8% is typical). These benchmarks help analysts identify whether poor performance stems from campaign execution or industry-wide headwinds.
| Industry | Median CTR | Median CPM | Median CPC | Engagement Rate | Conversion Rate |
|---|---|---|---|---|---|
| Technology / SaaS | 2.0–3.0% | $3.50–$5.00 | $0.60–$0.90 | 1.2–1.8% | 2–4% (trial sign-ups) |
| Financial Services | 1.5–2.5% | $4.00–$6.00 | $0.75–$1.20 | 0.9–1.4% | 1–3% (account applications) |
| Ecommerce / Retail | 1.0–2.0% | $2.00–$4.00 | $0.40–$0.70 | 1.0–1.6% | 1–2% (purchases) |
| Media / Publishing | 2.5–4.0% | $2.00–$3.50 | $0.30–$0.50 | 1.8–2.5% | 3–6% (newsletter sign-ups) |
| Healthcare / Pharma | 1.2–2.0% | $3.00–$5.00 | $0.70–$1.10 | 0.8–1.3% | 1–2% (appointment bookings) |
| Education / EdTech | 1.8–2.8% | $2.50–$4.00 | $0.50–$0.80 | 1.4–2.0% | 3–5% (course enrollments) |
| Travel / Hospitality | 1.0–1.8% | $2.00–$3.50 | $0.45–$0.75 | 1.1–1.7% | 0.5–1.5% (bookings) |
| Automotive | 0.8–1.5% | $3.00–$5.00 | $0.80–$1.40 | 0.7–1.2% | 0.5–1% (test drive requests) |
| Real Estate | 1.0–2.0% | $2.50–$4.50 | $0.60–$1.00 | 0.9–1.5% | 1–2% (contact forms) |
| Cryptocurrency / Web3 | 2.5–4.5% | $3.00–$6.00 | $0.50–$0.90 | 2.0–3.0% | 2–4% (wallet connects) |
How to use these benchmarks: If your CTR falls below the lower bound of your industry range for 3+ consecutive weeks, diagnose creative or targeting issues. If your CTR exceeds the upper bound but conversions remain low, the problem shifts to landing page or offer quality, not ad performance. Benchmarks contextualize whether to optimize campaigns or accept industry-standard performance.
Twitter Ads Cost Model by Campaign Type: Budgeting for Statistical Significance
One of the most common dashboard mistakes is declaring a campaign "successful" or "failed" before reaching statistical significance. A campaign with 50 impressions and 2 clicks (4% CTR) looks strong but hasn't accumulated enough data to distinguish signal from noise. This table shows minimum budget and time required to reach 95% confidence across Twitter's campaign objectives.
| Campaign Type | Avg CPM / CPC / CPV | Min Budget for Stat Significance | Min Time to Results | Creative Refresh Frequency | Expected Performance Decay Curve |
|---|---|---|---|---|---|
| Reach | CPM $2.09–$5.00 | $300 (to reach 100K+ impressions) | 3–5 days | Every 14 days (frequency >4 triggers decay) | CPM stable for 10–14 days, then +20–30% as audience saturates |
| Video Views | CPV $0.08–$0.15 | $200 (to reach 1,500+ views) | 3–5 days | Every 21 days (video fatigue slower than static) | Completion rate drops 15–20% after 2,000 views to same audience |
| App Installs | CPI $1.50–$3.50 | $500 (to reach 150+ installs) | 5–7 days | Every 14 days (app store creative + Twitter ad both matter) | Install rate drops 25% after 5,000 impressions; expand targeting weekly |
| Website Clicks | CPC $0.38–$0.75 | $400 (to reach 600+ clicks for CTR confidence) | 5–7 days | Every 10–14 days | CTR drops 20–30% after 10K impressions; rotate headline/image |
| Engagement | CPE $0.50–$1.50 | $500 (to reach 400+ engagements) | 3–5 days | Every 7–10 days (engagement fatigue fastest) | Engagement rate drops 30–40% after 7 days to same audience |
| Followers | Cost per follower $2.00–$4.00 | $600 (to reach 150+ followers) | 7–10 days | Every 21 days | Cost per follower increases 20% after 5,000 impressions; slower decay than engagement |
: If a campaign has spent less than 80% of the minimum budget for statistical significance, suppress performance alerts. The data isn't reliable yet. Once minimum spend is reached, enable alerts for kill thresholds. For example: "Website Clicks campaign spent $400, CTR = 0.6%, trigger 'poor creative' alert". Dashboard alert logic
Best Practices for Twitter Ads Reporting and Optimization
Building a dashboard is the first step; using it to drive continuous optimization is where ROI compounds. These practices separate high-performing marketing teams from those who build dashboards but never improve campaigns.
1. Establish Weekly Review Cadence with Role-Specific Dashboards
Different stakeholders need different views of the same data. Executives want 5 KPIs (spend, ROAS, CPA, impression share, top campaign); analysts need 20+ metrics with audience segment breakdowns; account managers need creative performance and A/B test results.
Recommended weekly workflow:
• Monday 9am: Analyst reviews dashboard for anomalies (CTR drops >20%, CPA spikes >30%, budget pacing off by >15%). Creates JIRA tickets for issues requiring deep-dive.
• Tuesday 10am: Cross-functional 30-minute standup with marketing, creative, and analytics. Dashboard projected on screen. Review: (1) campaigns hitting kill thresholds → pause decisions, (2) top performers → scale budget, (3) A/B test results → declare winners.
• Friday 3pm: Analyst exports PDF snapshot of week's performance for stakeholder async review. Includes 3-bullet "what we learned" section and 3-bullet "what we're testing next week" plan.
2. Implement Red-Flag Thresholds with Automated Alerts
Dashboards that require manual inspection every day create alert fatigue. Configure automated alerts for decision-forcing thresholds:
• Budget pacing: Alert if spend hits 80% of daily budget before 2pm or 40% of monthly budget before day 10.
• Performance decay: Alert if CTR drops >25% week-over-week OR CPA increases >40% week-over-week (excludes first 3 days of new campaigns).
• Conversion tracking failure: Alert if click volume stable but conversion count drops to zero for 24+ hours (indicates broken tracking pixel).
• Audience saturation: Alert if CPM increases >30% week-over-week while impressions remain flat (signals need to expand targeting).
3. Rotate Creative Every 10–14 Days Based on Frequency Data
Twitter's algorithm shows ads to the same users repeatedly until frequency caps are hit. Dashboard must surface frequency metric (average impressions per user). When frequency exceeds 4–5, CTR typically drops 25–40% even if creative is strong—users have seen it too many times.
Creative rotation strategy: Prepare 4–6 creative variations (different headlines, images, video hooks) before launching campaign. When dashboard shows frequency >4 for a campaign, pause the ad and activate the next creative variation. This maintains CTR without expanding budget or audience.
4. Segment Audiences and Compare Performance Across Cohorts
Aggregate campaign metrics hide which audience segments drive profitable conversions. Dashboard must break down performance by:
• Device type: Mobile (80% of Twitter traffic) often has 30–50% lower conversion rates than desktop due to form friction. If mobile CPA is 2x desktop CPA, create mobile-specific landing pages with simplified forms.
• Geographic region: B2B campaigns targeting "United States" may discover 60% of conversions come from 3 metro areas (SF, NYC, Boston). Allocate budget proportionally or create region-specific creative.
• Daypart: Twitter engagement has historically peaked during midday and evening hours ET (verify with your account's own audience activity data). If morning CPA is significantly higher than evening CPA, shift budget to high-performing hours via dayparting rules.
• Audience type: Retargeting audiences (website visitors, CRM uploads) typically convert at 2–3x the rate of prospecting audiences (interest/keyword targeting) at 50–70% lower CPA. Dashboard must separate these cohorts—blending them hides which strategy drives profit.
5. Test Incrementally with Holdout Groups
When optimizing based on dashboard data, isolate variables to confirm causation. Changing creative + targeting + bid strategy simultaneously makes it impossible to identify which lever drove improvement.
A/B testing framework:
• Duplicate existing campaign (Campaign A = control, Campaign B = test)
• Change ONE variable in Campaign B (e.g., new headline, expanded targeting, +20% bid increase)
• Allocate equal budget to both campaigns for 7 days
• Dashboard compares CTR, CPC, CPA, ROAS between A and B after reaching statistical significance (typically 300+ clicks per variant)
• Winner becomes new control; iterate with next variable
Industry experience suggests marketing teams achieve meaningfully higher results with structured approaches. Teams running structured A/B testing programs consistently outperform teams making ad-hoc optimizations that lack control groups.
6. Cross-Reference Twitter Data with Landing Page Analytics
Twitter Ads dashboards show click volume but not post-click behavior. Integrating Google Analytics, heatmaps (Hotjar, Crazy Egg), or session replay tools reveals why clicks don't convert:
• High bounce rate (>70%): Landing page loads too slowly, message mismatch between ad and page, or mobile experience broken.
• Low scroll depth (<50% scroll past fold): Users land on page but don't engage with content; headline doesn't hook attention or value proposition unclear.
• : Users start filling form but drop off. Forms are too long. They ask for unnecessary info. Phone number kills B2B conversions 30–40%. CTA button not visible on mobile. Form abandonment (>60%)
Dashboard should display Twitter Ads clicks alongside landing page metrics in a unified view. When clicks spike but conversions don't increase, the issue is post-click. The problem is not ad performance.
Twitter Ads Reporting Edge Cases: Handling Non-Standard Scenarios
Most Twitter Ads reporting guides assume steady-state campaigns with consistent budgets, but real-world scenarios introduce complications that break standard dashboard logic.
Campaign Budget Changes Mid-Period
Problem: You increase daily budget from $500 to $2,000 on day 15 of a 30-day campaign. Dashboard shows month-to-date CPA of $45, but first 14 days had CPA of $35 and last 16 days had CPA of $60. Blended CPA hides that scaled budget drove worse performance.
Solution: Dashboard must segment metrics by budget period. Create calculated field: "Budget Period 1" (days 1–14, $500/day) vs. "Budget Period 2" (days 15–30, $2,000/day). Compare CPA, CTR, CPM across periods to determine if scaling degraded efficiency. If Period 2 CPA is >50% higher than Period 1, you've exhausted high-intent audience and moved into lower-quality inventory.
Multiple Currency Reporting
Problem: Global campaigns run in USD, EUR, GBP simultaneously. Twitter Ads API returns spend in local currency; dashboard must normalize to single currency for cross-region comparison. Exchange rates fluctuate daily—using static conversion rates introduces 5–10% error over 90-day periods.
Solution: Integrate live exchange rate API (e.g., Open Exchange Rates, CurrencyLayer) into dashboard ETL pipeline. Convert all spend to reporting currency (typically USD) at daily exchange rate, not campaign start rate. Store both original currency and converted currency in data warehouse for audit trail.
Daylight Saving Time Impact on Daily Metrics
Problem: Daylight saving time creates 23-hour and 25-hour "days" twice per year. Dashboard calculates daily spend by summing hourly spend from midnight to midnight—but on DST transition days, this under- or over-counts by one hour. Creates false anomalies in day-over-day comparisons ("Why did spend drop 4% on March 10?").
Solution: Use UTC timestamps for all data storage and calculation. Convert to local timezone only for dashboard display. Flag DST transition dates with tooltip: "DST transition—day contains 23/25 hours, metrics not directly comparable to prior day."
Paused Campaign Data Retention
Problem: You pause underperforming campaigns but want to retain historical data for attribution analysis (e.g., a user clicked a paused campaign 45 days ago, converts today—should that count toward campaign ROI?). Twitter Ads API may limit historical data availability for paused campaigns—verify current limits in the Twitter Ads API documentation.
Solution: Dashboard ETL must snapshot campaign data daily, even for paused campaigns, and store in data warehouse indefinitely. Do not rely on Twitter Ads API as source of truth for historical data—use it only for incremental updates to local data warehouse.
A/B Test Result Dashboarding
Problem: Running 5 simultaneous A/B tests (creative A vs. B, audience X vs. Y, bid strategy 1 vs. 2, etc.). Dashboard shows aggregate campaign performance, but doesn't isolate which test drove improvement. Team debates whether to scale creative B or audience Y—both show higher CTR, but were tested in different campaigns.
Solution: Implement naming convention that encodes test variables in campaign name (e.g., "Q1_LeadGen_Creative-B_Audience-Retarget_Bid-Auto"). Dashboard parses campaign names into structured fields (Test Variable, Variant) and creates comparison tables:
| Test Variable | Variant A | Variant B | Metric | Winner | Confidence |
|---|---|---|---|---|---|
| Creative | Static image | Video (15s) | CTR: 1.8% vs. 3.2% | Video | 98% |
| Audience | Interest targeting | Retargeting | CPA: $65 vs. $42 | Retargeting | 95% |
This isolates causation and prevents false attribution (e.g., crediting creative improvement when audience change actually drove performance gain).
Five Common Twitter Ads Reporting Mistakes and How to Avoid Them
These dashboard design errors recur across teams, leading to misinterpreted data and poor optimization decisions.
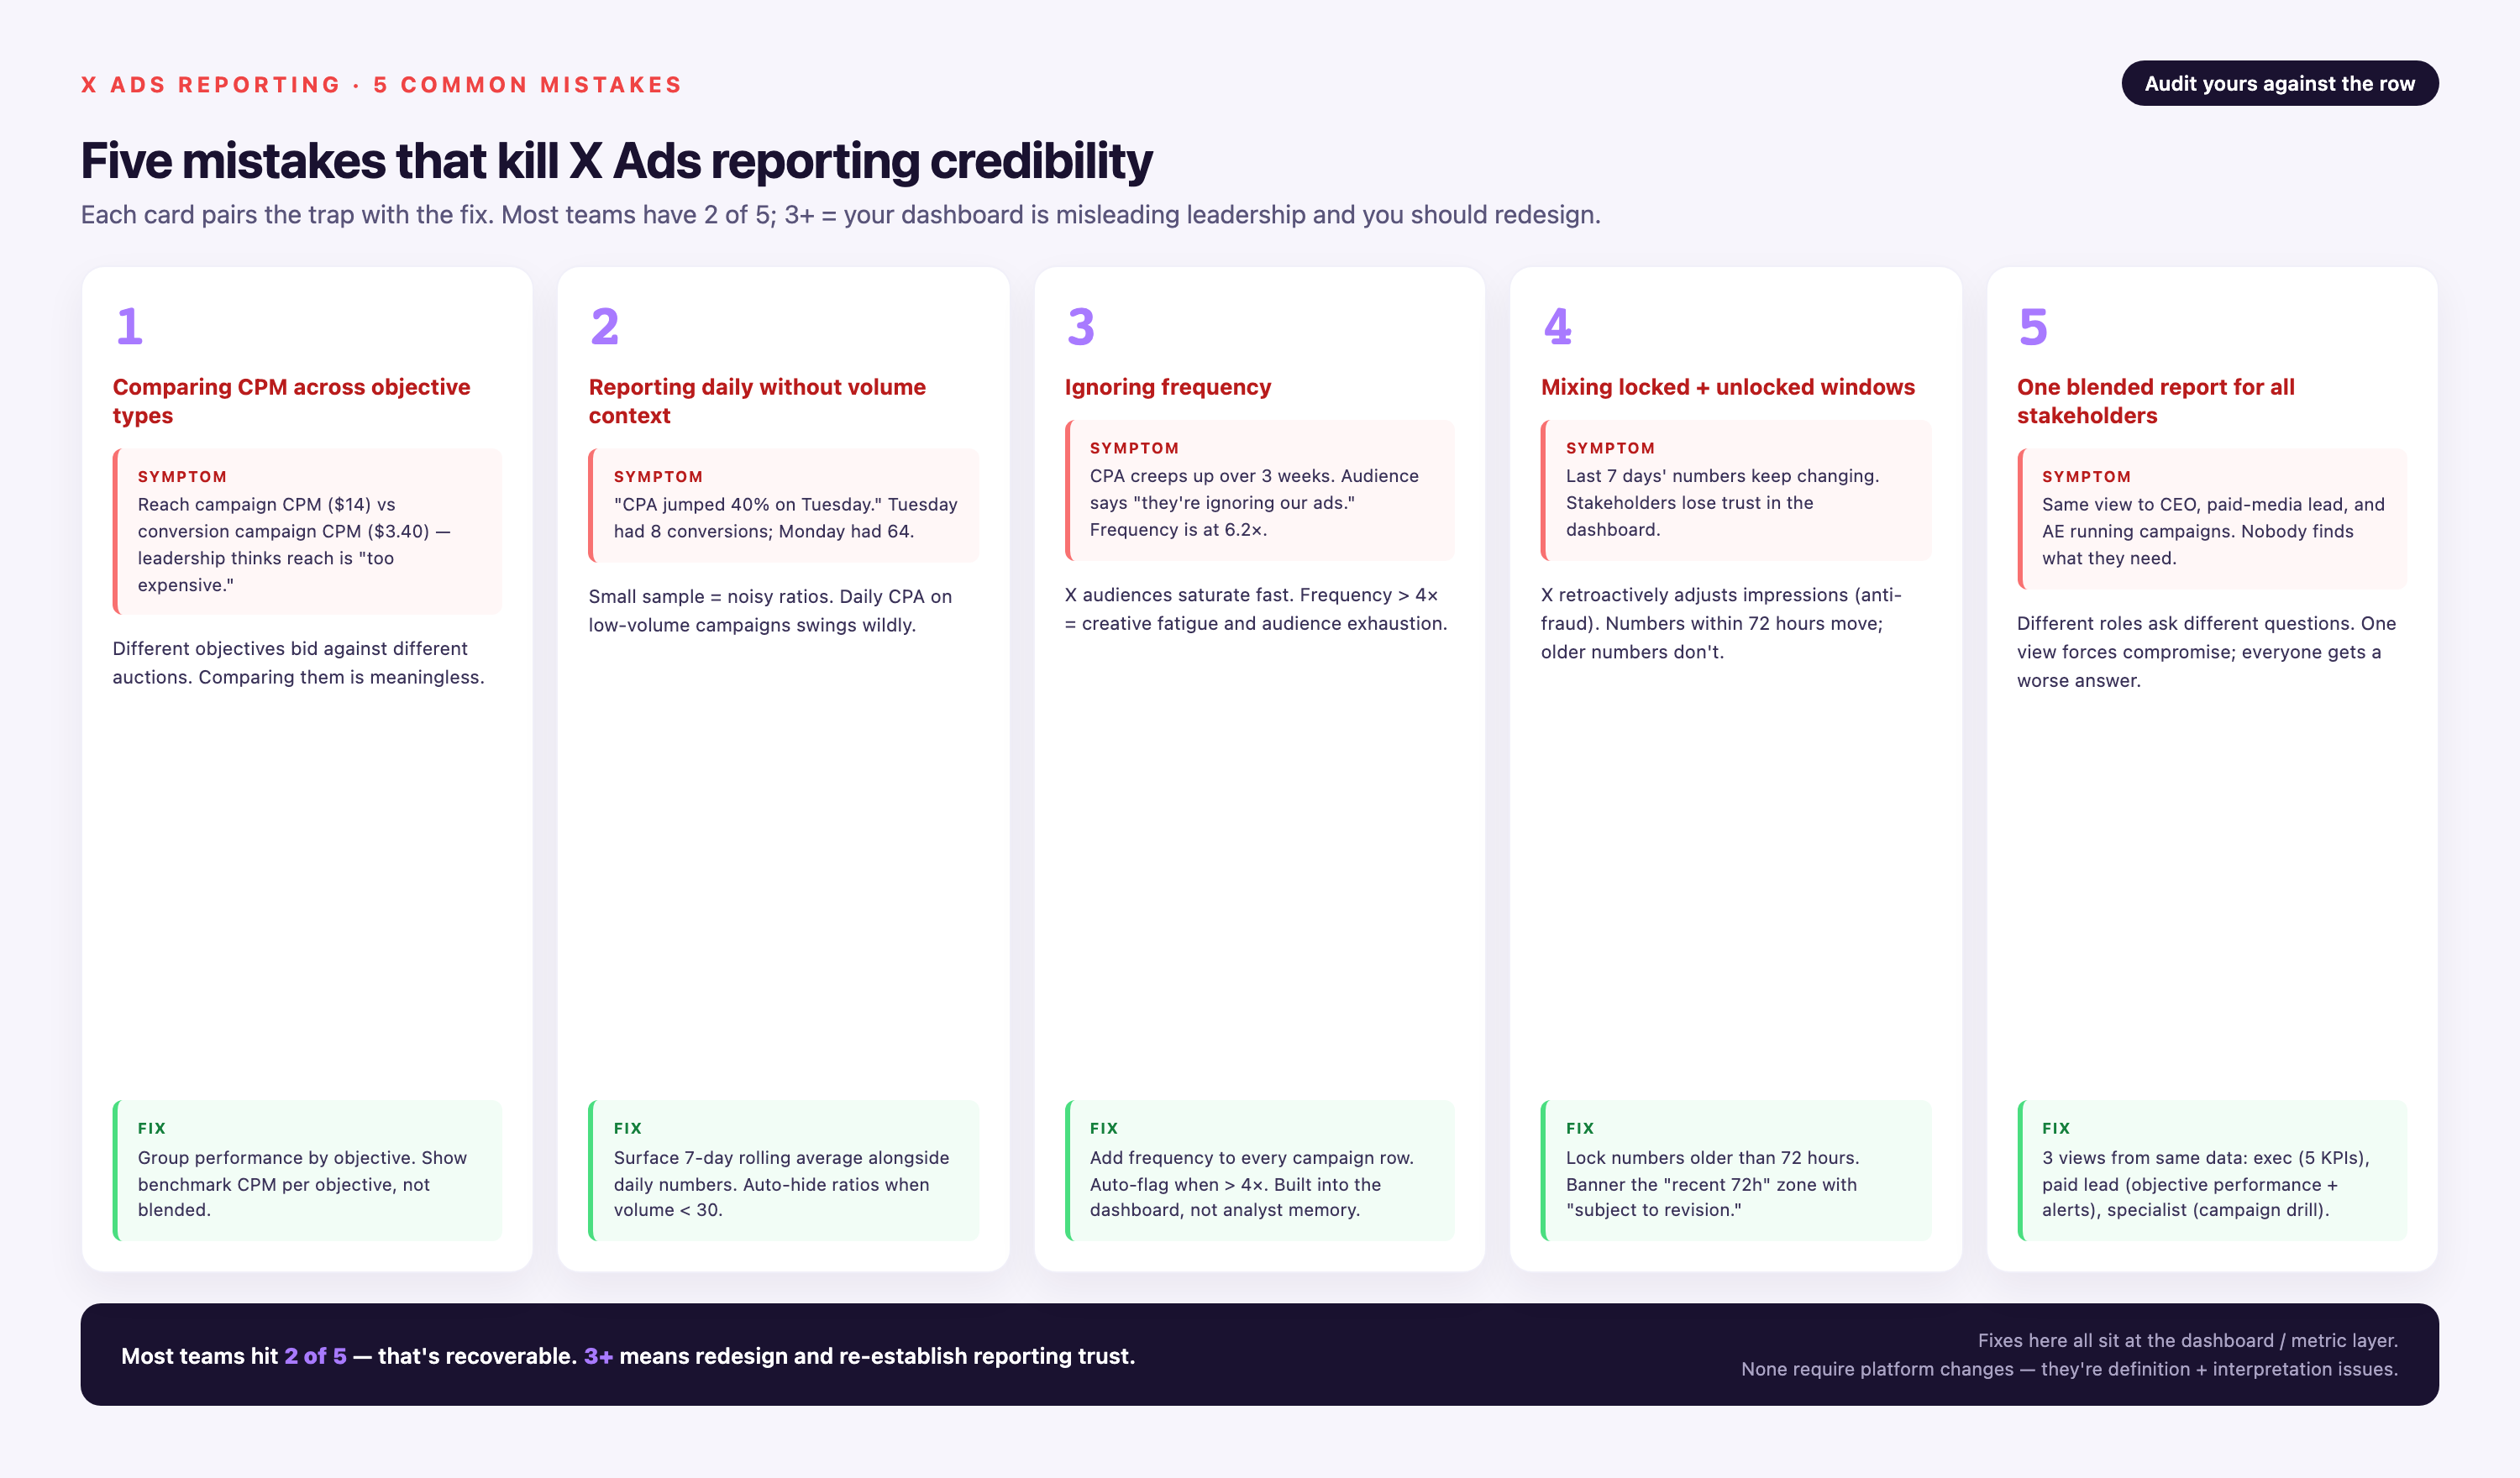
Mistake #1: Vanity Metric Overload
Error: Dashboard displays 25 metrics—impressions, reach, frequency, clicks, CTR, CPC, CPM, engagements, likes, retweets, replies, profile clicks, video views, etc.—without hierarchy. Stakeholders don't know which 3–4 metrics actually matter.
Fix: Implement three-tier metric hierarchy:
• Tier 1 (Hero metrics): 3–4 KPIs that determine campaign success. For lead-gen: CPA, conversion rate, ROAS. Display these in 4x size at dashboard top.
• Tier 2 (Diagnostic metrics): 6–8 supporting metrics that explain Tier 1 changes. For lead-gen: CTR, CPC, landing page bounce rate, form completion rate.
• Tier 3 (Vanity metrics): Hide by default; show in drill-down view only. Likes, profile clicks, and other non-conversion actions belong here.
Mistake #2: Wrong Attribution Window for Business Model
Error: B2B SaaS company with 45-day average sales cycle uses Twitter's default 1-day click attribution window. Dashboard shows low conversion count; team concludes Twitter Ads don't work. Reality: conversions occur 20–40 days post-click, outside attribution window.
Fix: Match attribution window to purchase cycle:
• Ecommerce impulse purchases: 1–7 day click window
• Considered purchases (furniture, electronics): 14–30 day click window
• B2B SaaS: 30–90 day click window
• Enterprise B2B: 90+ day click window + multi-touch attribution (Twitter rarely last click in 6–12 month sales cycles)
Mistake #3: Ignoring Negative Metrics
: Dashboard shows only positive signals—CTR up 15%, conversions up 22%. However, it hides frequency (now 7 views per user). It also hides bounce rate (now 78%). And it hides cost per qualified lead (up 40% because most conversions are tire-kickers, not sales-qualified). Error
Fix: Every dashboard must include "red flag" section with negative indicators:
• Frequency >5 (overexposure)
• Bounce rate >70% (landing page problem)
• Cost per qualified lead vs. cost per raw lead (conversion quality)
• Wasted spend (clicks from bots, geographies outside sales territory, or users who immediately bounced)
Mistake #4: Missing Audience Segment Breakdowns
Error: Dashboard shows blended campaign CPA of $55. Drill-down reveals retargeting audience has $28 CPA (profitable) while prospecting audience has $95 CPA (unprofitable). Blended average hides that 70% of budget goes to unprofitable audience.
Fix: Default dashboard view must segment by audience type (retargeting vs. prospecting), device (mobile vs. desktop), and region. Aggregate "campaign total" view should be secondary, not primary.
Mistake #5: Static Dashboards That Don't Evolve with Campaigns
Error: Dashboard built in Q1 2025 for brand awareness campaigns (optimized for CPM, reach, frequency). Q3 2026, strategy shifts to lead generation (optimize for CPA, conversion rate, ROAS), but dashboard still highlights CPM as hero metric. Team makes decisions based on wrong KPIs.
Fix: Quarterly dashboard audit:
• Review campaign objectives—did they change?
• Confirm hero metrics align with current business goals
• Archive unused metrics; add new metrics for emerging campaign types (e.g., if launching video ads, add video completion rate)
• Update benchmarks from prior quarter's data
Twitter Ads Dashboard Setup Checklist: 15-Step Implementation Guide
This checklist walks through dashboard creation from API access to team training, including technical prerequisites and ongoing maintenance tasks.
| # | Step | Action Items | Owner | Time Estimate |
|---|---|---|---|---|
| 1 | Request Twitter Ads API access | Apply for API credentials via Twitter Developer Portal; approval typically takes 3–5 business days; requires business verification | Marketing Ops | 1 week (inc. approval) |
| 2 | Define campaign objectives and KPIs | Workshop with marketing, sales, finance: confirm primary objective (awareness / leads / sales); select 3–4 hero metrics; document in shared doc | Marketing Lead | 2 hours |
| 3 | Audit historical data requirements | Determine lookback period (90 days minimum for trends, 12 months for seasonality); confirm Twitter API provides required historical depth | Data Analyst | 1 hour |
| 4 | Select dashboard / BI tool | Evaluate Google Data Studio (free), Tableau, Power BI, Looker, or marketing analytics platforms; consider team SQL proficiency and budget; procurement approval if enterprise tool | Data Analyst + IT | 1–2 weeks |
| 5 | Set up data warehouse or storage | Provision BigQuery, Snowflake, Redshift, or Postgres instance; configure IAM permissions; create Twitter Ads schema (campaigns, ad groups, ads, metrics tables) | Data Engineer | 2–3 days |
| 6 | Build ETL pipeline (API → warehouse) | Code data extraction script (Python + Twitter Ads SDK or use Improvado / Fivetran connectors); schedule daily runs; configure error alerts; test with 7 days historical backfill | Data Engineer | 3–5 days |
| 7 | Validate data accuracy | Compare warehouse totals (spend, impressions, clicks, conversions) vs. Twitter Ads Manager for 7-day period; investigate discrepancies >2%; document known attribution differences | Data Analyst | 4 hours |
| 8 | Create calculated metrics | Write SQL / DAX formulas for CTR, CPM, CPC, CPA, ROAS, engagement rate; store as views or calculated fields; document formulas in data dictionary | Data Analyst | 2–3 hours |
| 9 | Design dashboard layout | Sketch 3-tier layout: (Tier 1) Hero KPIs at top in large cards, (Tier 2) Time-series charts and comparison tables in middle, (Tier 3) Drill-down filters at bottom; gather feedback from 2–3 end users | Data Analyst + Designer | 3 hours |
| 10 | Build dashboard views | Connect BI tool to warehouse; create 3 views: (1) Executive summary (5 KPIs), (2) Campaign manager (15+ metrics with filters), (3) Creative performance; apply brand styling | Data Analyst | 2–3 days |
| 11 | Configure automated alerts | Set up Slack / email alerts for: CTR drop >25%, CPA increase >40%, budget pacing >80% by noon, conversion tracking failure (0 conversions for 24h with stable clicks); test alert triggers | Data Engineer | 3 hours |
| 12 | Set up role-based access | Configure dashboard permissions: view-only for executives, edit for analysts, admin for data team; if client-facing, create white-labeled version with filtered data | Data Analyst + IT | 1 hour |
| 13 | Conduct team training | Run 60-min training session: (1) How to interpret each metric, (2) How to use filters, (3) When to investigate anomalies, (4) How to export data; record session; create 2-page quick-reference guide | Data Analyst | 2 hours (prep + delivery) |
| 14 | Schedule recurring maintenance | Calendar monthly checks: (1) API connector health, (2) Data freshness (compare latest timestamp to current time), (3) Metric formula accuracy, (4) Alert threshold relevance; assign owner for each check | Data Analyst | 30 min/month |
| 15 | Document data lineage and definitions | Create data dictionary in Confluence / Notion: list every metric, its source table, calculation formula, business definition, and known limitations; link from dashboard footer | Data Analyst | 2 hours |
Total estimated setup time: 2–3 weeks for teams with existing data infrastructure; 4–6 weeks if building data warehouse from scratch.
Ongoing maintenance time: 2–4 hours per month for dashboard health checks, metric formula updates, and alert threshold adjustments.
How Marketing Analytics Platforms Simplify Twitter Ads Reporting
Building custom dashboards from scratch requires significant data engineering effort. This includes API integration, data warehouse setup, and ETL pipeline maintenance. Metric calculation logic must be implemented carefully. Ongoing schema updates are needed when Twitter changes its API. For teams managing Twitter Ads alongside 5–10 other marketing platforms, complexity multiplies exponentially. These platforms include Google Ads, Meta, LinkedIn, HubSpot, and Salesforce.
Marketing analytics platforms automate the entire reporting infrastructure, reducing setup time from weeks to days and eliminating maintenance overhead. Platforms like Improvado provide:
• Pre-built Twitter Ads connector: No custom API code required. Improvado maintains the connector and adapts to Twitter API changes automatically—when Twitter deprecates a metric or adds new campaign types, the connector updates without requiring your team to touch code.
• 1,000+ data sources—Twitter "engagements" + LinkedIn "interactions" + Facebook "post reactions" all map to a unified "engagement" field. Eliminates spreadsheet reconciliation errors.
• 46,000+ pre-mapped metrics and dimensions: Access Twitter Ads data at granular levels—campaign, ad group, ad creative, keyword, audience segment, device, location—without writing SQL joins. Dimensions are pre-joined and queryable via drag-and-drop or SQL interface.
• Real-time and historical data: Configure refresh intervals from 15-minute real-time updates to daily batch loads. Improvado preserves 2+ years of historical data even when Twitter API limits change—no risk of losing historical campaign performance.
• No-code dashboard templates: Improvado provides pre-built dashboard templates for Looker, Tableau, Power BI, Google Data Studio, and 15+ other BI tools. Templates include Twitter Ads-specific views (campaign performance, creative analysis, audience breakdown) that load automatically once data connection is established.
• Custom metric calculation engine: Define ROAS, cost-per-qualified-lead, customer acquisition cost (CAC), and other business-specific metrics in Improvado's interface. Calculations run on unified cross-channel data, so ROAS includes revenue from Twitter-assisted conversions that occurred days or weeks later via other channels.
• Marketing Data Governance: 250+ pre-built validation rules detect data quality issues (e.g., "Campaign spend >$10K but 0 conversions = likely broken tracking pixel") and alert teams before stakeholders see incorrect dashboards. Pre-launch budget validation prevents campaigns from launching with mismatched spend caps.
• : Non-technical team members can ask natural language questions. For example: "Which Twitter campaigns have CPA <$50 this month?" They receive instant visualizations. No SQL writing or complex dashboard navigation is required. AI Agent for conversational analytics
: Custom pricing structure means smaller teams (<$5K/month ad spend) may find the platform cost-prohibitive. It's expensive relative to DIY dashboard solutions or simpler connectors like Supermetrics. Best suited for mid-market and enterprise teams. These teams manage $20K+/month across multiple channels. Data engineering time savings justify the investment for them. Improvado limitation
For marketing analysts and data teams running Twitter Ads, platforms like Improvado eliminate 80–90% of technical burden. Custom dashboard builds no longer require API maintenance. Schema updates shift from in-house engineering to vendor-managed services. Data quality monitoring becomes vendor-managed. Cross-platform normalization is handled by the platform. This frees analysts from data plumbing tasks. They can focus on optimization and insight generation instead.
Conclusion
Building effective Twitter Ads dashboards in 2026 requires more than connecting the Twitter Ads API to a visualization tool. High-performing dashboards map campaign objectives to metric priorities. They surface diagnostic context including benchmarks, kill thresholds, and red flags. They integrate post-click analytics to reveal why ads succeed or fail. The shift from "what happened?" reporting to "why did it happen and what should we do?" analysis separates dashboards that inform from those that drive action.
For marketing analysts managing multi-channel campaigns, the choice between custom dashboard builds and marketing analytics platforms depends on three factors: (1) team data engineering capacity—can you dedicate 2–4 hours/month to API maintenance and schema updates? (2) cross-channel attribution needs—does Twitter exist in isolation or as part of a 5–10 platform mix? (3) budget—does $500–$2,000/month for automation justify saving 20+ hours of manual work?
Teams running Twitter Ads at <$5K/month with simple last-click attribution can build functional dashboards using Google Sheets + scheduled CSV exports. Teams managing $20K+/month across Twitter, LinkedIn, Google, and Meta benefit from automated platforms that unify data, normalize metrics, and eliminate manual consolidation errors.
Regardless of implementation path, the goal remains consistent: transform fragmented Twitter Ads data into decision-grade intelligence that answers three questions faster than stakeholders can ask them—Are campaigns reaching target audiences at scale? Which campaigns convert impressions to revenue at profitable rates? Where is budget leaking to underperforming placements or saturated audiences?
Dashboards answer these questions within 30 seconds. They include benchmark context, segment breakdowns, and diagnostic flowcharts. This compounds optimization velocity. Teams move from monthly campaign reviews to weekly optimization sprints. They catch performance decay in days instead of weeks. Budget reallocates to high-ROI campaigns before competitors saturate the same audiences.