
LinkedIn Ads generate some of the most precise intent signals in B2B marketing, but extracting meaningful insights from the platform requires more than the native UI can provide. Native LinkedIn reporting does not expose enough granularity or allow reliable cross-campaign comparisons. A dedicated LinkedIn Ads dashboard is the only way to monitor these variables with precision and react quickly to performance shifts.
This article breaks down how to build a dashboard that supports real analysis. You will learn which data points matter for pipeline efficiency, how to structure LinkedIn data for lead-to-revenue tracking, and how to blend paid data with CRM and attribution outputs.
Key Takeaways:
- A LinkedIn Ads dashboard centralizes all your campaign data. It provides a single source of truth for performance analysis.
- Tracking the right KPIs is essential. Go beyond clicks and impressions to focus on conversion rate, CPL, and ROAS.
- Third-party dashboards offer superior customization, integration, and cross-channel reporting compared to the native Campaign Manager.
- Effective data visualization tells a story. Use line charts for trends, bar charts for comparisons, and summary charts for snapshots.
- Automation is key to efficiency. Automate data syncs and reporting to save time and make faster, data-driven decisions.
Quick answer
A LinkedIn Ads dashboard is a centralized interface that displays all key performance metrics from your LinkedIn campaigns in a single, structured environment. It aggregates data across campaigns, audiences, ad formats, and objectives so you can evaluate performance without switching between fragmented LinkedIn UI views. Advanced dashboards can also pull data from other platforms to see LinkedIn's performance alongside Google Ads, Facebook Ads, and CRM data.
What Is a LinkedIn Ads Dashboard and Why It's Non-Negotiable?
A LinkedIn Ads dashboard is a centralized interface that displays all key performance metrics from your LinkedIn campaigns in a single, structured environment. It aggregates data across campaigns, audiences, ad formats, and objectives so you can evaluate performance without switching between fragmented LinkedIn UI views.
More advanced dashboards can also pull data from other platforms. This lets you see LinkedIn's performance alongside Google Ads, Facebook Ads, and even your CRM data.
The Problem with Native LinkedIn Analytics
LinkedIn's own Campaign Manager offers reporting. However, it has significant limitations for serious marketers.
The interface can be clunky. Data is siloed from other marketing channels. You cannot easily see how a LinkedIn click influences a conversion that happens later through a different channel.
This lack of a unified view makes true performance measurement nearly impossible.
The Solution: A Centralized Hub for B2B Insights
A dedicated dashboard solves these problems. It acts as a single source of truth for your paid social efforts. You gain a complete picture of audience engagement, conversions, and return on ad spend. This clarity empowers you to make smarter decisions, optimize campaigns effectively, and justify your budget to stakeholders.
The Core Benefits of a Unified LinkedIn Ads Dashboard
Building a unified dashboard is a game-changer for any B2B marketing team. The benefits go far beyond just looking at pretty charts. They fundamentally change how you approach campaign management and strategy.
1. A Single Source of Reference
Stop the data scavenger hunt. A dashboard consolidates all your critical information in one place. You no longer need to jump between different platforms or spreadsheets. You can analyze the fine details of one campaign and then zoom out to see its impact on the bigger picture. This streamlined access allows for quick, data-backed decisions.
2. Complete Data Transparency
A dashboard brings clarity on two fronts: data and team communication. First, you get a transparent view of ad performance. There are no hidden metrics or confusing reports.
Second, it improves collaboration. By giving your team access to the dashboard, everyone stays aligned on goals and progress. This shared understanding breaks down silos between marketing, sales, and leadership.
3. Powerful Data Integration
Your LinkedIn campaigns do not exist in a vacuum. A powerful dashboard allows you to integrate data from other sources. Connect your Google Analytics, CRM, and other ad platforms.
This provides a holistic view of your customer journey. You can see how LinkedIn ads contribute to leads that are later nurtured by email and closed by sales. Such integrations are made possible by robust data integration tools that form the backbone of a modern analytics stack.
4. Full Customization and Control
Every business has unique goals and KPIs. A key benefit of a third-party dashboard is complete customization. You choose which metrics to track and how to visualize them. You can build reports tailored to different audiences.
For example, a high-level ROAS dashboard for your CMO and a granular campaign performance report for your ad specialist. This flexibility ensures the data is always relevant to the task at hand.
LinkedIn Campaign Manager vs. Third-Party Dashboards: A Comparison
Marketers often start with the native tools available. LinkedIn Campaign Manager provides a free, built-in way to see performance. However, as your ad spend and complexity grow, its limitations become clear. A third-party dashboard offers a significant upgrade in power and flexibility.
Understanding these differences is key to choosing the right solution.
| Feature | LinkedIn Campaign Manager | Third-Party Dashboard (like Improvado) |
|---|---|---|
| Data Sources | LinkedIn Ads data only | LinkedIn Ads + hundreds of other marketing, sales, and finance platforms |
| Cross-Channel Reporting | Not available | Core feature; view LinkedIn alongside Google Ads, CRM, etc. |
| Customization | Limited to pre-set columns and basic filters | Fully customizable widgets, metrics, and visualizations |
| Data Granularity | Standard level (campaign, ad group, ad) | Deeper granularity, including creative-level and demographic breakdowns |
| Automation | Manual report downloads | Automated data collection, updates, and report scheduling |
| Historical Data | Limited lookback window | Unlimited storage of historical data for long-term trend analysis |
| Speed to Insight | Slow; requires manual data pulling and analysis | Fast; real-time data and pre-built templates provide instant insights |
| Scalability | Becomes cumbersome with many campaigns or accounts | Designed to scale across multiple brands, regions, and channels |
Essential KPIs & Metrics for Your LinkedIn Ads Performance Dashboard
A dashboard is only as useful as the data it contains. It is easy to get lost in a sea of vanity metrics. To build an effective dashboard, you must focus on the key performance indicators (KPIs) that directly reflect your business objectives. Here are the essential metrics to include.
Top-of-Funnel Metrics (Awareness & Engagement)
- Impressions: The total number of times your ad was shown. This is a basic measure of reach.
- Ad Clicks: The total number of clicks on your ad content. This includes clicks to your website and clicks on your company profile.
- Click-Through Rate (CTR): The percentage of impressions that resulted in a click (Clicks ÷ Impressions). A high CTR indicates your ad creative and targeting are compelling.
- Engagement Rate: The percentage of people who engaged with your ad (likes, comments, shares) out of those who saw it. This shows how well your content resonates.
- Cost Per Mille (CPM): The cost you pay for 1,000 impressions. This is a key metric for understanding the cost of reaching your audience.
Mid-Funnel Metrics (Consideration & Lead Generation)
- Cost Per Click (CPC): The average amount you pay for each click on your ad. Monitor this to ensure you are acquiring traffic efficiently.
- Total Conversions: The number of desired actions taken by users after clicking your ad. This could be a form fill, a content download, or a demo request.
- Conversion Rate: The percentage of clicks that resulted in a conversion (Conversions ÷ Clicks). This is one of the most important metrics for measuring ad effectiveness.
- Cost Per Lead (CPL) / Cost Per Conversion: The average cost to acquire one conversion (Total Spend ÷ Total Conversions). This directly measures the ROI of your lead generation efforts.
Bottom-of-Funnel Metrics (Business Impact & ROI)
- Return on Ad Spend (ROAS): The total revenue generated for every dollar spent on advertising (Revenue ÷ Ad Spend). This is the ultimate measure of profitability.
- Customer Acquisition Cost (CAC): The total cost to acquire a new customer. This often involves blending ad spend with other sales and marketing costs.
- Lead-to-Customer Rate: The percentage of leads generated from LinkedIn that eventually become paying customers. This metric connects marketing efforts to sales outcomes.
By organizing your dashboard around these funnel stages, you can easily diagnose performance issues.
For example, a high CTR but a low conversion rate suggests a problem with your landing page, not your ad creative. This level of insight is what makes powerful KPI dashboards so valuable for optimization.
Setting Up Your LinkedIn Ads Dashboard: A Step-by-Step Guide
Creating a powerful dashboard may seem daunting, but it can be broken down into a clear process. Whether you are using a tool like Improvado or another BI platform, these fundamental steps will guide you.
Step 1: Define Your Objectives
Before you connect any data, ask yourself: What do I want to achieve with this dashboard?
Are you focused on lead generation, brand awareness, or driving sales? Your objectives will determine which metrics are most important.
For example, a brand awareness campaign will prioritize Impressions and Engagement Rate, while a lead gen campaign will focus on CPL and Conversion Rate.
Step 2: Choose Your Dashboarding Tool
Select a tool that fits your needs. As discussed, the native Campaign Manager is limited. For serious analysis, you will need a third-party solution.
Look for a platform with the ability to connect a variety of data sources and flexible customization options. Platforms that specialize in marketing data aggregation are often the best choice.
Step 3: Connect Your Data Sources
This is the point where your dashboard becomes actionable. Start by authorizing your BI or visualization tool to access your LinkedIn Ads account. This allows the dashboard to pull campaign, audience, and creative-level performance directly from LinkedIn’s API on a recurring schedule.
If you are using a platform like Improvado, this step expands far beyond a single connector. Improvado centralizes all marketing and revenue data by integrating and harmonizing LinkedIn Ads with the rest of your stack, including:
- Web analytics tools such as Google Analytics or Adobe Analytics
- CRMs like Salesforce, HubSpot, or Microsoft Dynamics
- Other paid media platforms such as Google Ads, Meta Ads, or programmatic DSPs
- Attribution, revenue, and lifecycle tools that measure downstream impact
This unified pipeline ensures every dataset is pulled consistently, refreshed automatically, and normalized before it ever reaches your dashboard. Improvado handles API limitations, schema differences, and data formatting issues – problems that typically cause dashboard inaccuracies or gaps.

Step 4: Select and Organize Your Metrics
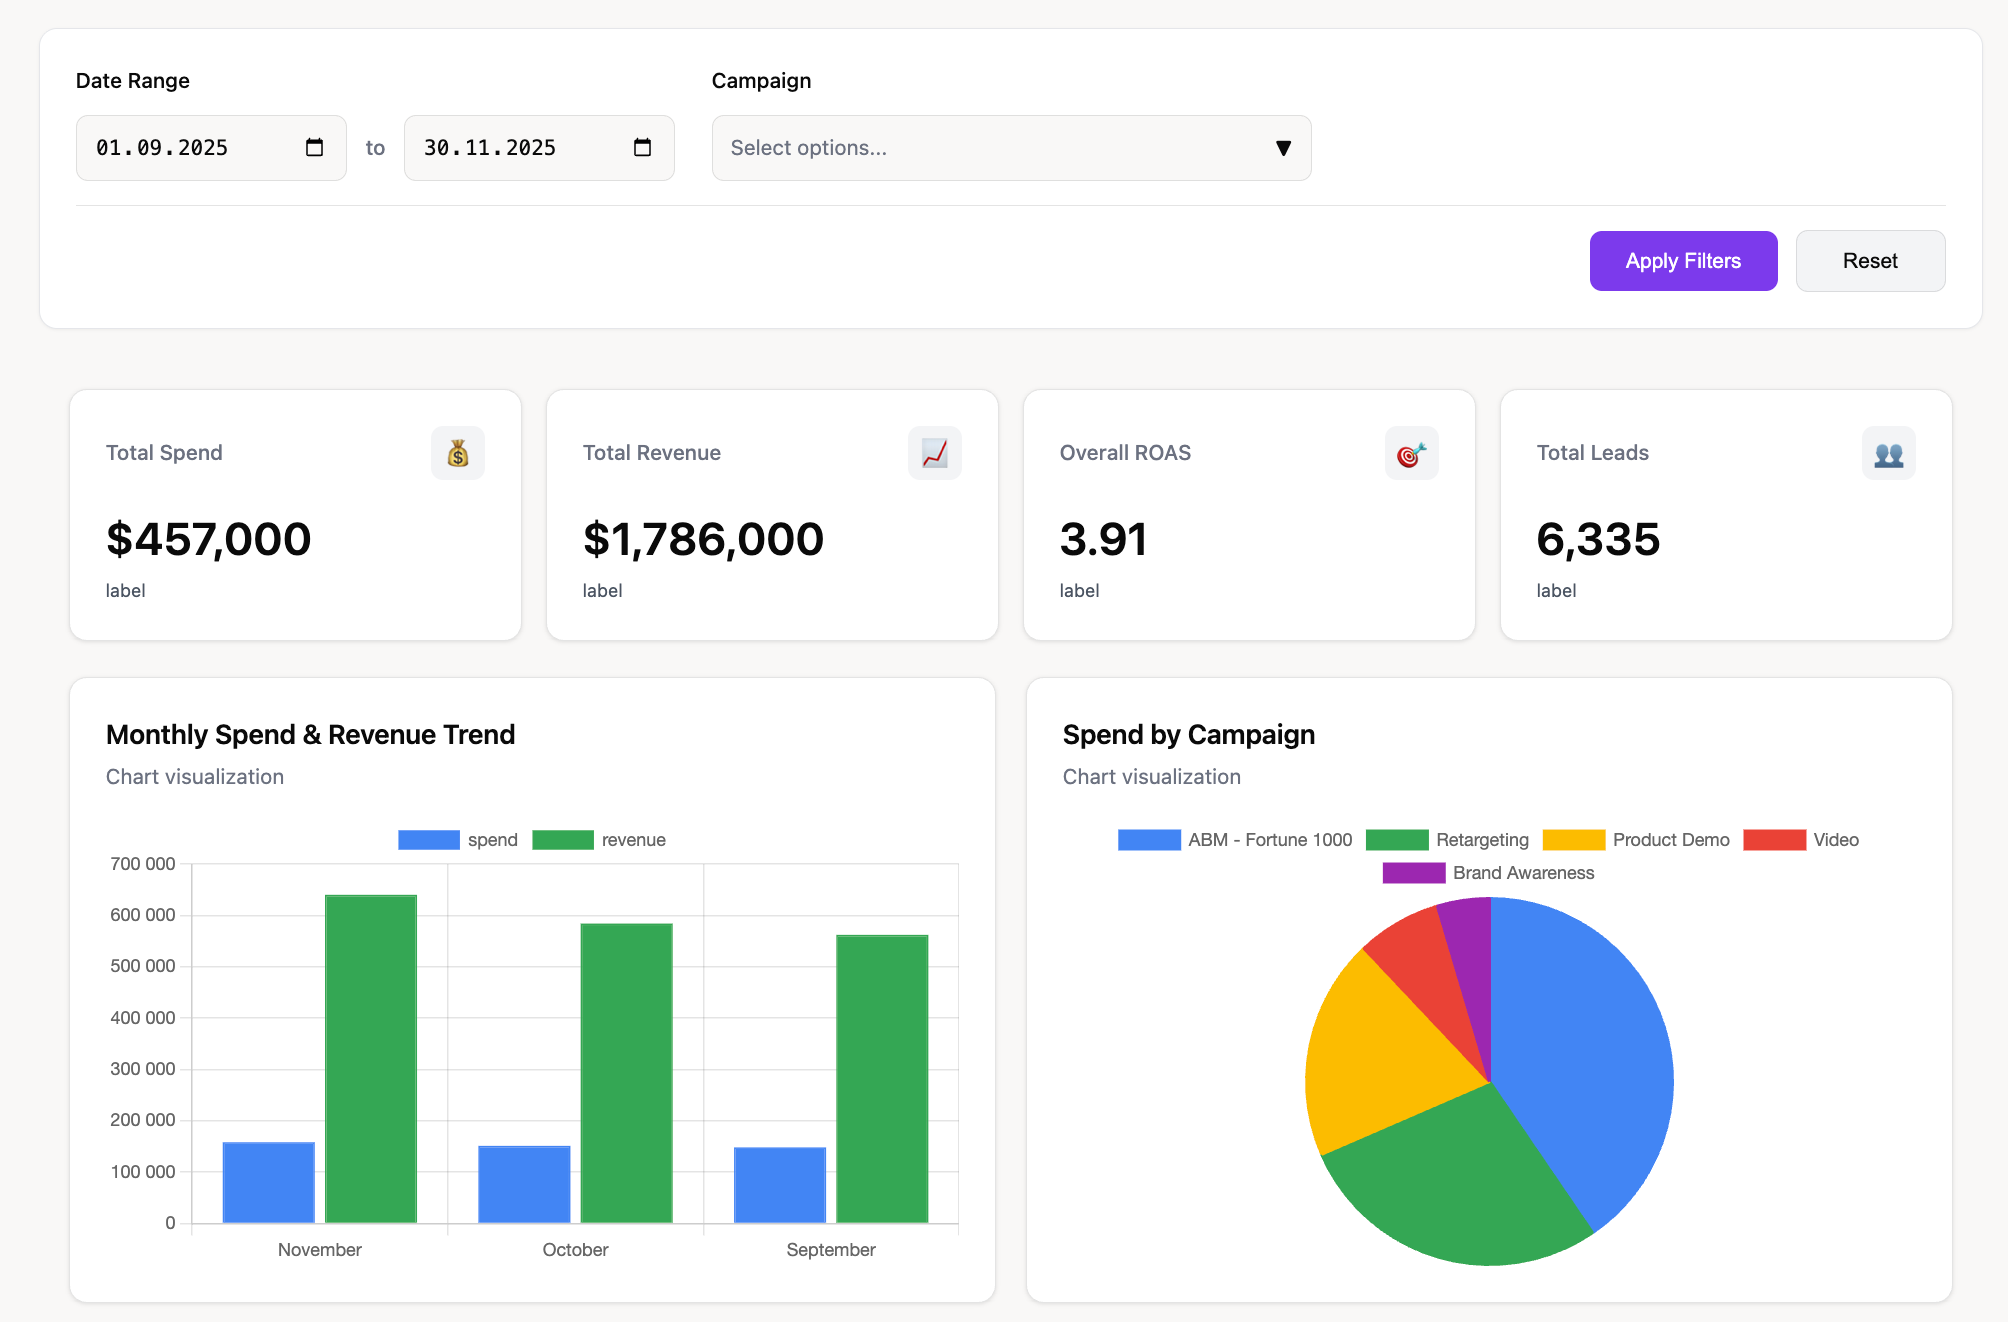
Start with the essential KPIs outlined in the previous section. Drag and drop these metrics into your dashboard canvas. Organize them logically. A common approach is to have a high-level overview page with key metrics like Spend, ROAS, and Total Leads. Then, create separate, more detailed pages for campaign-level analysis, creative performance, and audience insights.
Step 5: Build Your Visualizations
Choose the right chart for each metric. A line chart is perfect for tracking Spend or CPL over time. A bar chart is great for comparing the performance of different campaigns. A pie chart can show the distribution of leads by campaign type. We will cover this in more detail in the next section.
Step 6: Automate and Share
The final step is to put your dashboard to work. Set up automated data refreshes so your data is always up-to-date. Schedule regular email reports to be sent to key stakeholders. Share a live link to the dashboard with your team to foster a culture of data-driven decision-making. Embracing reporting automation frees up your time from manual tasks to focus on strategy.
Advanced Visualization Techniques for Actionable Insights
Data visualization is more than making your dashboard look good. It is about telling a story with your data. The right visualization can reveal trends and insights that are hidden in raw numbers. Here are some of the most effective visualization types and how to use them for your LinkedIn Ads dashboard.
Choosing the Right Chart for Your LinkedIn Data
| Visualization Type | Best For Tracking | Why It Works | Example Use Case |
|---|---|---|---|
| Line Charts | Metrics over time | Clearly shows trends, seasonality, and the impact of changes. | Tracking daily ad spend vs. daily conversions over a month. |
| Bar Charts | Comparing categories | Makes it easy to see which campaigns, ad groups, or creatives perform best. | Comparing the CPL of five different active campaigns side-by-side. |
| Summary Charts (Scorecards) | Single, key KPIs | Provides a quick, at-a-glance snapshot of your most important numbers. | Displaying total ROAS for the current quarter at the top of your dashboard. |
| Pie / Donut Charts | Composition of a whole | Shows how different segments contribute to a total. Use with few categories. | Visualizing the percentage of budget allocated to different ad formats. |
| Geo Maps | Geographic performance | Instantly reveals which countries, states, or cities are driving the most engagement. | Showing a map of the United States colored by conversion volume. |
| Tables | Granular, detailed data | Allows for precise comparison and deep-dives when you need to see all the details. | A detailed table listing every ad with its impressions, clicks, CTR, and conversions. |
Combining Visualizations for Deeper Analysis
The real power comes from combining these elements.
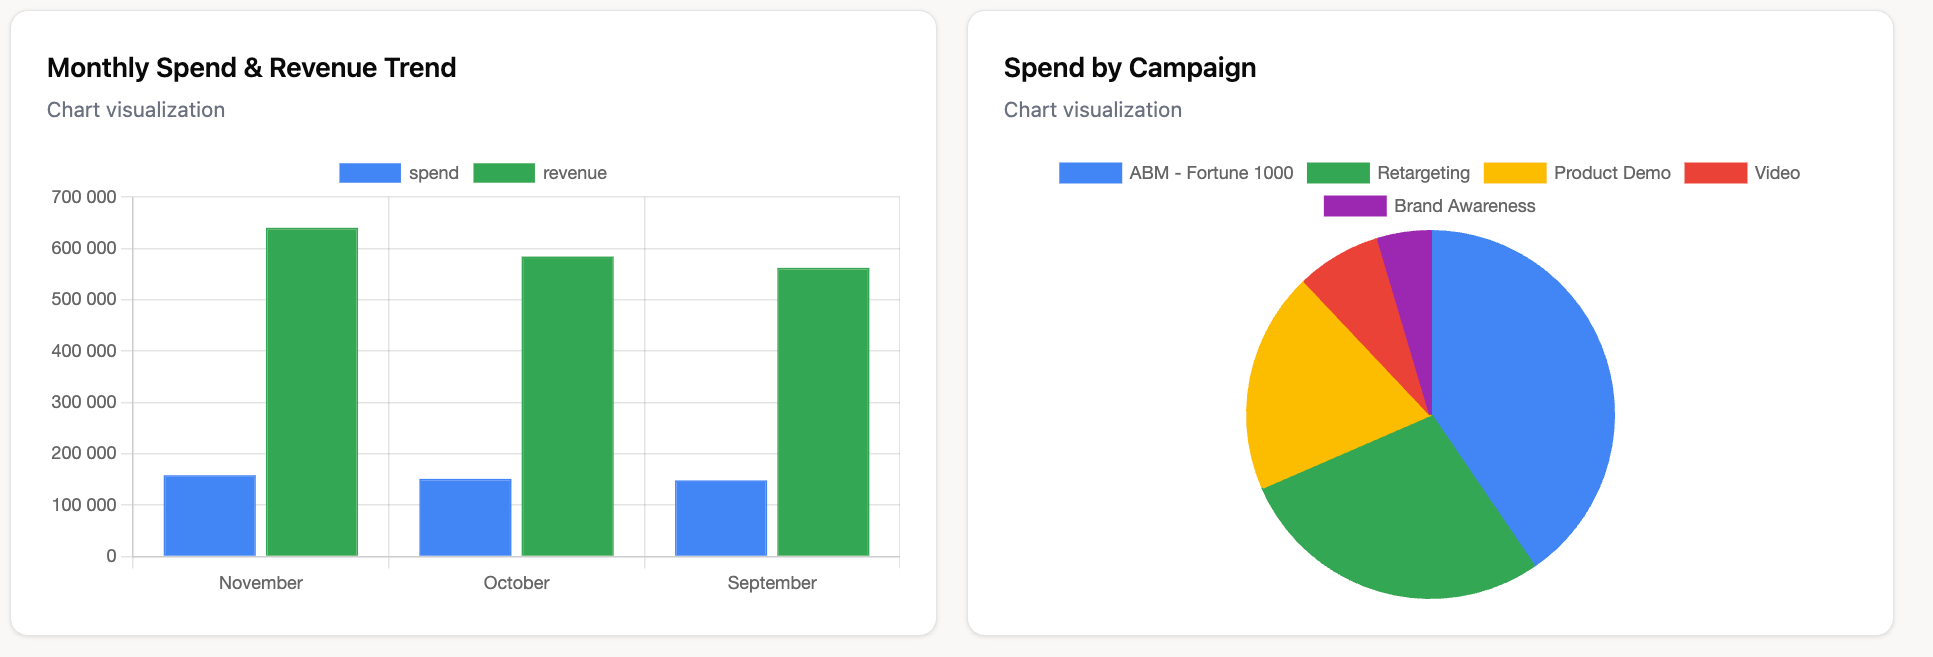
Use a line or bar chart to understand how performance changes over time. Then use a pie chart to see how the budget is distributed across initiatives. To evaluate quality, add a funnel visualization to understand how each campaign converts leads into opportunities.
Good dashboard design guides the user from a high-level overview to granular details seamlessly.
Best Practices for LinkedIn Ads Dashboard Management and Reporting
Once your dashboard is built, you need a process for using it effectively. A dashboard should be a living tool that informs your daily work, not a static report you check once a month.
1. Pick the Right Metrics for Your Goals
We have listed many metrics, but you should not give them all equal weight. Prioritize the KPIs that align with your primary campaign objective.
If your goal is lead volume, CPL is your north star metric. If it is sales, ROAS is what matters most. Keep your primary KPIs front and center on your dashboard.
2. Automate Your Data Syncs
Manual data updates are a recipe for outdated information and wasted time. Ensure your dashboard is set to refresh data automatically at least once a day. Real-time data allows you to spot problems and opportunities as they happen, not a week later when it is too late.
3. Use Data to Make Decisions
This is the most critical practice. Regularly review your dashboard with a specific question in mind.
For example: "Which ad creative is performing the worst, and why?" Use the data to form a hypothesis (e.g., "The image is not relevant to the audience"). Then, launch a test to prove or disprove it. This disciplined approach turns data into action.
4. Link Results to Ad Spend and Revenue
Always connect performance metrics back to financial data. A campaign might have a great CTR, but if it is not driving conversions at a profitable CPL, it is not successful. The most advanced dashboards integrate with financial data to provide a clear view of true marketing attribution and ROI.
Integrating LinkedIn Ads Data with Your Broader Marketing Ecosystem
The true power of a LinkedIn Ads dashboard is realized when it becomes part of your overall marketing analytics ecosystem. By combining LinkedIn data with information from other channels, you can answer complex questions about your business.
Connecting LinkedIn to Your CRM
Integrating LinkedIn Ads data with your CRM (like Salesforce or HubSpot) is a must for B2B marketers. This allows you to track the full lead lifecycle.
You can see which campaigns generate leads that turn into qualified opportunities and eventually closed-won deals. This is how you calculate an accurate ROAS and prove marketing's contribution to revenue.
Combining Paid Social with Web Analytics
Pulling in data from Google Analytics gives you context on what happens after the click. You can see how long users from LinkedIn stay on your site, which pages they visit, and if they convert on other goals.
This helps you understand the quality of the traffic your ads are driving.
Creating a Multi-Touch Attribution Model
Customers rarely interact with just one marketing touchpoint. They might see a LinkedIn ad, then click a Google search ad a week later, and finally convert from an email. By integrating all these data sources, you can build a multi-touch attribution model.
This helps you understand the role each channel plays in the conversion path, allowing you to allocate your budget more effectively.
Conclusion
Stop navigating blindly through siloed reports in Campaign Manager. A centralized LinkedIn Ads dashboard brings structure to complex performance data and makes it easier to understand what is driving results. With all key metrics in one place, teams can move faster, identify issues earlier, and optimize campaigns with confidence.
Improvado supports this by providing the data foundation behind reliable LinkedIn Ads reporting. It aggregates LinkedIn Ads data with CRM, web analytics, and revenue sources, then standardizes and governs it before it reaches your dashboards. This ensures every metric is consistent, up to date, and ready for analysis across teams and tools.
If you want a LinkedIn Ads dashboard built on accurate, unified data, request a demo of Improvado.