%2520(1)%2520(1).png)
Understanding the nuances of report types can significantly impact the way information is consumed, interpreted, and acted upon. At the heart of this discourse lies the comparison between static and dynamic reports. Each type brings its distinct advantages and potential limitations, shaping the way organizations perceive and use their data.
This article dives deep into these two categories, shedding light on their characteristics, applications, and the scenarios where one might be favored over the other.
Key Takeaways:
- Static Reports are fixed, point-in-time snapshots of data. They are ideal for formal presentations, archival, and compliance. Common formats include PDF and Excel.
- Dynamic Reports are interactive and update in real-time. They allow users to filter, drill down, and explore data. They are perfect for operational monitoring and agile decision-making.
- The Core Difference lies in interactivity and data freshness. Static is for "what happened," while dynamic is for "what is happening now and why."
- Choosing the Right Report depends on your audience, purpose, and data frequency. There is no single best option; the context determines the ideal choice.
The Foundation: What is a Static Report?
A static report is a document that captures data from a specific moment in time. Think of it as a photograph of your data. Once the report is generated, the information within it does not change. To see new data, you must create an entirely new report.
This unchanging nature is its defining feature.
These reports provide a stable and consistent view of information. Every person who views the report sees the exact same numbers and visuals. This consistency is crucial for formal communication and historical record-keeping.
Core Characteristics of Static Reports
Understanding the key traits of static reports helps clarify their role.
- Fixed data: The data is frozen at the time of creation. It does not connect to a live data source.
- Point-in-time snapshot: It represents a specific period, such as a month, quarter, or year.
- Non-interactive: Users cannot click, filter, or manipulate the data within the report. They can only view it.
- Consistent view: Ensures that all stakeholders are looking at the same version of the truth for a given period.
Common Formats and Delivery Methods
Static reports are typically delivered in widely accessible formats. This makes them easy to share and store.
- PDF (Portable Document Format): The most common format. It preserves formatting across all devices and is ideal for emailing or printing.
- Microsoft Excel or Google Sheets: Often used for tabular data. While the sheet itself can be edited, the data represents a static export.
- Printed documents: For board meetings or official records, a physical copy is often required.
- PowerPoint or Google Slides: Used to present key findings from a static dataset in a presentation format.
The Primary Purpose
The main goal of a static report is to create a permanent record. It serves as a historical document for performance analysis, benchmarking, and audits. Its consistency makes it the standard for formal reporting to executives, board members, and external stakeholders. It provides a clear, unchangeable summary of past events.
The Evolution: What is a Dynamic Report?
A dynamic report is a living, breathing view of your data. It is connected to a live data source and updates automatically as new information becomes available. Unlike a static report, it is designed for interaction. Users can explore the data, ask questions, and uncover insights on their own.
These reports are often presented as dashboards. They allow for a much deeper level of analysis. Users can change parameters, apply filters, and drill down into specific details without needing to request a new report.
Core Characteristics of Dynamic Reports
Dynamic reports are defined by their flexibility and real-time nature.
- Live data connection: The report is linked directly to one or more data sources, providing up-to-the-minute information.
- Interactive elements: Users can filter by date, region, or any other variable. They can also drill down from a high-level summary to granular details.
- Customizable views: Users can often change chart types, add or remove metrics, and save their own personalized views of the data.
- Real-time updates: Data can be refreshed automatically, from every few seconds to every few hours.
The Technology Behind Dynamic Reporting
Creating dynamic reports requires specialized software. These tools handle data connection, processing, and visualization.
- Business Intelligence (BI) Tools: Platforms like Tableau, Microsoft Power BI, and Google Data Studio are leaders in this space.
- Data warehouses: A central repository like BigQuery or Snowflake is often needed to store and organize the data.
- Data connectors: APIs and other connectors are used to pull data from various sources (e.g., Google Analytics, Salesforce, Facebook Ads).
The Primary Purpose: Exploration and Real-Time Monitoring
The goal of a dynamic report is to empower users with self-service analytics. It enables them to monitor key performance indicators (KPIs) in real time. This facilitates quick, data-informed decisions. Teams can spot trends, identify anomalies, and react to changes as they happen, rather than waiting for a month-end report.
Head-to-Head: Core Differences Between Static and Dynamic Reports
The choice between static and dynamic reporting comes down to fundamental differences in their nature and function. Understanding these distinctions is key to selecting the right approach for your needs.
Data Timeliness: Historical Snapshot vs. Live Data Stream
This is the most significant difference. A static report shows historical data. It answers the question, "What was our performance last quarter?"
A dynamic report shows live or near-live data. It answers, "What is our performance right now?" This timeliness dictates the kind of decisions each report can support.
User Interactivity: View-Only vs. Drill-Down & Filter
Static reports are passive. The user is a consumer of pre-packaged information. Dynamic reports are active. The user is an explorer who can manipulate the data to find their own answers.
This interactivity promotes a culture of data curiosity and deeper understanding. It allows users to move beyond "what" to "why."
Flexibility and Customization: Rigid vs. Adaptable
To change a static report, you must go back to the source, modify the query, and regenerate the file. It's a rigid process.
Dynamic reports are highly adaptable. Users can change visualizations, add new metrics, or create new views on the fly, tailoring the report to their specific questions without technical assistance.
Technical Requirements: Simple vs. Complex Infrastructure
Creating a basic static report can be as simple as exporting a spreadsheet.
Dynamic reporting, however, requires a more sophisticated infrastructure. It involves setting up data connectors, a data warehouse, and a BI tool.
This requires more initial investment and technical expertise but delivers far greater analytical power. Many businesses struggle with data integration challenges when building this infrastructure.
Static vs. Dynamic Reporting at a Glance
For a clear overview, this table summarizes the key attributes of each report type. Use it as a quick reference guide to inform your reporting strategy.
| Aspect | Static Report | Dynamic Report |
|---|---|---|
| Data Freshness | Point-in-time snapshot (historical) | Real-time or near real-time (live) |
| Interactivity | None; view-only | High; allows filtering, sorting, and drill-downs |
| Primary Use Case | Formal reporting, archival, compliance, periodic reviews | Operational monitoring, performance tracking, data exploration |
| Common Format | PDF, Excel, PowerPoint, Printed | Web-based BI dashboards, interactive web pages |
| User Skill Level | Low; ability to read and interpret | Moderate; requires some analytical skill to explore data |
| Infrastructure Cost | Low initial cost | Higher initial setup and ongoing maintenance cost |
| Decision-Making Speed | Supports long-term, strategic decisions | Supports immediate, tactical decisions |
| Data Governance | Easier to control; fixed and versioned | More complex; requires rules to ensure data consistency |
When to Use Static Reports: Key Business Scenarios
Despite the rise of dynamic dashboards, static reports remain essential for many critical business functions. Their strength lies in their formality and finality.
Formal Board and Shareholder Meetings
When presenting to the board or shareholders, you need a finalized, authoritative document. A static report ensures everyone is discussing the same numbers. It provides a clear, concise summary of performance for a defined period, preventing confusion from live, fluctuating data.
Regulatory Compliance and Audits
For financial audits, legal requirements, or regulatory submissions, static reports are non-negotiable. They serve as an official, unalterable record. An auditor needs to see the exact financial state on a specific date, not a dashboard that changes.
End-of-Period Performance Reviews
Static reports are perfect for quarterly business reviews (QBRs) and annual performance summaries. They provide a concrete baseline for discussing what was achieved against goals. They are used to analyze campaign ROI, sales performance, and departmental budgets over a finished period.
Archiving Historical Data for Benchmarking
Creating a consistent archive of monthly or quarterly reports is vital for long-term trend analysis. These static documents allow you to look back and compare performance year-over-year without fear of data being changed. They form the foundation of historical benchmarking.
When to Use Dynamic Reports: Driving Agile Decision-Making
Dynamic reports excel in fast-paced environments where immediate action is required. They empower teams to be proactive rather than reactive.
Daily Operations Monitoring
Operations teams rely on dynamic dashboards to monitor key metrics in real time. A logistics manager can track shipments. A factory manager can monitor production output. A support manager can view ticket volumes. This allows for instant identification and resolution of issues.
Live Marketing Campaign Optimization
Digital marketers use dynamic reports to track ad spend, click-through rates, and conversions as they happen. If an ad campaign is underperforming, they can pause it immediately. If a certain creative is driving high engagement, they can allocate more budget to it in real time.
Customer Service Ticket Analysis
A customer service team can use a dynamic dashboard to see incoming ticket trends. They can filter by product, issue type, or priority. This helps them allocate resources effectively and spot widespread product issues before they escalate.
Financial Forecasting and Real-Time P&L Tracking
Finance teams can use dynamic reports to monitor cash flow, revenue, and expenses throughout the month. This enables more accurate forecasting and helps leaders make timely adjustments to spending. It moves financial analysis from a retrospective exercise to a proactive one.
The Pros and Cons: A Balanced View
No reporting method is perfect for every situation. It is important to weigh the advantages and disadvantages of each to make an informed choice.
Advantages and Disadvantages of Static Reports
Advantages:
- Simplicity: Easy to create, share, and understand. No special software is needed to view them.
- Control: Provides a single, controlled version of the truth. Reduces the risk of misinterpretation.
- Low cost: Generally cheaper to produce and distribute. Does not require expensive BI software licenses.
- Archivable: Perfect for creating a permanent, unchangeable historical record.
Disadvantages:
- Outdated quickly: The data is old the moment the report is created.
- Lack of depth: Users cannot dig deeper to understand the "why" behind the numbers.
- Inefficient: Answering follow-up questions often requires creating a new report, causing delays.
- Manual effort: Often requires significant manual effort to compile and format each period.
Advantages and Disadvantages of Dynamic Reports
Advantages:
- Timeliness: Provides access to the most current data available.
- Interactivity: Empowers users to explore data and find their own insights.
- Efficiency: Reduces the need for ad-hoc report requests, freeing up analysts' time.
- Deeper insights: The ability to drill down and segment data leads to a richer understanding.
Disadvantages:
- Complexity: Requires a significant technical setup and ongoing maintenance.
- Higher cost: Involves investment in software, infrastructure, and skilled personnel.
- Risk of misinterpretation: Without proper training, users might draw incorrect conclusions from the data.
- Data governance challenges: Ensuring data quality and consistency across a live system can be difficult.
Technology for Static and Dynamic Reporting
The right tool depends entirely on the type of report you want to create. The technology stack for each is quite different.
Tools for Generating Static Reports
These tools are widely available and focus on document creation and data presentation.
- Spreadsheet software: Microsoft Excel and Google Sheets are the workhorses of static reporting. They are used for data manipulation, charting, and creating tables.
- Presentation software: Microsoft PowerPoint and Google Slides are used to present summaries and key findings from static data.
- Document editors: Microsoft Word and Google Docs are used to create formal, text-heavy reports with embedded charts and tables.
- Automated reporting tools: Some platforms can automatically generate and email static PDF reports on a schedule.
Tools for Powering Dynamic Reports
This category includes sophisticated business intelligence and data visualization platforms.
- Business intelligence platforms: Tableau, Power BI, Looker, and Google Data Studio are the market leaders. They provide powerful visualization capabilities and interactive dashboards.
- Data warehouses: A central data repository is crucial. Leading data warehouse solutions include Google BigQuery, Amazon Redshift, and Snowflake.
- Data integration platforms: Tools like Improvado are essential for pulling data from hundreds of sources and preparing it for analysis in BI tools. These are core to the best marketing analytics platforms.
The Future of Reporting: AI and Automation
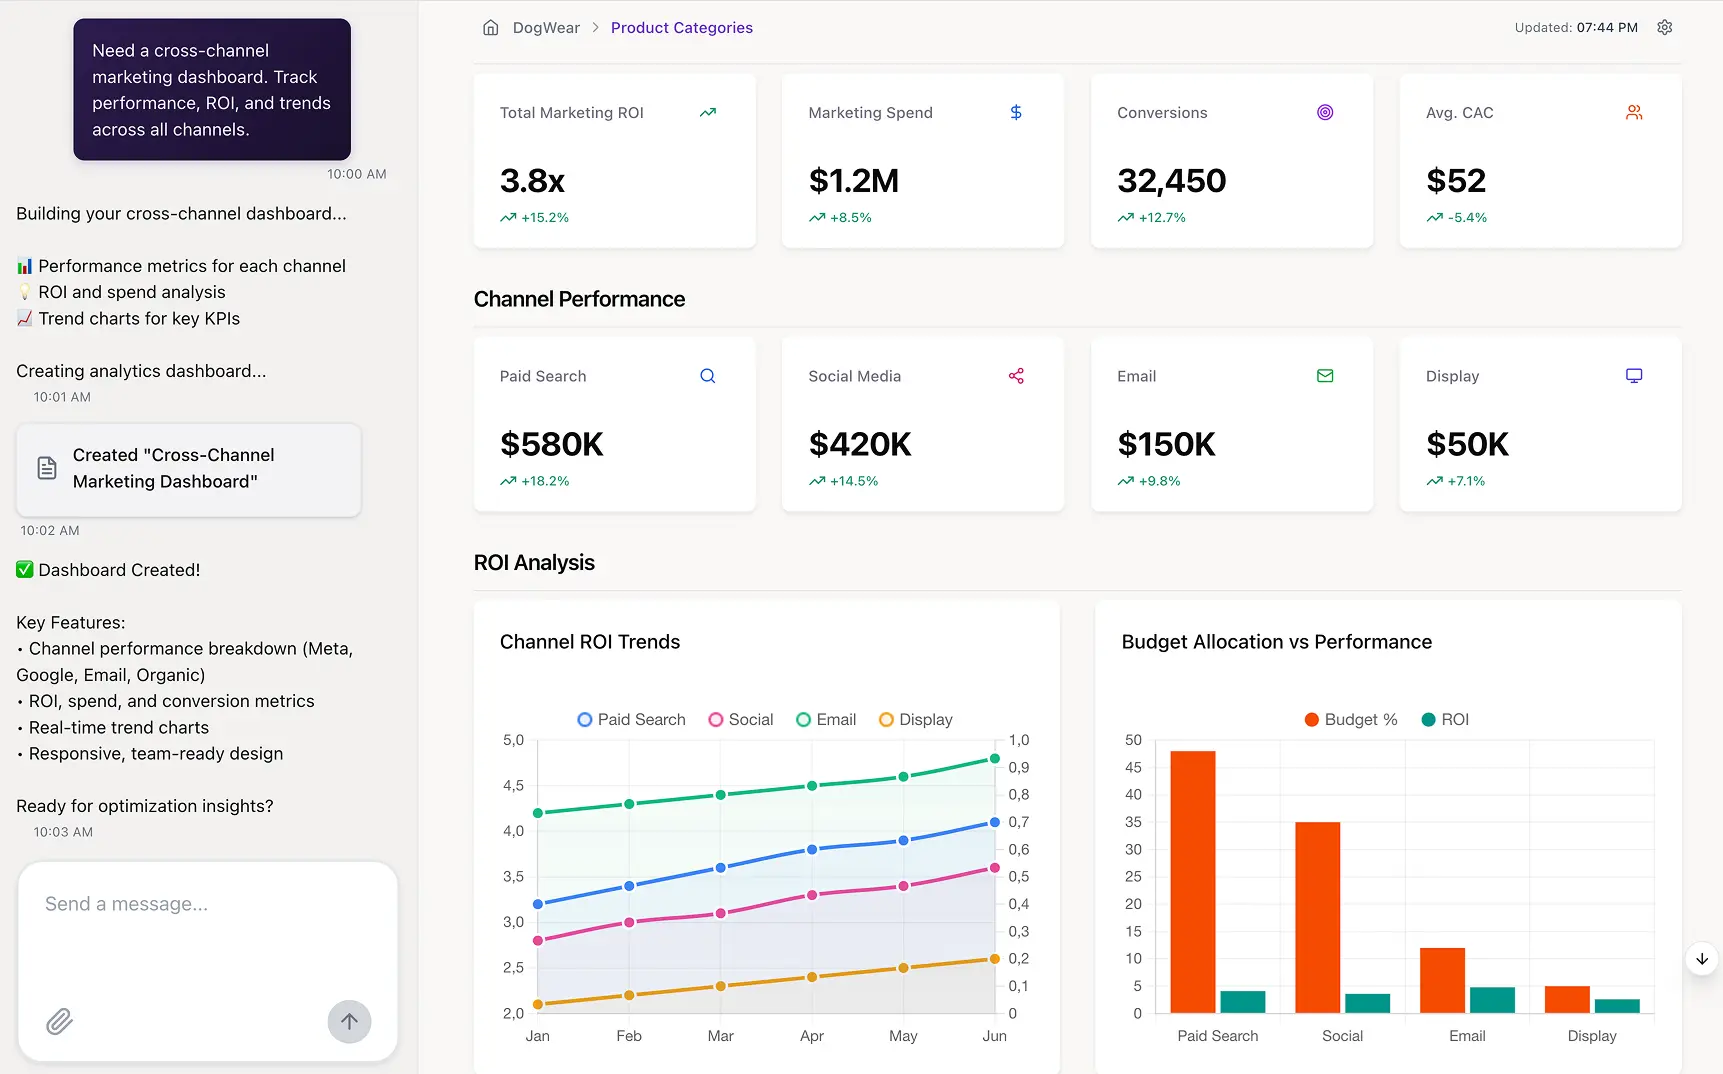
Dynamic reporting solved many of the limitations of static reports, but the next leap forward is already underway. AI is reshaping how organizations access insights, build dashboards, and communicate performance. Instead of waiting for weekly updates or relying on analysts to assemble views manually, teams can now generate reports on demand, instantly and in natural language.
AI-driven reporting removes the friction between a question and the answer. Users no longer need to navigate complex dashboards, understand SQL, or wait for data teams to prepare custom views.
They can simply ask a question “What drove last quarter’s CAC increase?” or “How is spend pacing today vs. target?” and receive clear, contextualized insights in seconds. This fundamentally changes how organizations interact with their data.
Improvado’s AI Agent is a leading example of this evolution. It sits on top of a unified, governed dataset and provides natural-language access to all marketing and revenue metrics. The AI Agent can:
- Generate executive summaries and performance reviews
- Build dashboards and visualizations automatically
- Send tailored insights to stakeholders in real time
- Diagnose performance anomalies and recommend actions
- Create report-ready narratives in seconds
Because it operates on top of clean, standardized data from Improvado’s pipeline, the insights are accurate, consistent, and aligned with enterprise definitions.
AI-enabled reporting marks the shift from passive consumption to active, conversational analytics. It reduces dependency on analysts for day-to-day questions and frees them to focus on deeper, strategic analysis.
Conclusion
The debate of static vs. dynamic reports is not about choosing a winner. It is about understanding that both are powerful tools with distinct purposes.
Static reports provide the finality, structure, and authority required for strategic planning, compliance, and executive communication. Dynamic reports offer the real-time interactivity needed for agile operations, rapid optimization, and deep exploration of performance drivers.
Mature organizations rely on both: static reports for clarity and alignment, dynamic reports for speed and adaptability.
The key to making both reporting formats effective is a strong, unified data foundation. Without clean, consistent, and governed data, neither static nor dynamic reporting can deliver accurate insights. This is where Improvado provides a major advantage. It centralizes cross-channel data, standardizes metrics, and ensures every report, manual or automated, uses the same trusted source of truth.
If you want to upgrade your reporting capabilities and build them on reliable, unified data, request a demo of Improvado.
Before Improvado, preparing reports at Signal Theory was a labor-intensive process, often taking four hours or more per report. Switching to Improvado reduced that time by over 80%, making reporting significantly more efficient and far less stressful.
"Reports that used to take hours now only take about 30 minutes. We're reporting for significantly more clients, even though it is only being handled by a single person. That's been huge for us.”