Modern marketing teams rely on hundreds of metrics across dozens of platforms, each with its own naming conventions, calculation methods, and data structures. Without a unified framework, even basic KPIs like CAC, ROAS, or MQL can mean different things to different teams. This inconsistency creates reporting conflicts, slows decision-making, and erodes trust in the data.
A metrics layer solves this problem by standardizing definitions and ensuring every stakeholder works from the same source of truth.
This article explains what a metrics layer is, why enterprise teams need it, and how it enables accurate, scalable reporting across the organization. By the end, you'll understand how a metrics layer strengthens your entire data ecosystem and how to implement one effectively.
Key Takeaways:
- A metrics layer centralizes all KPI definitions, eliminating inconsistencies across BI tools and teams.
- A metric layer guarantees that a metric like "monthly active users" is calculated the same way everywhere, every time.
- Business logic is defined once in the metrics layer, not repeated (and varied) in every dashboard or report.
- When a metric definition needs to change, you update it in one place, and the change propagates to all downstream tools instantly.
- It provides business users with a reliable set of pre-defined metrics, fostering confident, data-driven decisions without constant help from data teams.
What Is a Metrics Layer?
A metrics layer is a pivotal component of the modern data stack. It is a code-based framework. Data teams use it to define key business metrics and their dimensions.
A metric layer isn't just a glossary or a wiki page. It's executable code. This code dictates precisely how each metric should be calculated from the raw data.
For example, the definition for "Net Revenue" might be coded as sum(payments) - sum(refunds). This definition is then stored, version-controlled, and applied universally.
The metrics layer removes ambiguity. It centralizes KPI logic so every system, dashboard, and analysis pulls from the same governed definitions. This creates alignment between marketing, sales, finance, and BI. It also reduces the time teams spend reconciling numbers or debating which version is correct.
A strong metrics layer improves the accuracy and credibility of your reporting. It accelerates analysis by eliminating manual cleanup and one-off calculations. Most importantly, it ensures that the insights guiding strategic decisions are based on consistent, trusted data.
Metrics Layer vs. Semantic Layer: Unpacking the Key Differences
A metrics layer and a semantic layer are two important concepts to understand. While they are closely related, they differ in scope and function. Knowing these differences is essential for designing the right data architecture for your organization.
Similar Goals, Different Scopes
Both layers aim to make data easier for business users to understand and use. They both translate raw data into business concepts.
However, a metrics layer focuses specifically on defining quantitative measures (metrics) and the ways to slice and dice them (dimensions).
A semantic layer is broader. It aims to create a complete business representation of all data, including complex hierarchies, relationships between entities, and richer metadata, not just metrics.
How a Metrics Layer is a Component of a Semantic Layer
You can think of a metrics layer as a core, and often the most important, component of a full semantic layer.
A mature semantic layer will always contain a robust metrics layer. However, you can implement a metrics layer on its own to solve the immediate and painful problem of inconsistent KPIs.
Many organizations start with a metrics layer and evolve it into a more comprehensive semantic layer over time.
The Rise of the dbt Semantic Layer
Tools like dbt (Data Build Tool) have revolutionized data transformation. The introduction of the dbt Semantic Layer extends this power into the analytics consumption space. It allows teams to define their metrics directly within their dbt projects, alongside their data models.
This creates a tightly integrated workflow from raw data to defined metric. It has become a popular choice for teams already using dbt for their transformation layer.
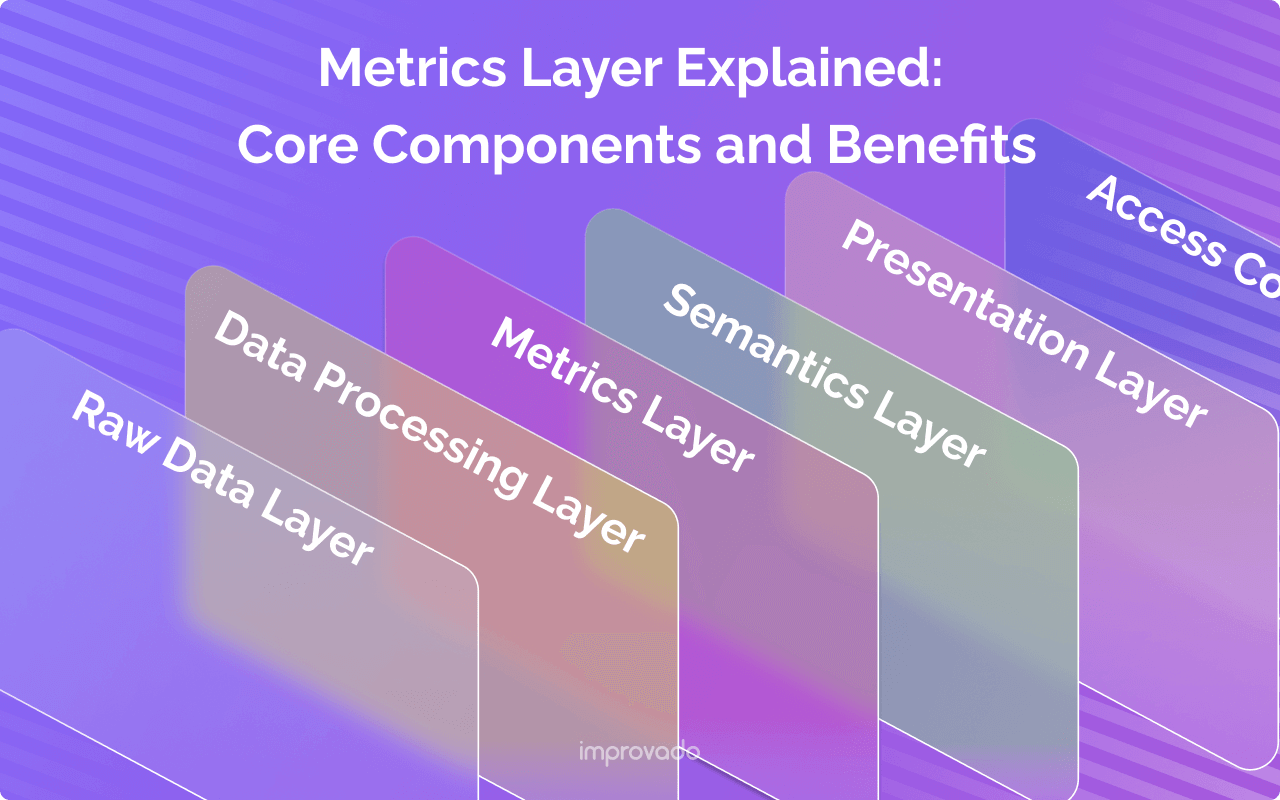
The Core Components of a Robust Metrics Layer
A well-architected metrics layer is built on several key pillars.These components work together to form a cohesive system for metric management.
Data Models: The Structural Blueprint
The foundation of any metrics layer is the underlying data model. This refers to the clean, structured tables in the data warehouse that the metrics will be built upon.
These tables should be well-organized and conform to best practices, such as star or snowflake schemas. The metrics layer references these tables to perform its calculations.
Metric Definitions: The Code of Consistency
This is the heart of the metrics layer. Each metric is defined as code, typically in a declarative language like YAML. The definition includes the metric name, the calculation type (e.g., sum, count, average), the underlying database column, and any necessary filters. This codified approach ensures every metric is unambiguous and reproducible.
Business Logic & Transformations: The Rules Engine
Beyond simple calculations, the metrics layer must encapsulate complex business logic. For example, defining an "active user" or calculating multi-touch marketing attribution requires specific rules.
This logic is coded into the layer, so it's applied consistently. When business rules change, data teams only need to update the logic in one central location.
Metadata Management: The Data's DNA
A metrics layer is also a rich source of metadata. This includes business-friendly descriptions of each metric, ownership information, data lineage, and certification status.
This metadata is crucial for building trust and enabling self-service analytics. When a user sees a metric in a dashboard, they can also see its full definition and origin.
Governance & Authorship: Who Owns the Metrics?
Strong governance is critical for a successful metrics layer. This involves establishing clear processes for how new metrics are proposed, reviewed, approved, and deprecated. It defines authorship and ownership, ensuring that every metric has a designated expert responsible for its accuracy and relevance.
This prevents the metrics layer itself from becoming a disorganized free-for-all.
The Business-Critical Benefits of Implementing a Metrics Layer
Adopting a metrics layer isn't just a technical improvement; it's a strategic business decision. The benefits ripple across the entire organization, from data teams to the C-suite, fostering a more efficient and intelligent data culture.
Unwavering Consistency in Reporting
This is the most immediate and impactful benefit. When everyone uses the metrics layer, arguments over whose numbers are "right" disappear.
Board meetings can focus on strategy, not on reconciling conflicting dashboards. This trust in the data is the foundation for making confident decisions and is a key driver for successful reporting automation.
Enhanced Scalability for Data Teams
Data teams are often a bottleneck. They are constantly bombarded with requests for new reports and data pulls. A metrics layer empowers business users to answer many of their own questions through self-service BI tools.
This frees up the data team to focus on more strategic work, like building new data products and improving the data infrastructure, rather than writing repetitive SQL queries.
Unmatched Flexibility and Agility
Business priorities change. New products launch. Markets shift. A metrics layer provides the agility to adapt your analytics to these changes.
Need to update how you calculate customer lifetime value? Change the definition once in the metrics layer, and every single report and dashboard updates automatically.
This is a massive improvement over manually updating hundreds of individual queries.
Fostering Data Democratization
Data democratization is the idea that everyone in an organization should have access to the data they need to do their jobs. The metrics layer makes this possible in a safe and governed way.
It provides a curated, reliable set of building blocks (metrics and dimensions) that business users can confidently use to explore data and create their own analyses without needing to understand the complexities of the underlying database.
Accelerating Time-to-Insight
With a metrics layer, the path from a business question to a data-driven answer is dramatically shorter. Analysts and business users can quickly assemble reports and visualizations using trusted, pre-defined metrics. There's no need to wait for a data engineer to write a custom query.
This speed allows organizations to identify trends and opportunities faster, creating a significant competitive advantage.
The Problem: The High Cost of Ad-Hoc SQL and Inconsistent Metrics
Without a metrics layer, organizations operate in a state of quiet data chaos. The challenges are often so ingrained in the daily workflow that they become accepted as "the cost of doing business."
However, the true cost of this ad-hoc approach is enormous.
When Every Analyst is an Island
In a world without a metrics layer, every analyst writes their own SQL queries to answer business questions. While skilled, each analyst may have slightly different interpretations of the data or business rules.
One analyst might include test users in their "active user" count, while another excludes them. These small data discrepancies multiply across the organization, leading to a landscape where no two reports ever perfectly align.
The Dangers of "Metric Drift"
Metric drift occurs when the definition of a key metric slowly changes over time without a formal process. A query written three years ago might still be running in a critical dashboard, but the business has evolved.
The original author may have left the company, and no one is sure exactly how it works. This leads to decisions being made on outdated or incorrect logic, a silent but deadly problem for any organization.
How Ad-Hoc Queries Drain Resources
The constant cycle of writing, debugging, and maintaining thousands of individual SQL queries is a massive drain on data team resources. It's repetitive, error-prone, and unscalable.
Every new question requires a new query. Every change to the underlying data can break hundreds of reports.
This reactive, "fire-fighting" mode prevents data teams from working on high-value, strategic projects that could truly move the business forward.
Comparing Metrics Layer Approaches
There is no single "right" way to implement a metrics layer. The best approach depends on your existing data stack, team skills, and long-term goals. Here, we compare the most common implementation patterns.
| Approach | Description | Pros | Cons | Best For |
|---|---|---|---|---|
| BI Tool Integrated | The metrics logic is defined within the BI tool itself (e.g., Looker's LookML, Power BI's DAX). | Tightly integrated experience; fast to get started if you use one BI tool. | Creates vendor lock-in; logic is not portable to other tools. | Companies committed to a single BI platform for all analytics. |
| Transformation Integrated | Metrics are defined within the data transformation layer (e.g., dbt Semantic Layer). | Metrics live with the data models; version controlled; tool-agnostic. | Newer technology; ecosystem of integrations is still growing. | Teams already using dbt for data transformations. |
| Standalone "Metrics Store" | A dedicated open-source or commercial tool for defining and serving metrics (e.g., Cube, Metriql). | Maximum flexibility; tool-agnostic; connects to any source and any BI tool. | Requires managing another piece of infrastructure; can be complex to set up. | Organizations with a diverse set of data consumption tools. |
| Headless BI / Platform | Platforms like Improvado that handle data ingestion, transformation, and metric definition in a unified, managed service. | End-to-end solution; no-code/low-code interface; managed infrastructure. | May be less customizable than open-source tools for very specific use cases. | Marketing and business teams who need a fast, reliable path from raw data to insights without heavy engineering. |
A Step-by-Step Guide to Implementing a Metrics Layer
Implementing a metrics layer is a structured project, not a one-off task. Following a clear process ensures a successful rollout that delivers lasting value. This process involves careful planning, design, and execution.
Step 1: Assessment and Discovery
Before designing anything, you must understand the current reporting landscape in depth.
This phase establishes the foundation for every decision that follows.
Key tasks include:
- Inventory existing KPIs and calculations across marketing, sales, finance, product, and BI.
- Document metric variations and inconsistencies, including naming differences and conflicting logic.
- Identify systems of record for each data domain and assess data quality.
- Map stakeholder workflows to understand how metrics are used in planning, budgeting, and reporting.
- Surface sources of friction: duplicate dashboards, manual reconciliations, and competing definitions.
This discovery work defines scope, uncovers dependencies, and ensures the metrics layer reflects how the business actually operates.
Step 2: Design and Architecture
Once requirements are clear, shift to architectural design. The goal is to build a structure that is transparent, maintainable, and scalable.
Design considerations include:
- Choosing an implementation pattern (dbt metrics, semantic layer in your warehouse, standalone metrics store).
- Defining standard naming conventions for metrics, dimensions, and entities.
- Creating a folder and versioning structure to ensure clarity and change traceability.
- Drafting metric definitions with explicit logic, edge cases, filters, and data dependencies.
- Developing a governance model that specifies how new metrics are added, reviewed, and approved.
This stage determines the long-term sustainability of your metrics layer.
Step 3: Tool Selection
Select tools that support your architectural approach and integrate well with your existing data stack.
Evaluate tools based on:
- Compatibility with your warehouse (Snowflake, BigQuery, Redshift, Databricks).
- Support for semantic modeling and governed metric definitions.
- Integration with BI tools such as Looker, Tableau, Power BI, or Mode.
- Automation and data integration capabilities to ensure all sources feed the metrics layer accurately.
- Scalability, security, and role-based access for enterprise usage.
- Maturity of documentation and community support.
The right tooling reduces technical overhead and ensures long-term viability.
Step 4: Implementation and Development
Start small and grow deliberately. The goal is to create early wins without overextending the team.
Execution steps:
- Select a small set of high-impact metrics (e.g., CAC, ROAS, LTV, MQL, SQL).
- Write precise metric definitions using your chosen tool or framework.
- Build the necessary transformation logic to unify, clean, and structure the underlying data.
- Document assumptions and edge cases to ensure transparency.
- Iterate quickly, deliver one or two metrics end-to-end before expanding coverage.
This iterative method builds organizational trust and reduces implementation risk.
Step 5: Testing and Validation
Accuracy is non-negotiable. A metrics layer that produces incorrect values will never gain adoption.
Validation process:
- Compare outputs against trusted legacy reports and manually verified calculations.
- Build automated tests to detect schema changes, null spikes, or unexpected metric drift.
- Run cross-team reviews to ensure consensus across marketing, sales, finance, and BI.
- Validate edge cases such as partial periods, backfilled data, and historical anomalies.
Stakeholder buy-in during this phase is essential for smooth rollout.
Step 6: Deployment and Integration
Once validated, begin integrating the metrics layer into downstream tools and workflows.
Key actions include:
- Connecting BI platforms so dashboards reference governed metrics instead of ad hoc logic.
- Migrating a small number of high-visibility dashboards (e.g., executive KPIs) to demonstrate value.
- Providing documentation on metric definitions, use cases, and governance processes.
- Training analysts and business teams to query and interpret metrics consistently.
Gradual adoption ensures stability and reduces the burden on support teams.
Step 7: Maintenance and Iteration
A metrics layer is a living product. It evolves as the business evolves.
Ongoing responsibilities include:
- Adding new metrics as the organization expands its product lines, markets, or channels.
- Updating existing definitions when business logic changes.
- Deprecating outdated metrics to prevent confusion.
- Monitoring data quality and pipeline performance.
- Collecting feedback from analysts and business stakeholders to refine usability.
By treating the metrics layer as a governed, maintained asset, you ensure it continues to drive alignment and decision-making across the organization.
The Metrics Layer's Role in the Modern Data Stack
The modern data stack is a modular ecosystem of tools designed for flexibility and scalability. The metrics layer plays a unique and increasingly critical role within this stack, acting as the connective tissue between data processing and data consumption.
Where It Fits: Between the Warehouse and BI
The metrics layer occupies a strategic position. It sits directly on top of the data warehouse (like Snowflake, BigQuery, or Redshift) and serves data to all downstream tools. This includes business intelligence platforms, data science notebooks, and even embedded analytics applications.
Its central position is what allows it to enforce consistency across all of these different consumption points.
The Impact on the Entire Marketing Data Pipeline
For marketing teams, this is a game-changer. A well-structured marketing data pipeline powered by a metrics layer means that metrics like Cost Per Acquisition (CPA), Return on Ad Spend (ROAS), and Customer Lifetime Value (LTV) are standardized.
This allows for true cross-channel analysis and accurate calculating ROI, which is impossible when every platform reports its own version of the truth.
How Improvado Acts as a Universal Metrics Layer
For many organizations, especially in marketing and sales, building a metrics layer from scratch using code-heavy tools is a significant undertaking. Improvado provides an out-of-the-box solution that delivers all the benefits of a metrics layer without the extensive engineering overhead.
Automating Data Integration from 1,000+ Sources
A metrics layer is only as good as the data it sits on. Improvado automates the painful process of extracting and loading data from hundreds of marketing, sales, and analytics platforms.
This ensures you have a comprehensive, up-to-date dataset in your warehouse to build your metrics upon.
Standardizing Inconsistent Naming Conventions
Different platforms use different names for the same concept (e.g., "spend" vs. "cost" vs. "amount spent"). Improvado's transformation layer automatically normalizes these fields into a single, consistent format. This data cleansing is a critical prerequisite for a functioning metrics layer.
Before Booyah Advertising implemented Improvado, their analytics team struggled with fragmented data architecture and frequent accuracy issues. Entire days of data were missing, duplicates distorted performance metrics, and aggregation across over 100 clients required extensive manual reconciliation.
After the migration to Improvado, Booyah realized 99.9% data accuracy and cut daily budget-pacing updates from hours to 10-30 minutes. Improvado’s unified pipelines, normalization logic, and real-time refresh capability gave the agency full visibility and control over multi-source data (15–20 feeds per client).
“We never have issues with data timing out or not populating in GBQ. We only go into the platform now to handle a backend refresh if naming conventions change or something. That's it.
With Improvado, we now trust the data. If anything is wrong, it’s how someone on the team is viewing it, not the data itself. It’s 99.9% accurate.”

Providing a Codeless Transformation Layer
With Improvado, you can define your business logic and create custom metrics using an intuitive, visual interface. There's no need to write complex SQL or YAML.
This empowers marketing and data analysts to own their metric definitions, freeing up engineering resources for other tasks.
Delivering Analysis-Ready Data to Any Destination
Improvado acts as a headless BI platform. Once your data is integrated and your metrics are defined, Improvado can send this clean, analysis-ready data to any destination you choose. This could be a BI tool like Tableau or Power BI, a data warehouse like BigQuery, or even Google Sheets. You get the benefit of a centralized metrics layer while still using the tools your team loves.
Conclusion
The move away from data chaos towards data clarity is the single most important shift happening in analytics today. A metrics layer is no longer a luxury for large enterprises; it is a foundational component for any organization that wants to be truly data-driven. It is the engine of consistency, the enabler of self-service, and the accelerator of insights.
By defining your business in code, you create a shared language and a common understanding that aligns every team around the same set of numbers. This eliminates wasted time spent reconciling reports and empowers teams to focus on strategic action. Whether you build it yourself with open-source tools or leverage a platform like Improvado, adopting a metrics layer is the most strategic investment you can make in your data culture. It is the path to building a resilient, agile, and intelligent organization.
Related reading: Porter Metrics: Features, Pricing & Alternatives (2026), What is Non-Aggregatable Data? The Ultimate Guide for 2026, Qualitative vs Quantitative Metrics: A Complete Guide (2026)