In an era where smartphones are virtually extensions of our hands, social media has woven itself deeply into every facet of the customer journey, from discovery through to purchase and beyond. This evolution has made social media reporting essential for brands aiming to capture attention and engage with their audience effectively.
This guide delves into the fundamentals of social media analytics, breaking down its key components, essential metrics, and offering a primer on initiating comprehensive social media reporting.
What Is Social Media Analytics?
This analytical process encompasses a wide range of activities, from basic monitoring of likes and comments to advanced analysis of social conversations and competitor performance. Tools and platforms designed for social media analytics provide insights into what content resonates with audiences, optimal posting times, and how social media activities influence business outcomes.
What to Include in Your Social Media Report?
Creating a social media report involves compiling several key components to provide a comprehensive view of your social media strategy's effectiveness. Here's what to include, organized by essential components.
Goals and Strategy Overview
Begin with an outline of your strategic objectives for social media. This foundation sets the stage for analyzing whether your efforts align with the broader marketing goals and business objectives.
Objectives may range from enhancing brand awareness, increasing website traffic, fostering community engagement, to driving sales or lead generation.
Additionally, this section should discuss how social media strategies are integrated with broader marketing and business strategies. It's essential to illustrate the synergy between social media efforts and other marketing initiatives to ensure a cohesive and unified approach.
Audience Analysis
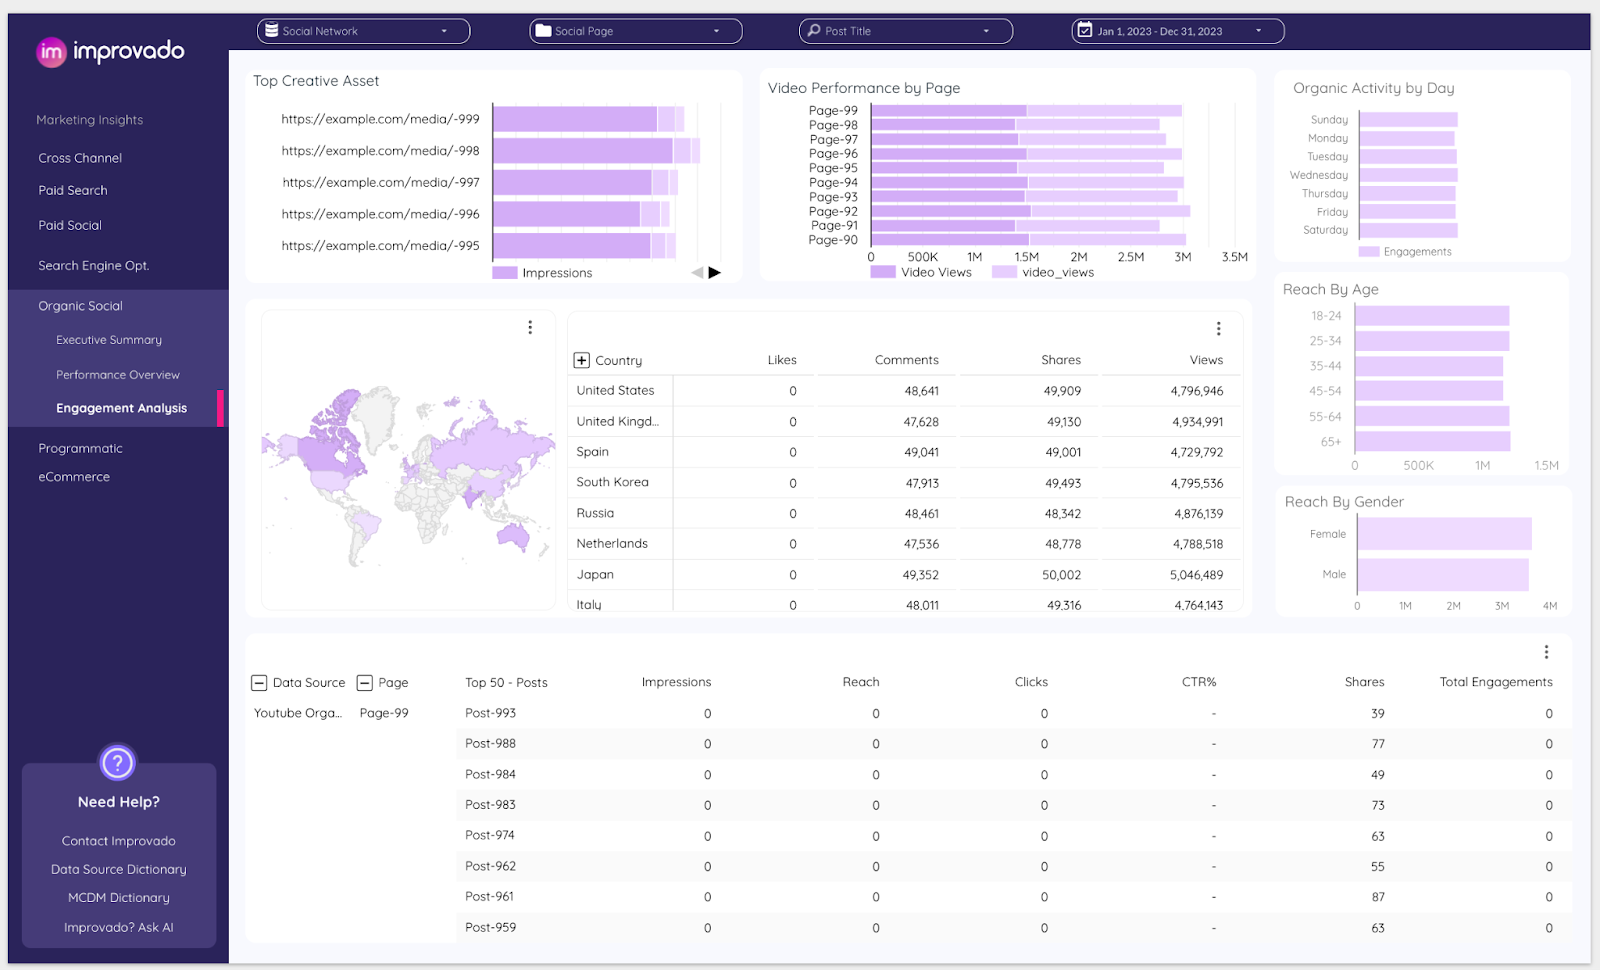
By segmenting your audience based on demographics such as age, gender, location, and language, you can begin to paint a detailed picture of your social media community. However, to truly understand your audience, going beyond these basic demographics to explore interests, online behaviors, and engagement patterns is essential.
Interests, for instance, can provide a window into the types of content that resonate most, whether it’s educational material, industry news, or entertainment. Behavior analysis, including the times when your audience is most active and the types of content they interact with (likes, shares, comments), can inform not only what you post but when you post it.
Content Analysis
Content analysis is a critical component of social media reporting, focusing on assessing the diversity and impact of your shared content. This analysis involves a detailed examination of the types of posts—such as images, videos, infographics, and blog links—to identify which formats engage your audience most effectively. Additionally, the thematic focus of these posts is scrutinized to ensure alignment with both audience interests and business objectives.
Expert content analysis also involves performance metrics, such as engagement rates, shares, and comments, to gauge content effectiveness. By correlating specific types of content with high-performance metrics, you can refine your content strategy to amplify successful themes and formats.
Engagement Analysis

Engagement analysis is a vital aspect of social media reporting, focusing on measuring and understanding how your audience interacts with your content. This process goes beyond mere likes and shares to delve into the nuances of audience participation and its implications for community building and brand loyalty.
At its core, engagement analysis examines a variety of interactions, from comments and shares to mentions, direct messages, and even the use of branded hashtags. By evaluating these interactions, you can identify patterns of engagement that signal what types of content resonate most with your audience.
This analysis should also consider the quality of interactions. Engagements like shares and thoughtful comments can indicate a higher level of audience investment compared to passive likes. Such qualitative insights are crucial for understanding the depth of your community's connection to your brand and identifying opportunities to foster stronger relationships.
Moreover, engagement trends can help pinpoint successful community-building efforts. High engagement levels often reflect a sense of community among followers, where users not only interact with your brand but also with each other. Identifying what stimulates such interactions can guide efforts to enhance community engagement and turn casual followers into brand advocates.
Performance Metrics

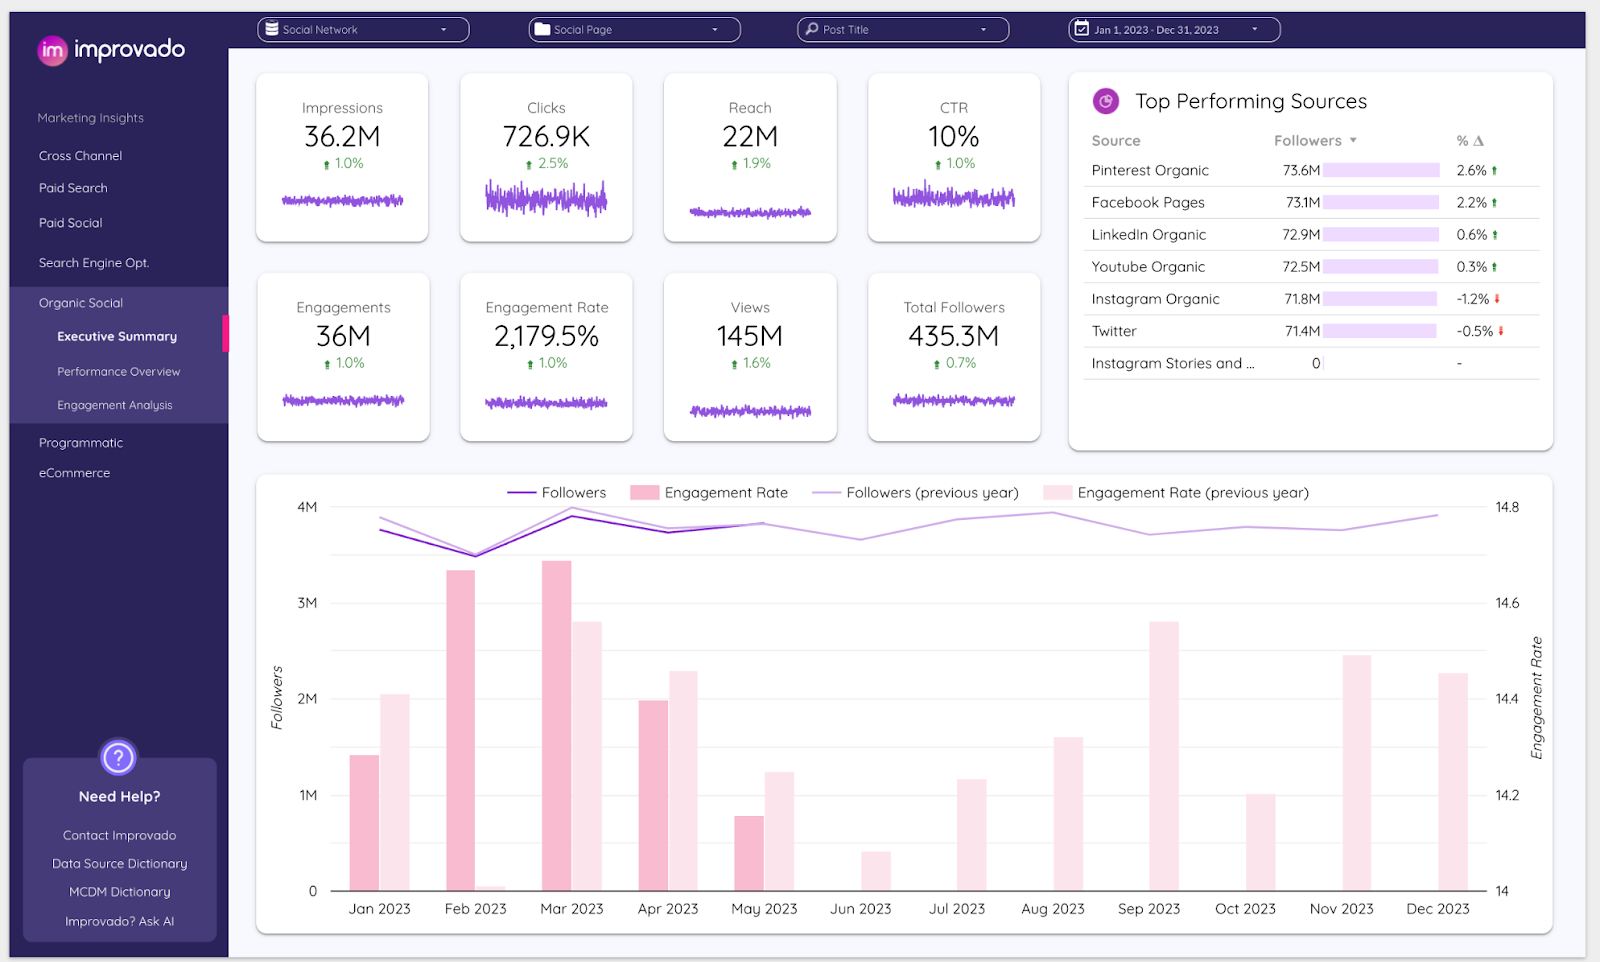
The analysis of performance metrics is a fundamental step in social media reporting, offering a quantifiable measure of your strategy's effectiveness. This part of the report aggregates key performance indicators (KPIs) that are most relevant to your established goals, ensuring a focused evaluation of your social media activities.
KPIs such as engagement rates, reach, impressions, and follower growth are among the primary metrics that provide insight into the performance of your social media efforts.
By focusing on KPIs relevant to specific goals—whether they involve boosting brand awareness, driving website traffic, or increasing conversions—social media reporting can deliver actionable insights. This data-driven approach enables you to refine your social media strategy continuously for maximum impact.
Comparative Analysis
Comparative analysis in social media reporting goes beyond self-evaluation, extending into competitive benchmarking. This critical component involves juxtaposing your social media performance with that of your industry peers or direct competitors. By measuring your metrics against industry standards or specific competitors, you gain a clearer perspective on where your brand stands in the larger market context.
This analysis aids in identifying your unique strengths, revealing competitive advantages that you can further capitalize on. Conversely, it highlights areas where competitors are excelling, offering insights into strategies that might improve your social media presence. Key areas for comparison often include engagement rates, content strategy effectiveness, audience growth rate, and the overall reach of social campaigns.
Insights and Recommendations
The final and perhaps most critical phase of social media reporting is translating raw data into actionable insights and strategic recommendations. This stage is where the analysis comes full circle, connecting the dots between social media activities and overarching business objectives. It involves a deep dive into what the data signifies about your social media strategy's performance and how it can be optimized for better results.
Getting Started with Social Media Reporting
Initiating social media analytics entails a structured approach to converting social media data into strategic insights. This section outlines the initial steps to take for effective social media reporting.
1. Select Relevant Metrics
Start by deciding on the data points you will use. Based on your objectives, choose metrics that will provide insights into your performance.
- Brand Awareness: To gauge how widely your brand is recognized, focus on reach (the number of unique users who saw your posts) and impressions (the total number of times your content was displayed).
- Engagement: Engagement metrics, such as likes, comments, shares, and the overall engagement rate, are essential for understanding how users interact with your content. High engagement rates often indicate content that resonates well with your audience.
- Traffic Generation: If driving traffic to your website is a goal, track click-through rates (CTRs) and referrals from social media platforms.
- Conversion and Sales: For objectives related to sales or lead generation, monitor conversion rates (the percentage of users who take a desired action after clicking on your post), as well as the cost per conversion. This helps evaluate the return on investment (ROI) of your social media campaigns.
2. Gathering and Analyzing Data
Accurate data collection underpins every insight derived and decision made. However, the diversity of social media platforms introduces complexity. Each platform may use unique terminology for similar metrics, making apples-to-apples comparisons challenging. For example, what Facebook calls "engagements" might be akin to "interactions" on Twitter, necessitating careful mapping and transformation of data to ensure consistency across platforms.
Manually collecting, mapping, and transforming this data is not only time-consuming but also prone to human error, potentially skewing analysis results. This tedious process can divert valuable time away from strategic analysis and decision-making.

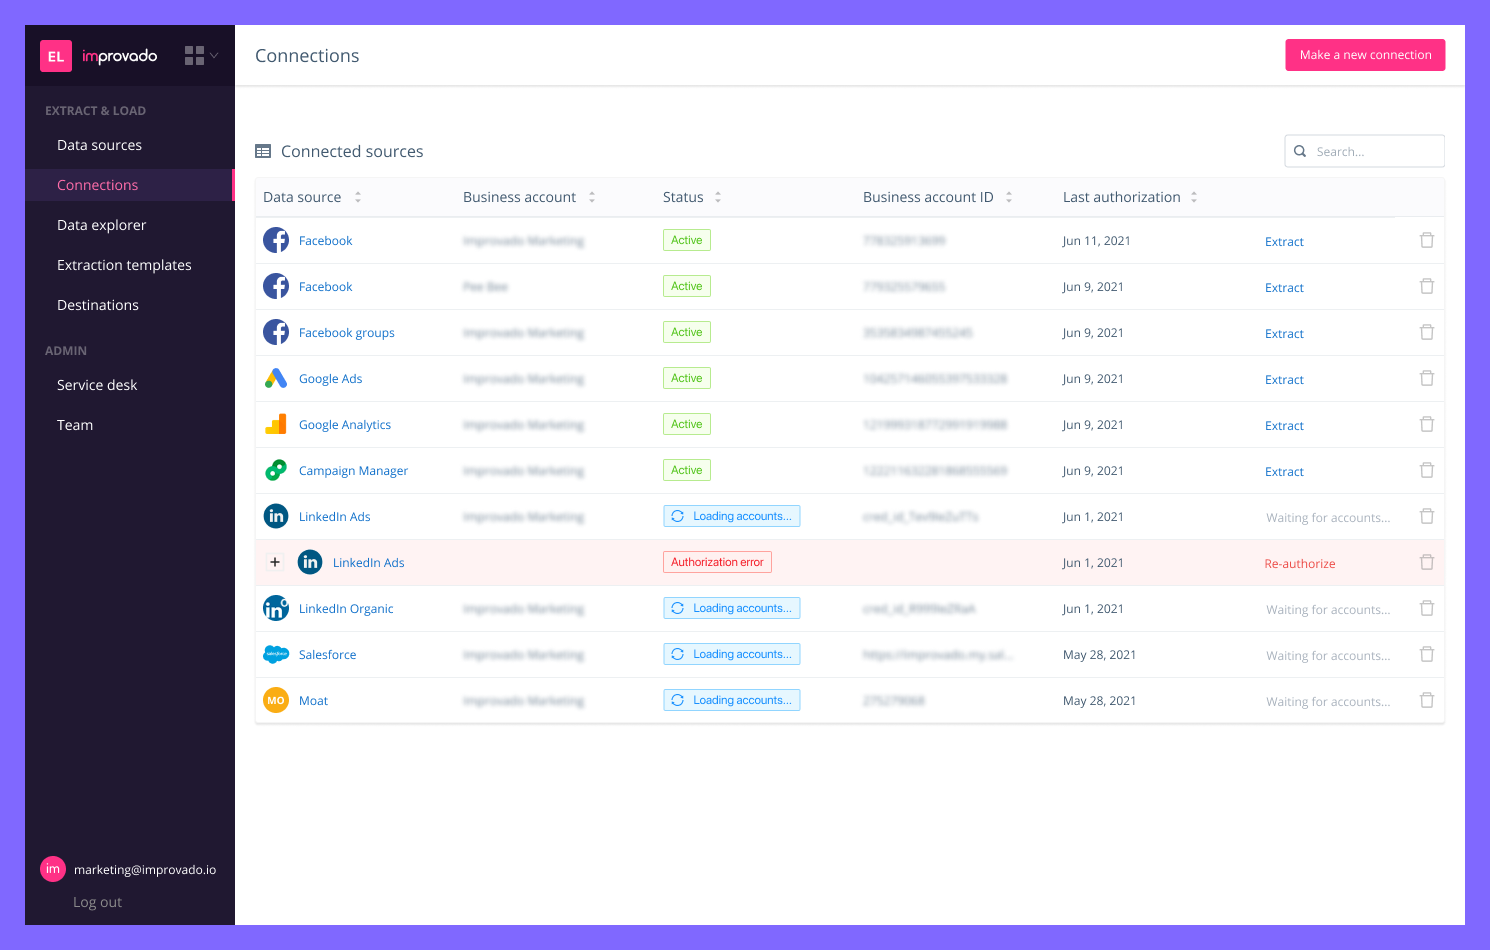
With Improvado, you get social media data ready for analysis without the need for manual coding or extensive IT support.
3. Determine Reporting Frequency
The frequency of social media reporting should align with the pace of your marketing activities and the agility of your decision-making process:
- Daily reporting might be necessary for fast-paced campaigns where immediate adjustments can significantly impact results.
- Weekly reports are beneficial for ongoing monitoring, allowing for the identification of trends and the optimization of strategies in near real-time.
- Monthly reports offer a broader view, ideal for assessing overall performance against strategic goals and making adjustments for the upcoming period.
- Quarterly reports, on the other hand, are crucial for high-level strategic reviews, providing insights into long-term trends and the effectiveness of strategic initiatives.
Choosing the right frequency depends on your specific goals, campaign durations, and the resources available for analysis. It's about finding a balance that provides actionable insights without overwhelming the team with data. Too frequent reporting can lead to analysis paralysis, while too infrequent reporting may miss opportunities for optimization.
4. Visualize the Data
Transforming raw data into a visual format is a powerful way to convey complex information quickly and effectively. Utilizing data visualization and business intelligence tools enables teams to grasp vast amounts of data at a glance, identify trends, and spot outliers or anomalies that might require further investigation.

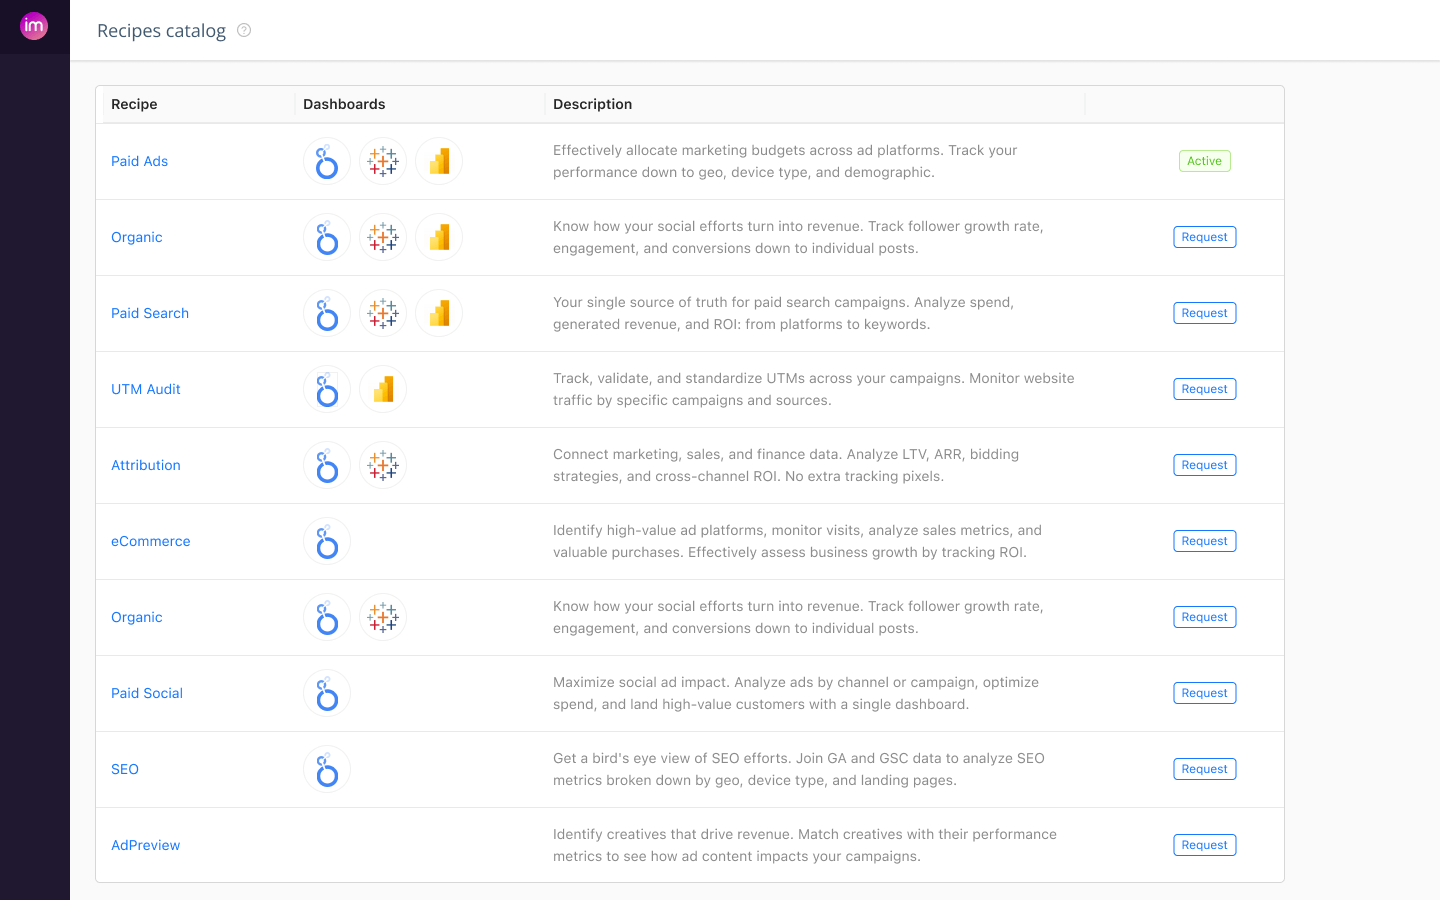
To streamline the reporting process, Improvado provides pre-build data models and dashboard templates tailored for specific marketing scenarios, including organic social media analysis. This ensures a smoother transition to data analysis, enabling businesses to focus on deriving actionable insights.
Book a demo call to learn more about Improvado and how it can simplify business intelligence at an enterprise level.
.png)
.jpeg)


.png)
