Marketers always face a critical need to validate the effectiveness and financial efficiency of their initiatives. Campaign and strategy ROI stands as a key metric for management to assess marketing performance. Addressing this, ROI dashboards and reports become indispensable, offering a direct view into the financial impact of marketing strategies.
This article explores how ROI dashboards and reports can empower marketers to meet these challenges head-on, providing the insights needed to optimize marketing performance and better justify investments.
Understanding ROI
ROI is calculated by subtracting the initial cost of the investment from the gain (or loss) generated by that investment, divided by the initial cost of the investment, and then multiplied by 100 to get a percentage.
Comparing ROI Reports and Dashboards

When it comes to measuring the return on investment (ROI), both ROI reports and ROI dashboards are important. However, they serve different purposes and offer distinct advantages. Understanding the differences between an ROI report and an ROI dashboard can help you decide which tool to use to foster decision-making in a specific area of your business.
ROI report
An ROI report is a detailed document that provides a comprehensive analysis of the returns generated from specific investments over a certain period. It is typically generated at regular intervals, such as monthly, quarterly, or annually, and is used for in-depth analysis.
Here are some key features of ROI reports:
- Detail-oriented: ROI reports include extensive data on costs, revenue, profit margins, and other relevant financial metrics. They often break down the performance of different investments, providing a granular view.
- Historical analysis: These reports allow for the examination of ROI over time, offering insights into trends, patterns, and the long-term effectiveness of investments.
- Customizable: ROI reports can be tailored to address specific questions or areas of interest, focusing on particular investments, campaigns, or time frames.
ROI dashboard
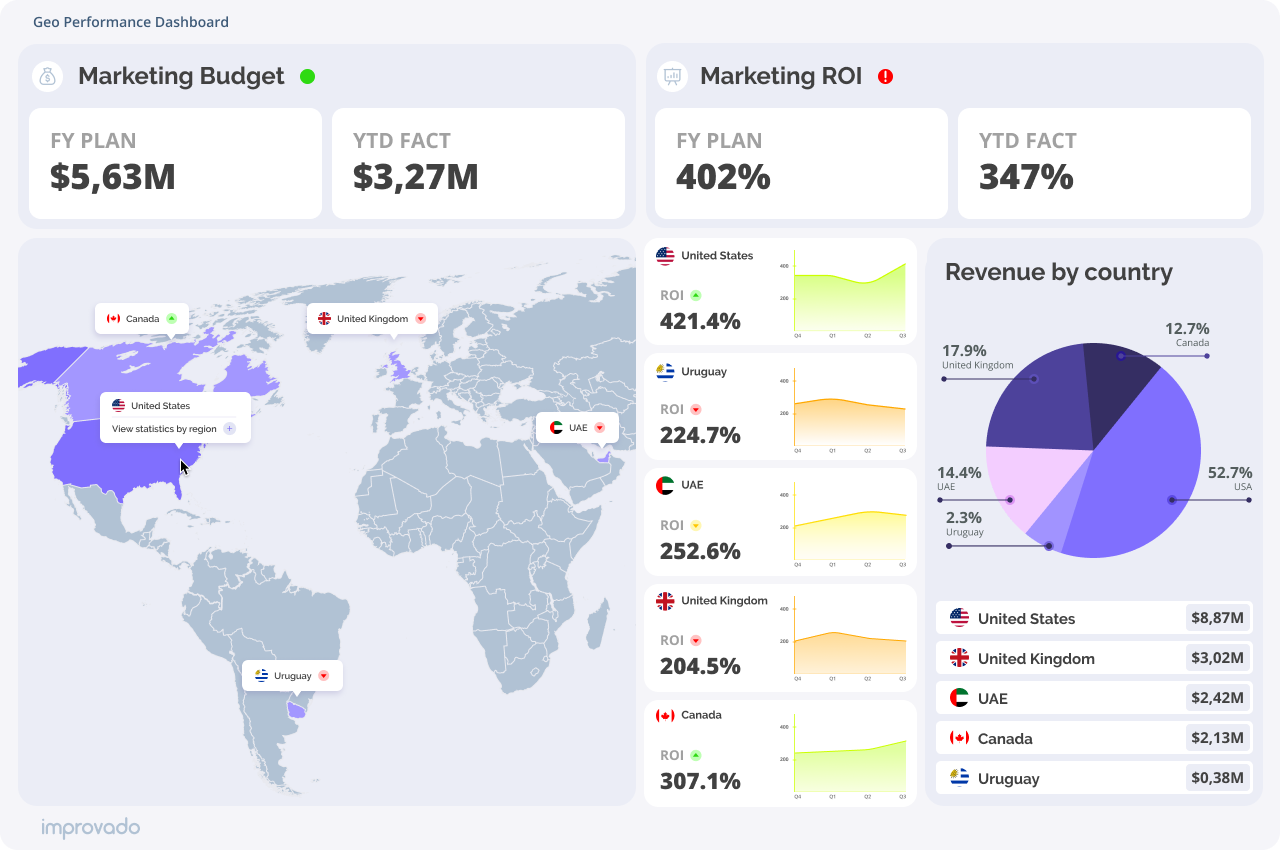
An ROI dashboard, on the other hand, is a dynamic, near real-time tool that displays the current performance of your investments and allows you to explore a historical perspective to some degree. Dashboards are typically accessible through business intelligence platforms or financial software. The key difference between dashboards and reports is that the former tend to focus on key metrics and hence are less granular than the latter.
Here are some characteristics of ROI dashboards:
- Real-time data: While it is common for dashboards to sync data on a daily or twice-daily basis, they can provide up-to-the-minute data, allowing users to quickly assess the performance of their investments. These assessments tend to decompose ‘performance’ into about a dozen of various metrics and focus on three-four of key ones. This is particularly useful for monitoring ongoing campaigns or investments.
- Visual representation: Dashboards use visualizations, such as charts, graphs, and indicators to represent data, making it easier to understand complex information (providing a more abstract yet holistic perspective compared to reports) and identify trends or issues promptly.
- Interactive: For instance, marketing ROI dashboards offer interactivity, such as the ability to drill down into specific data points or adjust the time frame being viewed. This allows users to explore the data more deeply without generating a new report.
Choosing between an ROI report and an ROI dashboard
The choice between an ROI report and an ROI dashboard comes down to the level of detail your business case requires to be solved:
- Use an ROI report when you need a comprehensive, detailed analysis for review, presentation, or strategic planning. ROI reports are ideal for deep dives into financial performance, understanding the nuances of various investments, and preparing for audits or stakeholder meetings.
- Use an ROI dashboard for ongoing monitoring and quick decision-making. Dashboards are suited for tracking the current performance of investments, identifying immediate opportunities or risks, and adjusting strategies on the fly.
- Use a combination of both when you see signs of performance anomalies in the dashboard — then a report will allow you to dig deeper and help discover the cause of the anomalies.
How to Create an ROI Report
Creating an ROI report involves a detailed process that captures the value generated from specific investments. It's a critical tool for businesses to assess the efficiency and profitability of their expenditures. Here's a step-by-step guide to creating an effective ROI report.
1. Define the objective
Start by clearly defining the purpose of the ROI report. Identify the specific investment or series of investments you're analyzing. This could be a marketing campaign, a capital expenditure, or any project for which you want to calculate ROI.
Understanding the objective will guide the data collection and analysis process. ROI reporting usually requires more data points than ROMI or ROAS reports, for example. Hence, be prepared to employ an analyst or even a couple data engineers when conducting ROI reporting.
2. Gather relevant data
Collect all necessary data related to the investment.
This includes:
- Cost data: All expenses associated with the investment, including initial setup costs, operational costs, maintenance, and any other direct or indirect costs.
- Revenue data: The income generated as a result of the investment. This could be in the form of sales, savings, or any other financial benefits.
- Intermediate data: If you’re planning to report on changes in your ROI over time, make sure to collect time series related to key performance indicators forming a foundation for revenue.

3. Calculate net profit
Subtract the total investment cost from the total revenue generated to find the net profit. This figure represents the actual financial gain from the investment.
Net Profit=Total Revenue−Total Cost
4. Calculate OI
Use the net profit and the total investment cost to calculate the ROI. One of the simple formulas to calculate ROI would be:
ROI=(Total Cost/Net Profit)×100
Express the result as a percentage to indicate the efficiency of the investment in generating profit.
5. Analyze the results
Interpret the calculated ROI in the context of your business objectives and the market environment. A high ROI indicates that the investment has been profitable, while a low ROI suggests that the investment may not be performing as expected.
6. Provide contextual information
Beyond raw numbers, include analysis that provides insights into why the investment performed the way it did. Consider external and internal factors that influenced the outcome. This might involve market trends, competition, execution challenges, or unforeseen events.
In many cases, the analysis of correlation between different trends represented as time series might come in handy. E.g., it is common in marketing to conduct marketing mix modeling (MMM) to discover factors that influence your ROI.
7. Make recommendations
Based on the ROI analysis, offer recommendations for future actions. This could involve suggesting adjustments to improve underperforming investments, scaling up successful ones, or exploring new opportunities with potential for high ROI.
8. Prepare the report
Compile your findings, analyses, and recommendations into a structured report. An effective ROI report should include:
- An executive summary highlighting key findings and recommendations.
- A detailed breakdown of costs and revenues.
- The ROI calculation and interpretation.
- Contextual analysis and insights.
- Recommendations for future investment strategies.
9. Review and revise
Before finalizing the report, review it for accuracy, clarity, and completeness. Ensure that the data, calculations, and analyses are accurate and that the report addresses the original objectives. Revise as necessary to improve the report's quality and usefulness.
Use a Shortcut — Ask AI Agent for an ROI Report

Building an ROI report or dashboard from scratch can be time-consuming and complex. What to do if you need insights now?
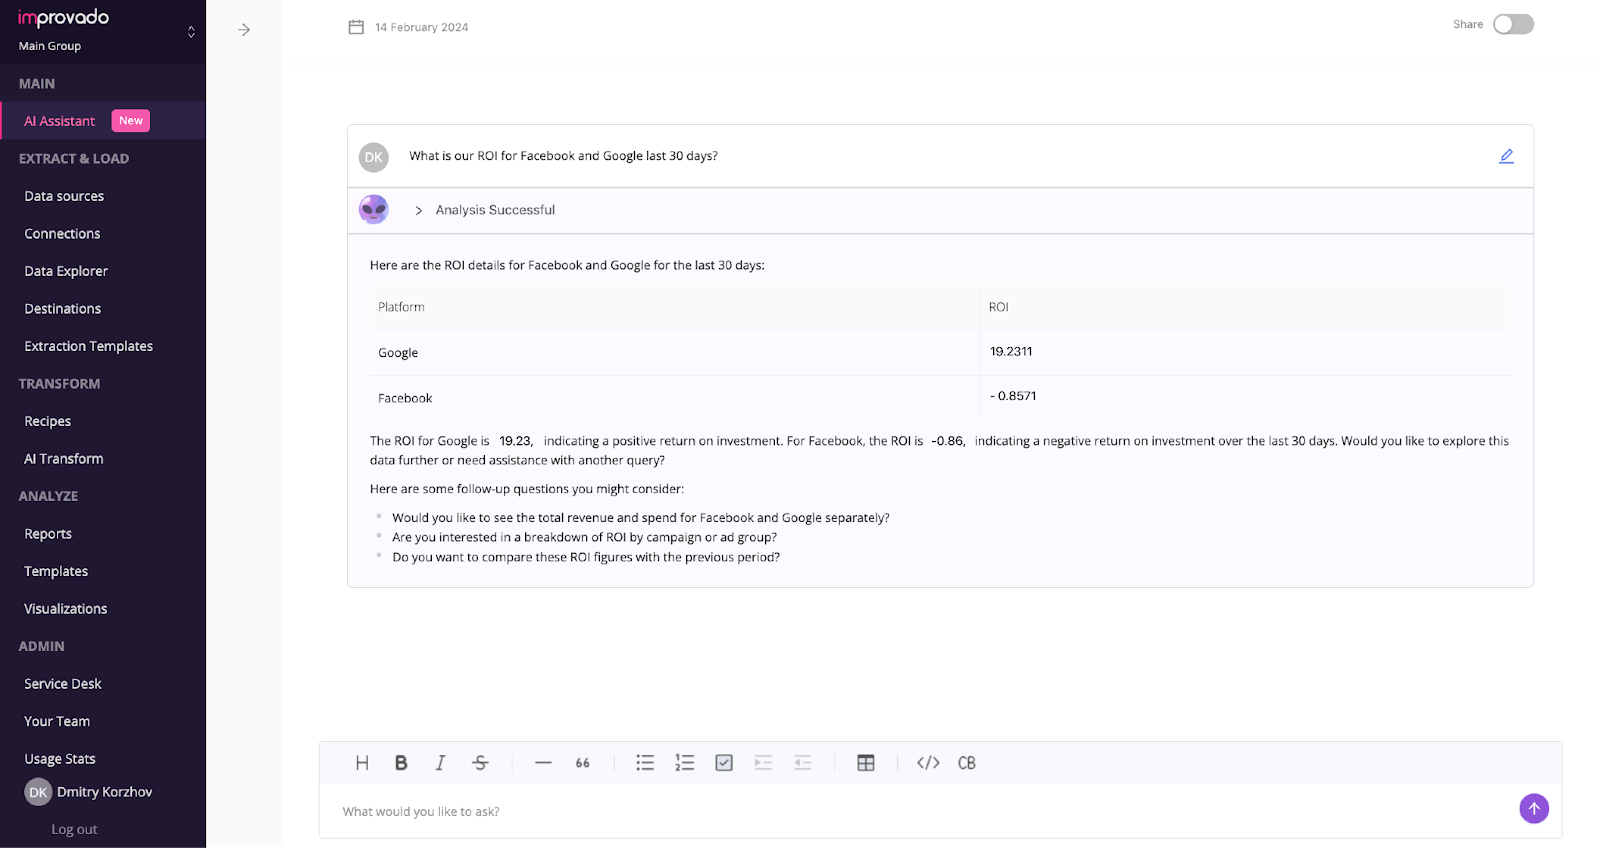
Leverage Improvado AI Agent, an AI-powered analytics tool, for instant performance analysis. Connected directly to the marketing database, the agent simplifies the process of getting ROI insights. Simply asking the Agent questions like "What's the ROI on our recent social media campaign?" or "Compare the ROI of our email campaigns this quarter" yields immediate insights.
This capability saves valuable time and enables marketers to make data-driven decisions swiftly. By bypassing the manual compilation of data and analysis, Improvado AI Agent offers a direct route to the insights needed for optimizing marketing strategies and justifying budget allocations.
Building an ROI Dashboard
Building an ROI dashboard involves creating a dynamic, visual tool that provides real-time insights into the performance of your investments. An effective dashboard can help you quickly assess whether the money you're putting into various projects or campaigns is yielding a favorable return. Here's how to build an ROI dashboard.
Define your objectives
Before you start building your dashboard, clearly define what you want to achieve. Identify the key performance indicators (KPIs) that matter most to your business. Your objectives might include tracking the ROI of specific marketing campaigns, investments in new technology, or capital expenditures.
Choose the right platform
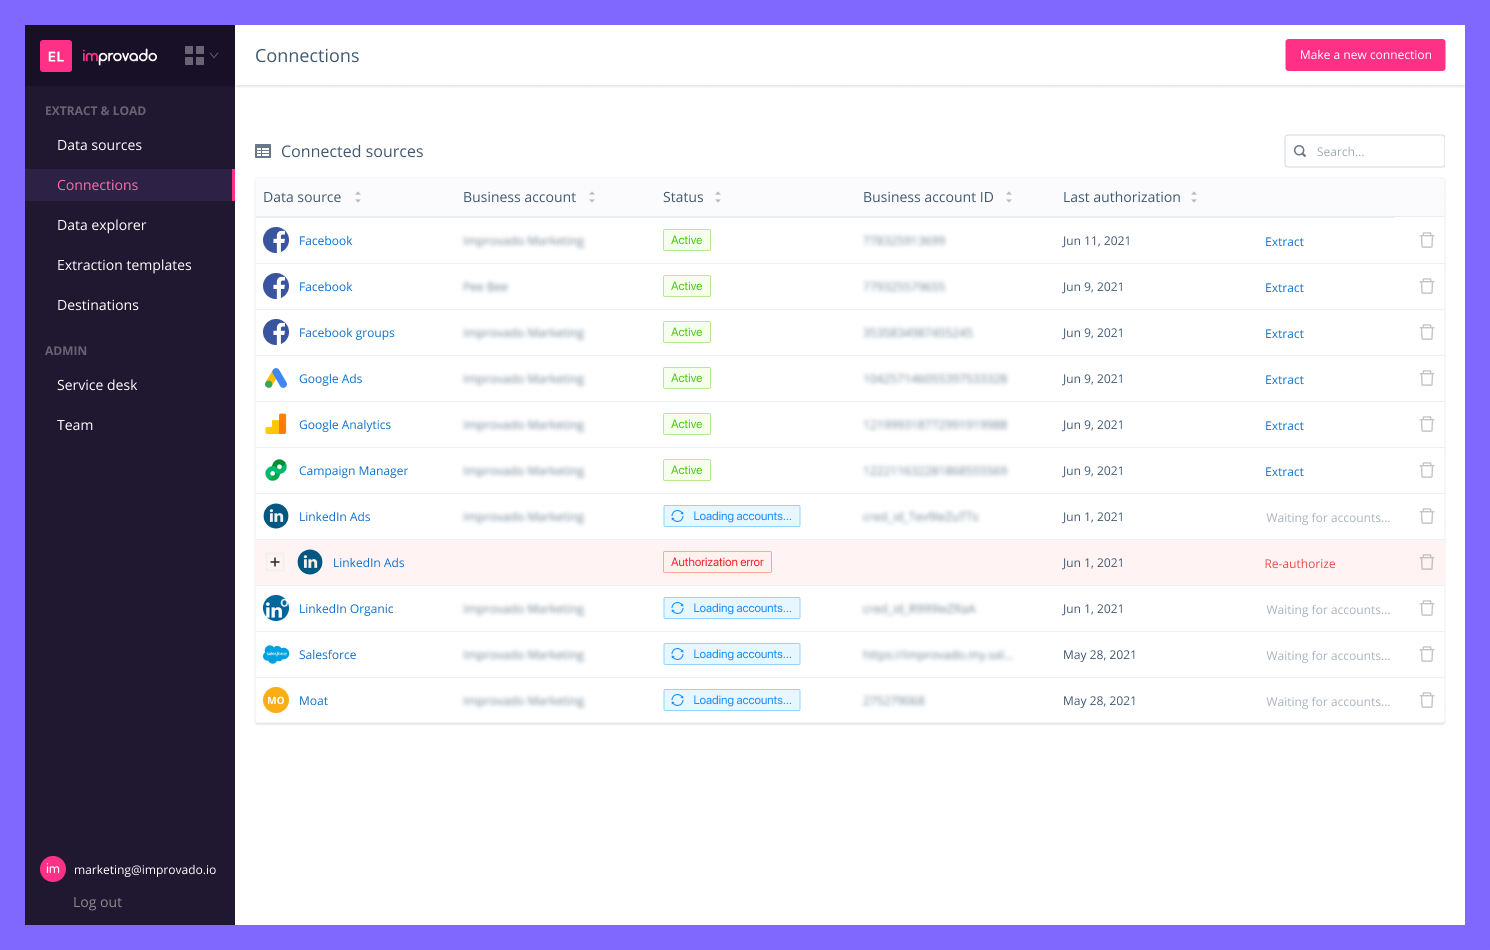
Select a business intelligence platform that suits your needs. Many businesses use software like Microsoft Power BI, Tableau, Google Data Studio, or Improvado. Choose a platform that integrates well with your existing data sources and is accessible to all intended users.
Integrate your data sources
Your marketing ROI dashboard will need to pull data from various sources, such as sales databases, marketing platforms, and project management tools. Ensure your chosen platform can integrate seamlessly with these sources to automate data collection and updates.
Design your dashboard layout
Plan the layout of your dashboard. It should be intuitive and easy to navigate. Common elements include overview widgets at the top, followed by more detailed charts and graphs. Consider your audience and prioritize the most important information.
Create visualizations
Develop visual representations for your KPIs. Use different types of charts and graphs to make the data easily understandable. For example, use line charts to show trends over time, bar charts to compare different investments, and pie charts to display proportions.
Implement interactivity
Add interactive elements to your dashboard. Features like filters, dropdown menus, and drill-down capabilities allow users to customize their view and explore the data more deeply. This enhances the usability and effectiveness of your dashboard.
Test and refine
Once your dashboard is built, test it thoroughly. Check for data accuracy, loading times, and ease of use. Gather feedback from end-users and refine your dashboard based on their input. This might involve adjusting the layout, adding or removing KPIs, and optimizing performance.
Monitor and update regularly
An ROI dashboard is not a set-and-forget tool. Monitor its performance and relevance regularly. Update it as your business goals evolve and as new data sources or technologies become available. Regular updates ensure your dashboard continues to provide value over time.
Report or Dashboard, Data Is Your Foundation
ROI is a key metric for evaluating how well investments work, helping shape business strategies. We looked closely at ROI reports and dashboards, showing how they differ and benefit businesses. ROI reports give thorough analyses for detailed planning, whereas dashboards offer immediate data for quick actions.
However, high-quality data is a foundation for both reports and dashboards. Gathering, organizing, and preparing data is a meticulous and resource-intensive process. With Improvado, your team can make a transformative shift from disparate to analysis-ready data, while the platform's analysis and insight discovery capabilities will help you save up to 82% time, support data-driven decision-making, and drive better business outcomes.
.png)
.jpeg)


.png)
