%2520(1).png)
The annual marketing report often feels like a daunting task. It's a year's worth of data, campaigns, and results condensed into one document.
Many marketers see it as a retrospective chore. But this view misses a massive opportunity. A well-crafted annual report is a strategic tool that justifies budgets, showcases value, and charts the course for future success.
This guide transforms your approach to year-end reporting. We will break down every essential component and provide actionable steps, examples, and templates to help you build a report that resonates with executives and stakeholders.
Key Takeaways:
- Strategic purpose: An annual marketing report is more than a summary; it's a strategic tool for securing budgets, proving ROI, and aligning marketing with business goals.
- Essential components: Every report must include an executive summary, a review of goals, deep channel analysis, key learnings, competitive insights, and a forward-looking strategy.
- Data storytelling: The most effective reports use data visualization and a clear narrative to explain the why behind the numbers, not just the what.
- Focus on business impact: Connect every marketing metric back to core business objectives like revenue, customer acquisition, and market share to demonstrate tangible value.
What Is an Annual Marketing Report?
An annual marketing report is a comprehensive document that details your marketing team's activities, performance, and impact over the entire year.It is a strategic analysis that provides context, uncovers insights, and makes recommendations for the future.
The annual report is created by the marketing team for the wider organization, including leadership, stakeholders, and other departments.
The true purpose of the annual report is to tell a story. This story is supported by data. It should answer critical questions:
- What were our biggest wins?
- Where did we fall short?
- How did our efforts contribute to revenue?
- What did we learn about our customers and our market?
The report provides a narrative that justifies past investments and builds a strong case for future strategies and budgets. A great report provides a foundation for the next year's marketing plan.
Defining the Annual Report vs. Monthly or Quarterly Reports
Marketing reporting happens at different cadences. Each serves a distinct purpose.
- Monthly reports focus on short-term tactical adjustments.
- Quarterly reports review progress against quarterly goals and allow for strategic pivots.
- The annual report, however, takes a much broader view. It assesses the overall effectiveness of your year-long strategy. It analyzes long-term trends and connects marketing efforts to annual business results. It is the definitive record of your team's contribution.
Who is the Audience? (C-Suite, Stakeholders, Team)
Always write your report with the audience in mind:
- The C-suite needs a high-level overview focused on ROI and business impact.
- Department heads want to see how marketing supports their goals.
- Your own marketing team needs a detailed analysis to learn and improve.
A well-structured report can serve all these audiences. It often starts with a concise executive summary and then provides deeper dives into specific areas for those who need more detail.
The Undeniable Benefits of a Yearly Marketing Report
A comprehensive annual marketing report requires disciplined data collection, rigorous analysis, and cross-functional alignment. The effort is significant, but the strategic payoff is even greater.
Securing Future Budgets with Data-Backed Proof
Budget negotiations hinge on evidence, not anecdotes. A yearly report consolidates all marketing activities and outcomes into a single, defensible narrative.
It quantifies the relationship between spend and measurable business results – pipeline contribution, revenue impact, customer acquisition costs, and retention improvements.
This shifts the conversation with leadership from “marketing believes” to “marketing demonstrates.”
Aligning Marketing with Overall Business Objectives
Producing the report forces marketing teams to map every initiative to corporate goals such as revenue growth, account expansion, brand penetration, or product adoption. This alignment ensures that marketing does not operate in a silo and that campaigns directly support broader strategic priorities.
For leadership, the report becomes evidence that marketing is not a discretionary spend but a coordinated driver of enterprise outcomes. For the marketing team, it reinforces focus and eliminates activities that do not move the business forward.
Demonstrating Marketing ROI and Team Value
An annual report provides a structured environment to quantify ROI by channel, by campaign, by audience, and by program.
Marketers can highlight the strategic rationale behind decisions, the efficiency gains achieved, and the incremental lift generated across the funnel.
This visibility is essential for validating team performance, strengthening internal credibility, and reinforcing morale. A clear ROI narrative is no longer optional; it is the foundation of modern marketing leadership.
Fostering Cross-Departmental Collaboration
A transparent annual report serves as a unifying artifact across the organization.
- Sales gains clarity into lead quality and pipeline velocity.
- Product teams gain insight into customer pain points, messaging resonance, and market demand.
- Finance sees how spend maps to outcomes, improving forecasting accuracy.
These shared insights create alignment, reduce organizational friction, and enable more coordinated planning cycles across departments.
Creating a Historical Benchmark for Year-Over-Year Growth
Each annual report becomes part of a longitudinal dataset that documents the company’s marketing evolution.
Over multiple years, these reports reveal patterns: which channels scale, which audiences convert, and which strategies consistently outperform.
This historical context sharpens forecasting models, improves budget allocation, and enables a more confident long-term planning process. It turns isolated performance snapshots into a growth narrative backed by evidence.
Core Components: What Every Annual Marketing Report Must Include
A successful report is well-structured and easy to follow. While the specifics may vary, every comprehensive annual marketing report should contain these core sections.
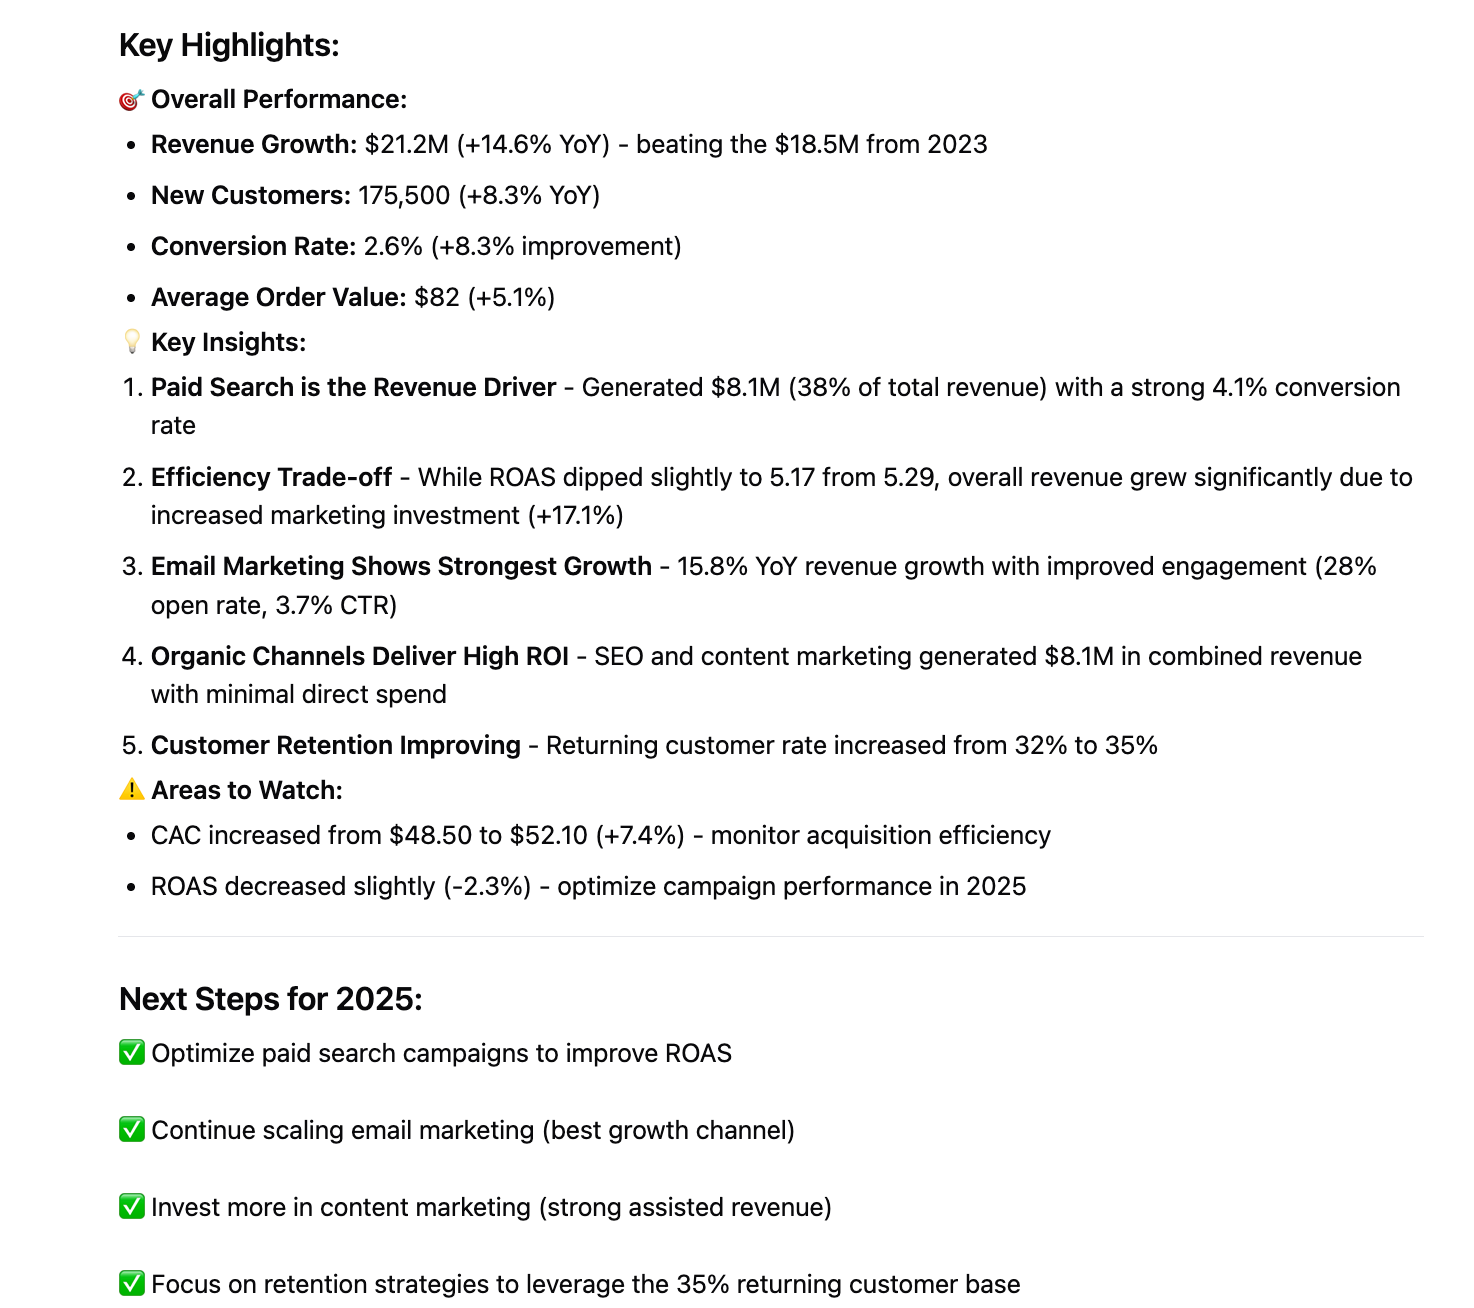
Executive Summary: The 30-Second Pitch
Start with a powerful, one-page summary. This is the most important section for busy executives. It should highlight the year's top achievements, biggest learnings, and key recommendations. If someone only reads this page, they should understand the entire story of your year in marketing.
Review of Previous Year's Goals and KPIs
Begin the detailed analysis by revisiting the goals you set at the start of the year.
Were they achieved? Exceeded? Missed? Present the data clearly and honestly.
This section establishes accountability and provides the foundation for the performance analysis that follows. Choosing the right marketing KPIs at the start of the year makes this section much easier to write.
Comprehensive Performance Analysis by Channel
This is the heart of your report. Break down your performance across all key marketing channels. This includes SEO, paid search, social media, email marketing, and content marketing.
For each channel, report on key metrics, analyze trends, and explain the why behind the results. Effective cross-channel reporting will show how different channels worked together.
Key Learnings: Successes, Failures, and Insights
Data is useless without interpretation. This section is dedicated to the insights you've gained.
What was your most successful campaign and why?
Which experiment failed and what did you learn from it?
Sharing both wins and losses demonstrates a commitment to continuous improvement and builds credibility.
Competitive Landscape Analysis
Your performance doesn't exist in a vacuum. Provide context by briefly analyzing your key competitors.
How did your market share change?
What new strategies did they employ?
This shows that you have a broad understanding of the market and are proactive in your strategic planning.
Looking Ahead: Goals and Strategy for the Next Year
End the report by looking forward. Based on your analysis, propose clear, measurable goals for the upcoming year.
Outline the key strategic initiatives you will undertake to achieve them. This section should also detail the budget and resources required, directly linking back to the value you've proven throughout the report.
Essential Marketing Metrics & KPIs to Track
The metrics you choose to highlight will determine the strength of your report. Focus on metrics that connect directly to business outcomes, not vanity metrics. Group them logically to tell a story about your marketing funnel.
Top-of-Funnel: Website Traffic, Reach, and Brand Awareness
Top-of-funnel metrics measure your ability to attract and reach potential buyers. They signal the health of your demand engine and serve as leading indicators for future pipeline.
Key metrics include:
- Website traffic (YoY growth, net new users, repeat visitors)
- Traffic sources (organic, paid, referral, direct, partner)
- Share of voice and impression share
- Social reach and follower growth
- Content performance (views, scroll depth, time on page)
While TOFU metrics do not translate directly into revenue, they provide essential context about market presence, competitive momentum, and audience expansion.
Mid-Funnel: Lead Generation, Engagement, and Conversion Rates
Mid-funnel metrics evaluate how efficiently you convert attention into actionable interest. They reflect demand quality and the strength of your content, offers, and user journeys.
Representative metrics include:
- Leads generated (by channel, campaign, and segment)
- Cost per lead (CPL)
- Landing page conversion rates
- Marketing-qualified lead (MQL) volume and acceptance rate
- Email performance (open rate, CTR, unsubscribe rate)
- Engagement metrics across paid social, content, and nurture programs
Use this section to identify which acquisition programs performed best, which underperformed, and what optimizations improved conversion throughput.
Bottom-of-Funnel: Customer Acquisition Cost (CAC) and Lifetime Value (LTV)
Bottom-of-funnel metrics tie marketing efforts to revenue and customer growth. This is where marketing’s performance intersects most clearly with sales outcomes.
Core metrics include:
- New customers acquired through marketing
- Customer Acquisition Cost (CAC)
- Customer Lifetime Value (LTV)
- LTV:CAC ratio
- Sales cycle length (marketing-influenced)
A strong LTV:CAC ratio indicates efficient growth and validates your acquisition strategy. This section should demonstrate not just volume but quality, customers acquired at sustainable cost levels and with long-term value potential.
Financial Metrics: Measuring Marketing ROI and Revenue Impact
Financial metrics translate marketing’s performance into the language of executives and finance leaders. They quantify impact in terms the C-suite prioritizes: revenue, efficiency, and return on investment.
Critical metrics include:
- Marketing-sourced revenue
- Marketing-influenced revenue
- Pipeline contribution and velocity
- Incremental lift from specific programs or channels
- Marketing ROI
These metrics form the backbone of any funding request. They allow leadership to see marketing as a driver of financial outcomes, not a discretionary cost.
A Step-by-Step Guide to Building Your Annual Report
With the right process, creating the annual report can be manageable and even enjoyable. Follow these steps for a smooth and effective workflow.
- Define your objectives and audience: Before writing a single word, be clear on what you want the report to achieve. Are you justifying a budget increase? Showcasing a strategic shift? Tailor your narrative and data points to this objective and your primary audience.
- Gather and centralize your marketing data: This is often the most time-consuming step. Pull data from all your platforms: Google Analytics, ad networks, social media tools, CRM, etc. Centralizing all your information into a marketing data warehouse or aggregation platform is the first step towards accurate reporting and can save hundreds of hours. To streamline the process and minimize the likelihood of data errors, use automated tools like Improvado.
- Analyze performance and identify key insights: Look for trends, anomalies, and stories in the data. Compare performance against goals and previous years. Dig deep to understand the "why" behind the numbers. This is where analysis turns into insight.
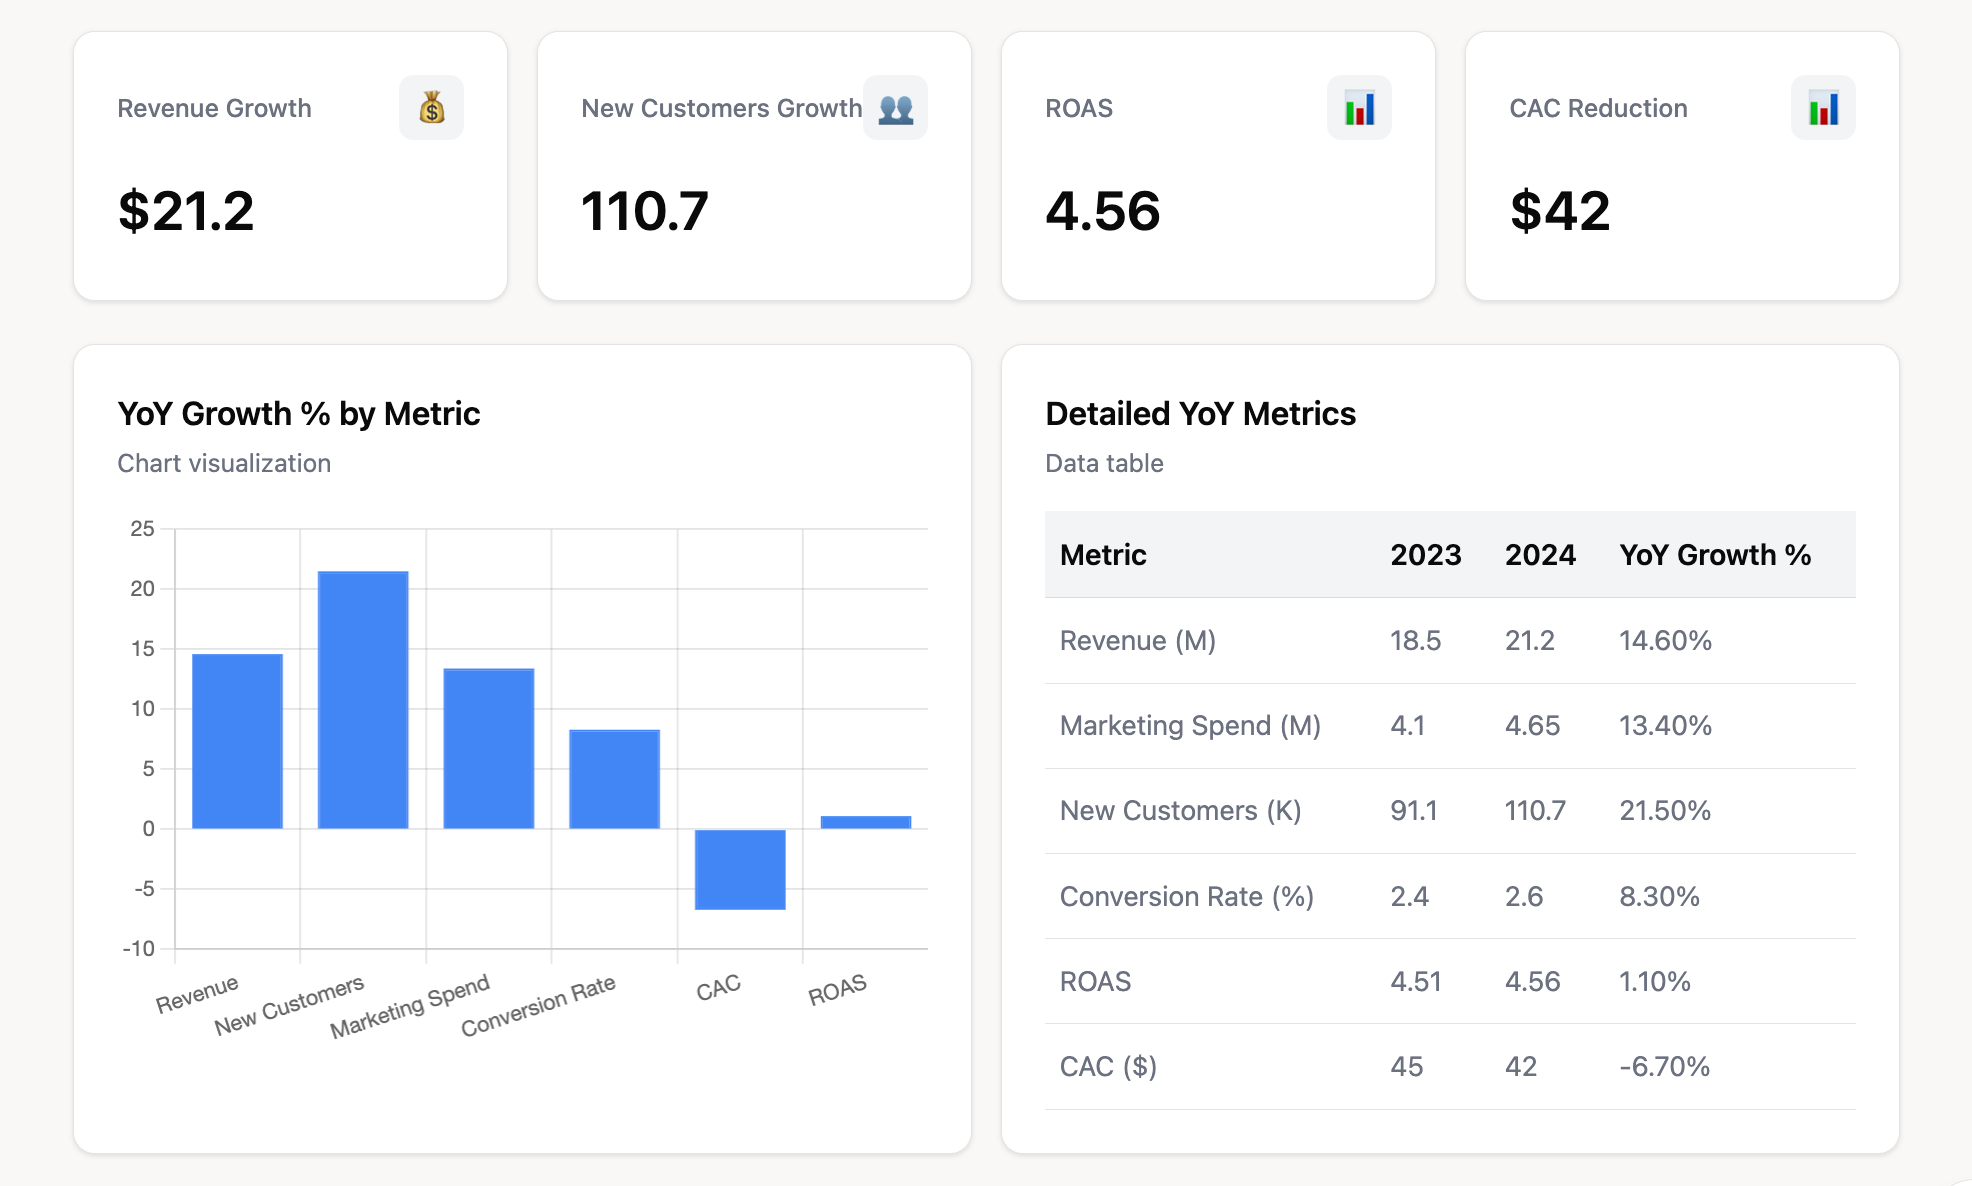
- Structure your narrative and visualize the data: Outline your report using the core components mentioned earlier. Create a logical flow that tells a compelling story. Use charts and graphs to make your data easy to understand. Using powerful data visualization tools makes complex information digestible and impactful.
- Draft the report and solicit feedback: Write the full report, focusing on clear and concise language. Avoid jargon. Share the draft with key stakeholders and members of your team. Their feedback can help clarify points and catch errors before the final version is shared.
- Present your findings with confidence: An annual report is often accompanied by a presentation. Be prepared to walk leadership through the key findings. Use the report as your source of truth and be ready to answer questions about your performance and future plans.
Annual Marketing Report Templates & Examples
Structuring your report is crucial for clarity and impact. While a custom report is best, templates can provide a great starting point. We recommend structuring your thinking around the key questions each section should answer.
The Power of a Structured Narrative
Don't just present data; guide your reader through a story. Start with the big picture, drill down into the details, and conclude with forward-looking actions. This structure ensures your message is received and understood.
| Report Section | Key Question It Answers | Example Metrics | Audience Focus |
|---|---|---|---|
| Executive Summary | What is the one-minute summary of our marketing year? | Overall ROI, Total Revenue Influenced, Top 3 Wins | C-Suite, Board |
| Goal vs. Actuals | Did we do what we said we would do? | % of Goal Achieved for Leads, Traffic, Revenue | Leadership, Marketing Team |
| Channel Performance | Which channels drove the most value and why? | CAC, CPL, Conversion Rate by Channel | Marketing Team, Department Heads |
| Campaign Highlights | What were our most impactful campaigns? | ROI per Campaign, Engagement Metrics, Leads | Entire Company |
| Key Learnings | What did we learn that will make us smarter next year? | A/B Test Results, Failed Experiment Analysis | Marketing Team, Leadership |
| Competitive Analysis | Where do we stand in the market? | Share of Voice, Competitor Campaign Examples | Leadership, Strategy Team |
| Future Strategy / Goals | Where are we going and how will we get there? | Proposed KPIs, Budget Request, Strategic Pillars | C-Suite, Finance |
Common Pitfalls to Avoid in Your Annual Report
Even the most data-rich report can fail if it falls into common traps. Being aware of these pitfalls will help you create a document that is credible, readable, and influential.
Drowning in Vanity Metrics
Avoid focusing on metrics like likes, impressions, or followers without connecting them to business outcomes. While they can indicate reach, they don't prove business value. Always prioritize metrics that relate to leads, customers, and revenue.
Lack of Narrative and Storytelling
A report that is just a collection of charts and numbers is easy to ignore. You must connect the dots for your reader. Explain what the data means. Build a narrative around your successes and challenges. This makes the report engaging and memorable.
Poor Data Visualization and Design
Cluttered charts, inconsistent branding, and walls of text can make your report unreadable. Invest time in clean, clear design. Use graphs that are easy to interpret. Label everything clearly. Good design shows professionalism and respect for your reader's time.
Ignoring the "Why" Behind the Data
Don't just state that website traffic increased by 20%. Explain why it happened. Was it a successful SEO initiative? A viral piece of content? Providing context and analysis is what elevates a report from a summary to a strategic document.
Failing to Connect Efforts to Business Goals
This is the most critical mistake. Every piece of data and analysis in your report should ultimately tie back to a larger business objective. If you can't explain how a marketing activity contributed to the company's bottom line, it shouldn't be a focus of your annual report.
Tools and Technology for Effortless Marketing Reporting
The right technology stack can drastically reduce the time and effort required to create a robust annual report. It can also improve the accuracy and depth of your insights.
Data Analytics Platforms like Improvado
For most enterprise teams, the biggest challenge is not analysis—it’s assembling clean, consistent, and trustworthy data from dozens of disconnected platforms. Manual exports introduce errors, delay insights, and make it nearly impossible to maintain a unified view of performance.
Improvado solves this by automating the entire data preparation layer. It connects to every major marketing, advertising, analytics, and revenue platform and pulls data into a centralized, governed environment.
Improvado enforces consistency across metrics, naming conventions, and entity structures, which is critical for year-over-year reporting and executive visibility. With a unified schema, end-of-year analysis becomes faster and more reliable.
Key features to support annual report building:
- 1,000+ automated data connectors: Pulls data from ads, CRM, web analytics, revenue systems, and offline channels without manual exports.
- Metric normalization and standardization: Ensures that metrics like CPL, ROAS, CAC, and revenue align across platforms and time periods.
- Governed naming conventions and taxonomy enforcement: Provides consistent campaign and channel definitions, enabling accurate year-over-year comparisons.
- Cross-channel data stitching: Links spend, engagement, pipeline contribution, and revenue outcomes under one unified structure.
- Historical data harmonization: Rebuilds multi-year datasets with consistent logic, essential for long-term trend analysis.
- Automated dashboards and executive-ready visualizations: Creates repeatable reporting templates that align with leadership expectations.
- AI Agent for rapid data exploration: Allows marketers to ask natural-language questions and instantly generate insights, summaries, and visualizations for the report.
Improvado reduces the reporting timeline from weeks to days. It ensures every metric in your annual report is auditable, consistent, and tied back to a single source of truth.
Business Intelligence (BI) and Visualization Tools
Tools like Tableau, Looker, or Power BI connect to your data source and allow you to create interactive dashboards and beautiful visualizations. They help you explore your data more deeply and present your findings in a professional, easy-to-understand format.
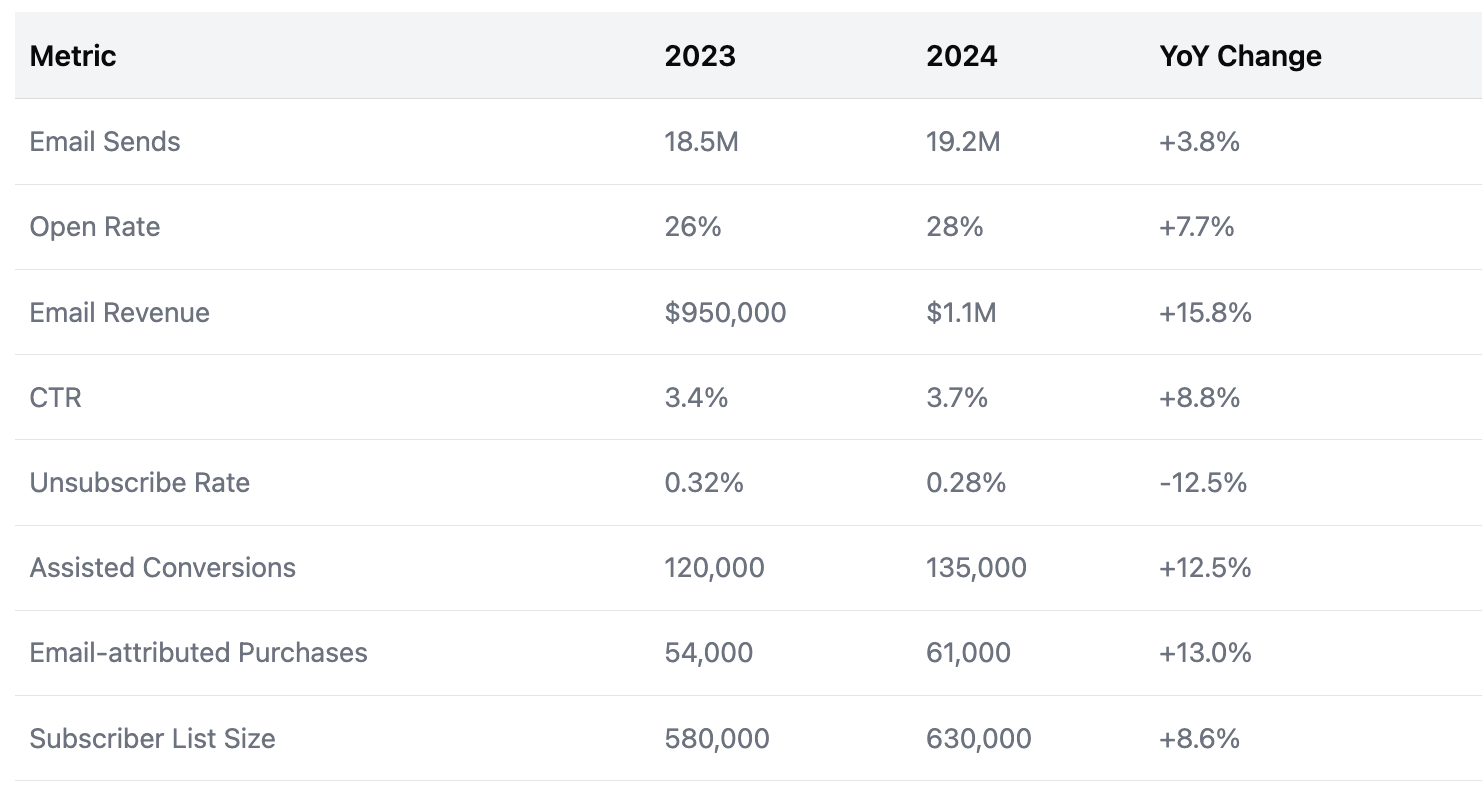
Beyond charts, looking at key content marketing metrics like assisted conversions can reveal hidden value.
Native Platform Analytics (Google Analytics, Ads Dashboards)
Don't forget the analytics tools built into the platforms you use every day. Google Analytics, Google Ads, LinkedIn Campaign Manager, and others are rich sources of data. The challenge is that data is siloed. This is why aggregation platforms are so valuable–they bring all this native data together.
| Aspect | Manual Reporting | Automated Reporting with Improvado |
|---|---|---|
| Data Collection | Hours/days of manual downloads from each platform | Fully automated, continuous data collection and refresh |
| Data Accuracy | High risk of human error (copy-paste mistakes) | Eliminates human error, ensures data integrity |
| Time to Insight | Slow; analysis can't begin until all data is collected | Instant; real-time data allows for ongoing analysis |
| Data Granularity | Often limited to high-level metrics to save time | Deep, granular data available across all channels |
| Scalability | Difficult to scale as more channels are added | Effortlessly scales with your marketing stack |
| Team Focus | Analysts spend 80% of time on data gathering | Analysts spend 80% of time on strategic analysis |
| Report Frequency | Labor-intensive, making frequent reports difficult | Annual, quarterly, and monthly reports are easy to generate |
Leveraging Data for Strategic Future Planning
The final, crucial role of the annual report is to inform the future. It is a bridge between past performance and future strategy. Use the insights you've uncovered to make smarter, more strategic decisions for the year ahead.
Using Past Performance to Forecast Future Outcomes
Your historical data is a powerful forecasting tool. Analyze your conversion rates, sales cycles, and channel performance to create realistic projections for the next year. This data-driven forecasting is far more credible than simple guesswork and will be valued by your leadership team.
Identifying New Market Opportunities
Did your analysis reveal an unexpectedly high-performing customer segment? Or a content topic that drove massive engagement? The annual report can uncover hidden gems and new opportunities for growth that can become central pillars of your next year's strategy.
Optimizing Budgets and Resource Allocation
The report should make it clear which channels and strategies deliver the highest ROI. Use this information to reallocate your budget. Shift funds from underperforming initiatives to those that have proven their value. This ensures your marketing spend is working as hard as possible.
Building a Data-Driven Culture
By consistently producing and sharing a high-quality, data-centric annual report, you help foster a data-driven culture throughout the organization. It sets a standard for accountability and strategic thinking. It shows that marketing decisions are based on evidence, not just intuition.
Conclusion
A well-crafted annual marketing report is a strategic instrument that shapes budgets, guides planning, and demonstrates marketing’s contribution to business growth. It forces teams to align their work with organizational goals, quantify performance, and articulate a clear narrative of progress and opportunity. For leadership, it becomes a single, authoritative view of how marketing drives impact.
The full value of that report, however, depends entirely on the quality of the underlying data. Without accurate, consistent, and unified metrics, even the strongest analysis loses credibility. This is where Improvado provides a critical advantage. By centralizing marketing and revenue data, enforcing governance, and standardizing metrics across every platform, Improvado delivers the reliable data foundation required for high-quality year-end reporting. With accurate, analysis-ready data, teams can produce reports that are trusted, actionable, and strategically meaningful.
If you want to build annual reports on a dependable source of truth, request a demo of Improvado.
“Improvado allows us to have all information in one place for quick action. We can see at a glance if we're on target with spending or if changes are needed—without having to dig into each platform individually.
On the reporting side, we saw a significant amount of time saved! Some of our data sources required lots of manipulation, and now it's automated and done very quickly. Now we save about 80% of time for the team.”

Related reading: Build vs. Buy Data Pipeline: The 2026 Decision Guide for ROI, White Label Marketing Reports: Agency Guide (2026), 8 Best Wicked Reports Alternatives for Attribution (2026)

