
More product research now starts on YouTube than on any other social platform, and every algorithmic shift changes what gets visibility, engagement, and conversion potential. The difference between channels that grow and those that plateau lies in how precisely teams track and interpret the signals that actually drive discovery and audience retention.
This guide walks through 15 YouTube Analytics metrics that truly matter in 2026, helping you understand where your channel wins, where it loses viewers, and how to turn performance data into sustained reach, watch time, and ROI.
Key Takeaways
- YouTube Analytics is a free, built-in tool that provides deep insights into video performance, audience behavior, and revenue trends.
- The 15 key metrics – including watch time, CTR, audience retention, and subscriber growth – form the foundation for data-driven channel optimization.
- Understanding traffic sources and audience demographics enables targeted content strategies that attract and retain the right viewers.
- Advanced features like Research Tab and Advanced Mode help uncover keyword opportunities and performance patterns for faster growth.
- Integrating YouTube data with other marketing platforms through solutions like Improvado provides a unified view of ROI across channels.
Quick answer
To use YouTube Analytics, log into your YouTube account, click your profile picture, select YouTube Studio, then click Analytics in the left menu. The dashboard displays key metrics across five tabs: Overview (views, watch time, subscribers), Content (impressions, CTR, traffic sources), Audience (demographics, viewing patterns), Revenue (earnings for monetized channels), and Research (search trends and content gaps).
What Is YouTube Analytics and Why is it Important?
Optimize Channel Growth with Data Insights
By diving deep into your analytics, you can uncover trends, identify successful content formats, and understand viewer behavior patterns. This insight is crucial for optimizing your content strategy, leading to more views, higher engagement, and consistent subscriber growth.
Understand Which Content is Winning
Analytics exposes not just what performs well, but why. Metrics like average view duration, CTR, and engagement rate help pinpoint which storytelling formats and hooks drive meaningful audience response. With this insight, you can refine production priorities, double down on proven frameworks, and continuously replicate high-performing content with confidence.
Attract Your Target Audience Demographics
Knowing who’s watching—and how they find your videos—unlocks smarter targeting. Demographic and interest reports reveal your highest-value segments, while traffic source data clarifies how they enter your funnel. This precision allows you to tailor content and distribution strategies that attract the right audience and deepen brand affinity.
Guide Your Overall Video Marketing Strategy
For businesses, YouTube is a powerful marketing channel. Analytics provides the data needed to evaluate campaign effectiveness, measure return on investment (ROI), and refine your broader video marketing strategy. It helps you justify spend and demonstrate tangible results to stakeholders.
How to Access YouTube Analytics
Accessing your YouTube Analytics is straightforward, whether you're on a desktop or using a mobile device.
Accessing on Desktop (YouTube Studio)
To access YouTube Analytics on your computer, log in to your YouTube account.
- Click on your profile picture in the top right corner.
- Select 'YouTube Studio' from the dropdown menu.
- In the left-hand menu, click 'Analytics'.
This will take you to your main analytics dashboard, showcasing an overview of your channel's performance.
Accessing on Mobile (YouTube Studio App)
For on-the-go insights, download the YouTube Studio app on your smartphone or tablet.
- Open the YouTube Studio app.
- Log in with your YouTube account.
- Tap 'Analytics' from the bottom menu or the left-hand menu (depending on the app version).
The mobile app provides a convenient way to monitor your latest video performance and channel statistics from anywhere.
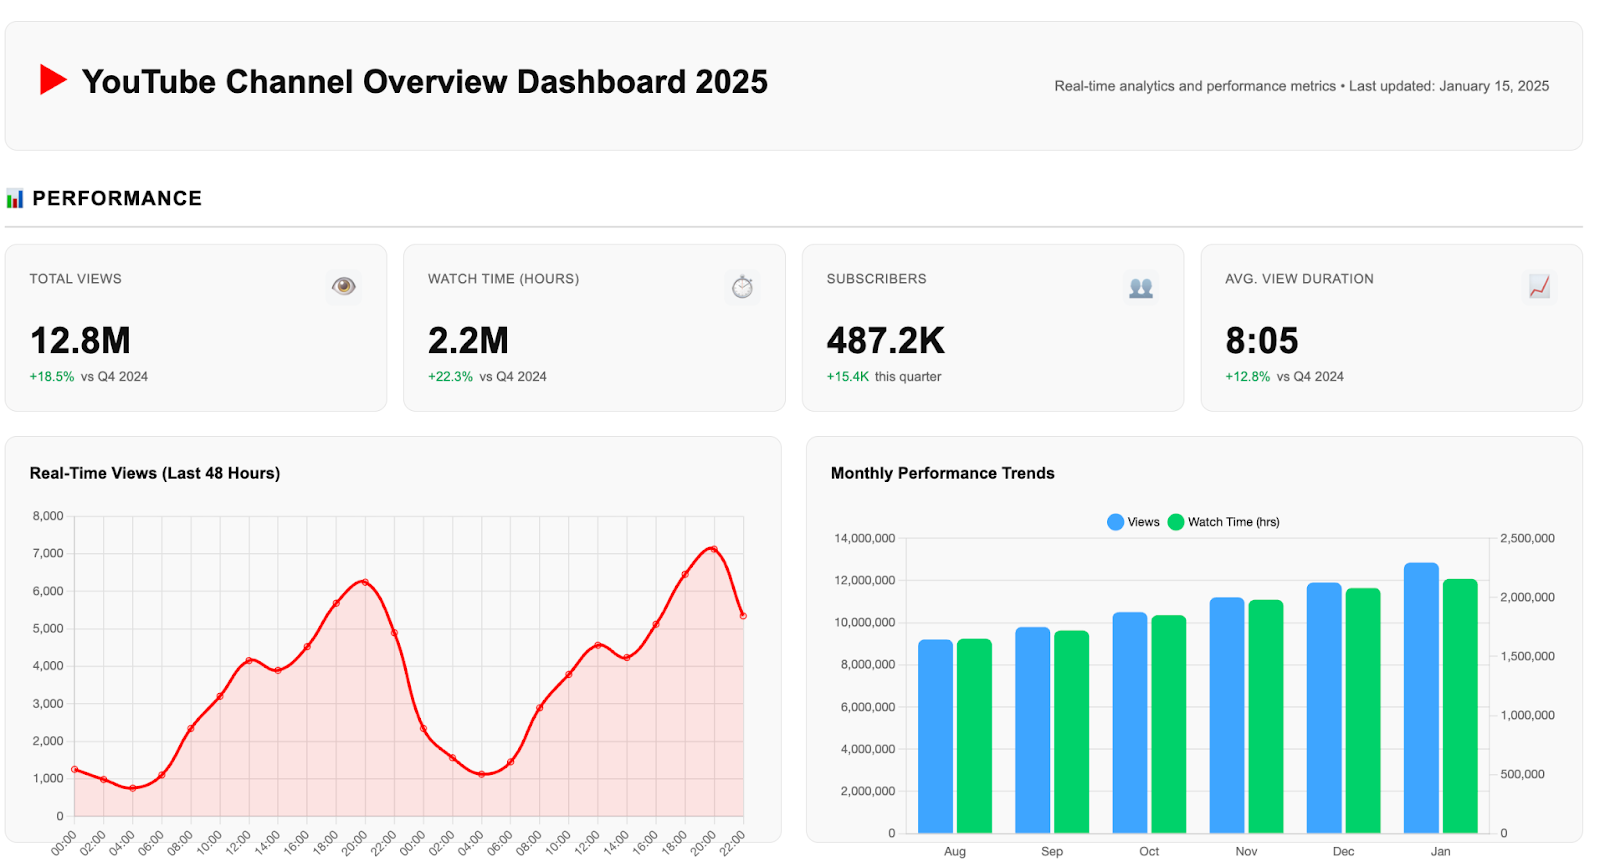
Understanding the Main Dashboard
Upon entering YouTube Analytics, you'll typically land on an 'Overview' dashboard. This initial view provides a snapshot of your channel's recent performance, including key metrics like views, watch time, and subscribers over a selected period. It also often highlights your top-performing videos and real-time activity.
Understanding Key Metrics in the YouTube Analytics Tabs
YouTube Analytics organizes its vast amount of data into several intuitive tabs, each offering a unique perspective on your channel and content performance.
1. The Overview Tab
This section provides a summary of your channel's performance, offering a quick glance at essential metrics.
Key Metrics: Views, Watch Time, Subscribers
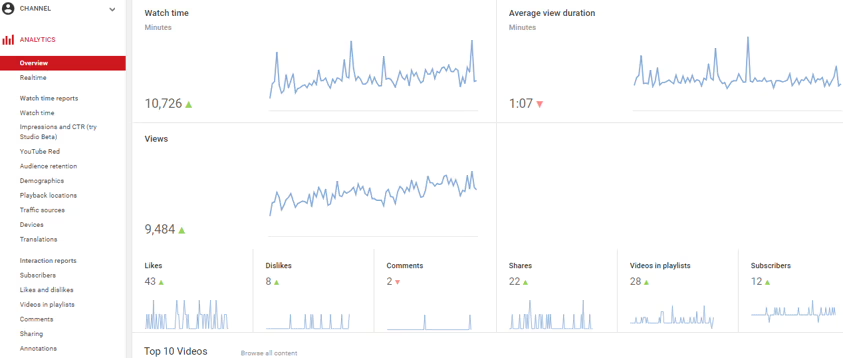
- Views: This metric gives you the number of times people have come to your channel and watched it in a selected period. The minimum time of the video depends on the length of the video. Generally, 30 seconds is considered the standard minimum view.
- Watch time: The watch time gives an aggregate figure that shows the total number of hours for which viewers have watched your channel.
- Subscribers: The subscribers metric is calculated by subtracting the number of subscribers lost from the number of subscribers gained.
- Real-time views: This metric shows the number of people who have watched your video in the last 48 hours. This data keeps updating in real-time.
- Top videos: The overview tab also shows your best performing videos so far.
Real-Time Performance
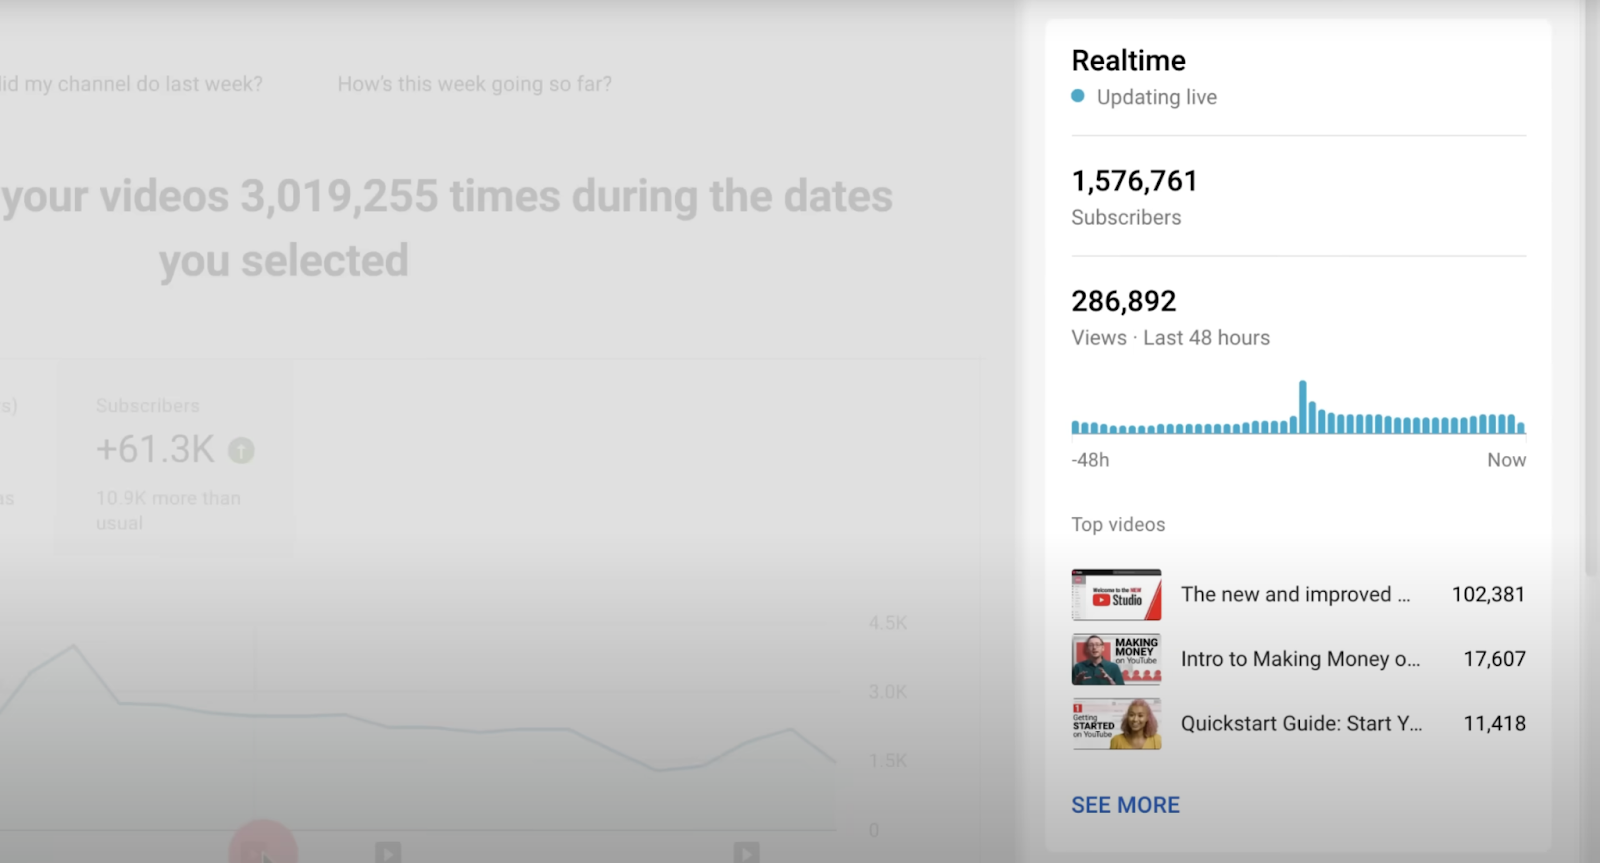
The 'Real-time' report shows the number of views your videos have accumulated in the last 48 hours and the last 60 minutes. This provides immediate feedback on new uploads or trending content.
For new uploads, this report helps assess how effectively the video is being surfaced in recommendations, notifications, and external shares during its critical first exposure window. For ongoing or older videos, it helps spot re-emerging interest—often tied to changes in search demand or algorithmic promotion.
Beyond simple view counts, the Real-Time report can be cross-referenced with traffic source and geography data to determine where momentum is coming from (for example, a spike in external referrals vs. Browse Features). Monitoring these trends in near real-time allows teams to adjust promotion tactics, test thumbnail or title variants quickly, and make data-backed decisions on paid amplification while audience interest is at its peak.
Typical Performance
This feature offers a benchmark, showing how your latest videos compare to your typical performance within the first few hours or days after publishing, helping you identify immediate successes or areas for improvement.
2. The Content Tab
The 'Content' tab (formerly part of 'Reach' and 'Engagement') provides detailed information on how your videos, Shorts, and Live streams are discovered and interacted with.
Impressions and Click-Through Rate (CTR)
- Impressions: The number of times your video thumbnails were shown to viewers on YouTube (e.g., on the homepage, in search results, or in the 'Up Next' section).
- Impressions click-through rate: The percentage of impressions that resulted in a viewer clicking on your video and watching it. A high CTR indicates that your titles and thumbnails are compelling.
Traffic Sources: How Viewers Find You
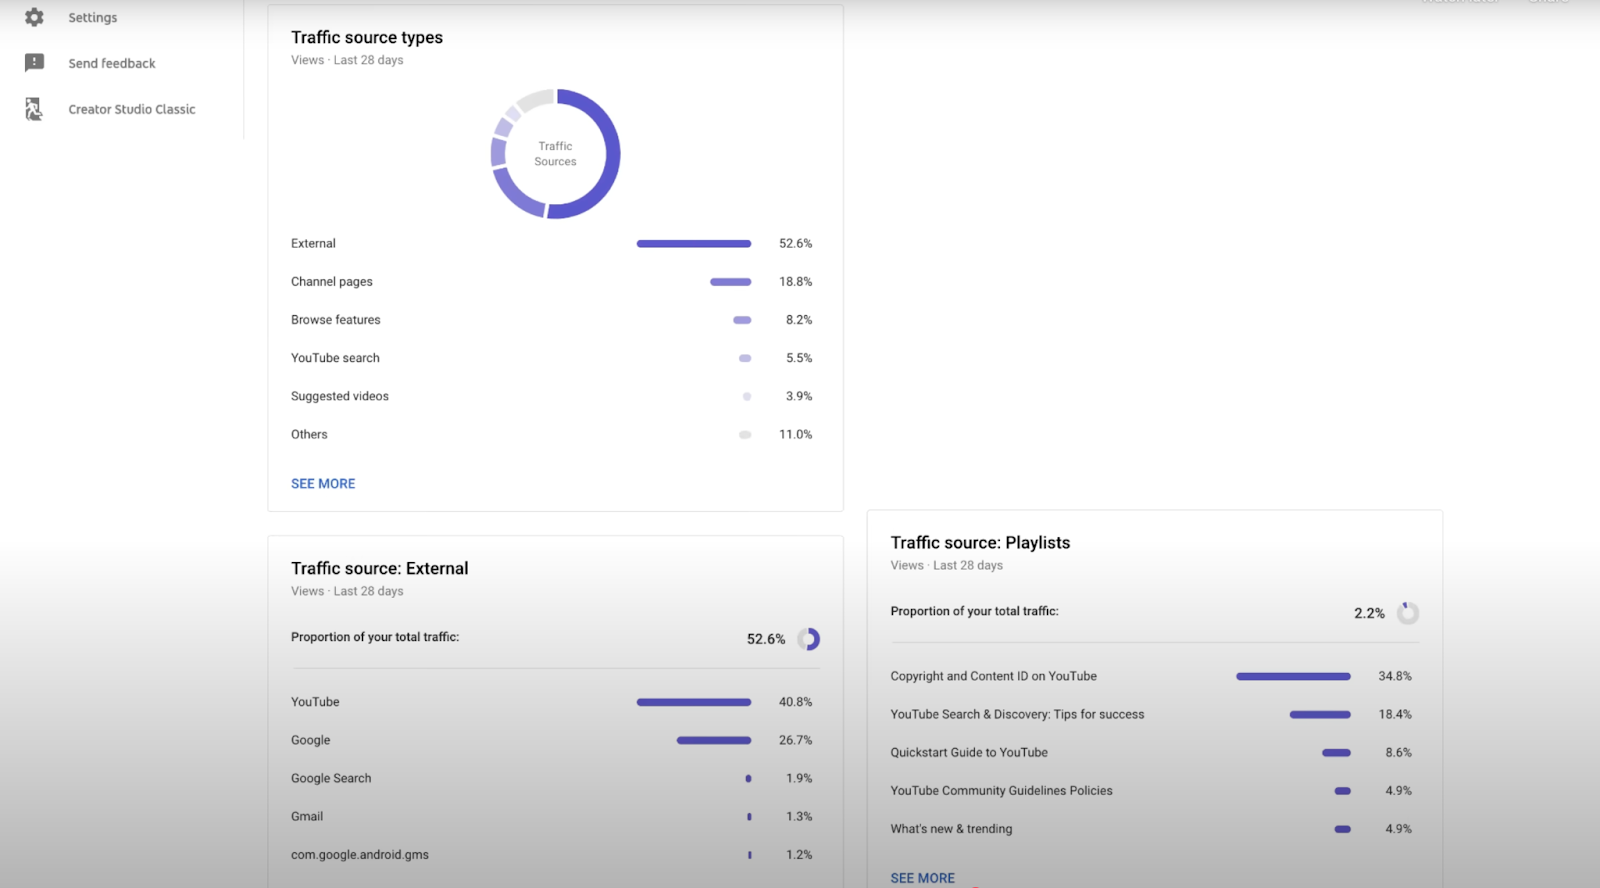
This section breaks down where your views are coming from. Common traffic sources include:
- YouTube Search: Viewers finding your videos through search queries.
- Browse Features: Views from the homepage, subscription feed, or 'Watch Later'.
- Suggested Videos: Views from videos recommended alongside or after other videos.
- External: Views from outside YouTube (e.g., social media, embedded players).
Top Performing Videos & Shorts
This report highlights your best-performing individual videos, Shorts, and Live streams based on views, watch time, or other engagement metrics. This helps identify content that resonates most effectively with your audience.
3. The Audience Tab
This section helps you understand your viewers better, revealing insights into their behavior and demographics.
Returning vs. New Viewers & Unique Viewers
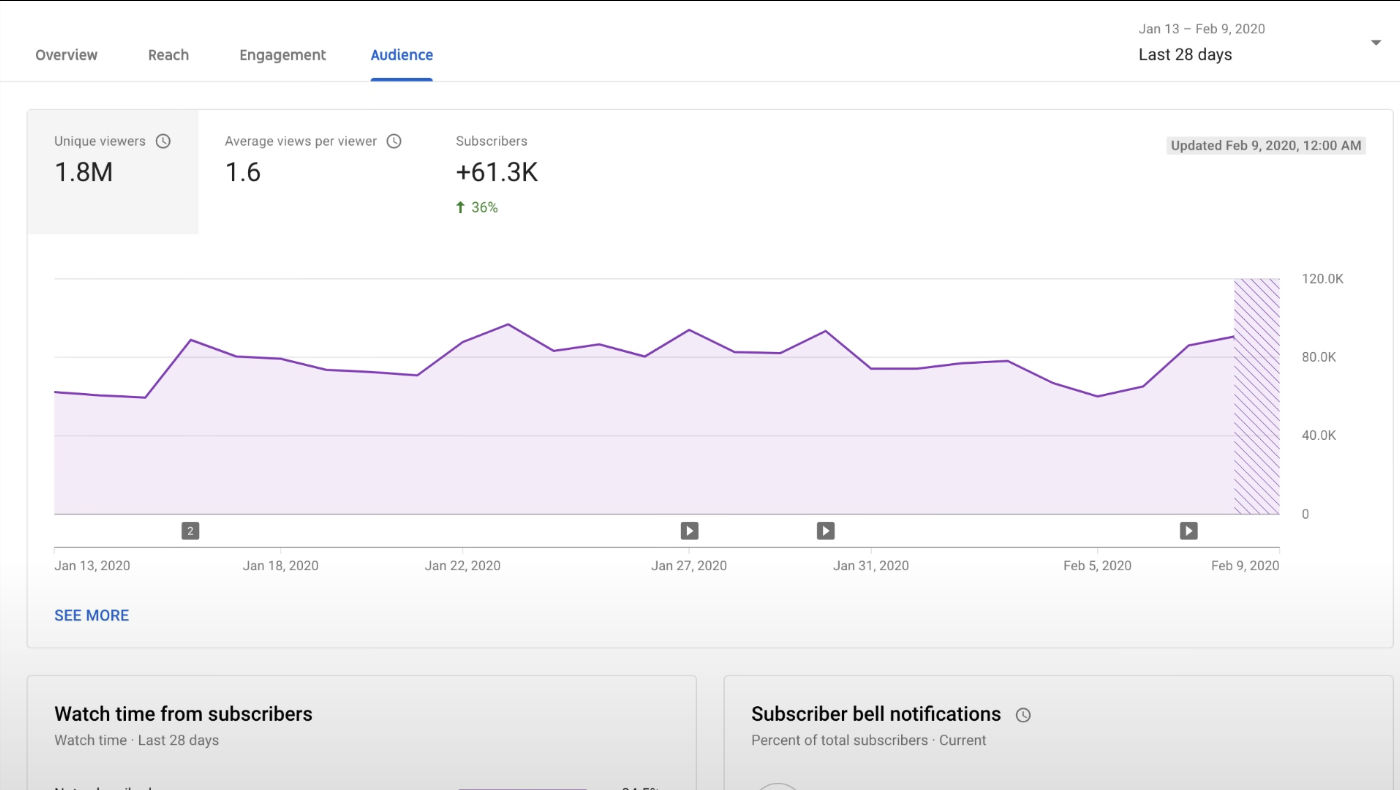
- New viewers: Individuals who watched your channel for the first time within the selected period.
- Returning viewers: Viewers who have watched content on your channel before and returned during the selected period. A healthy balance indicates both growth and loyalty.
- Unique viewers: The total number of individual viewers who have watched your videos, regardless of how many times they watched.
Key Demographics: Age, Gender, and Geography
This data provides a breakdown of your audience by age, gender, and the top countries or regions they are watching from. This is vital for tailoring content, language, and promotional efforts.
When Your Viewers Are on YouTube
This report visualizes audience activity patterns across days of the week and hours of the day, showing when your viewers are most active on the platform, not just on your channel. Each cell in the graph represents aggregated viewer presence, helping identify optimal publishing and promotion windows.
It helps align your publishing cadence with audience behavior, ensuring new videos enter the recommendation cycle when viewers are most likely to see and engage with them. For example, posting just before a known activity peak can improve click-through rates and early watch-time signals, both of which influence how the algorithm promotes content.
4. The Revenue Tab
For monetized channels, the 'Revenue' tab provides a transparent look at your earnings.
Estimated Revenue and RPM
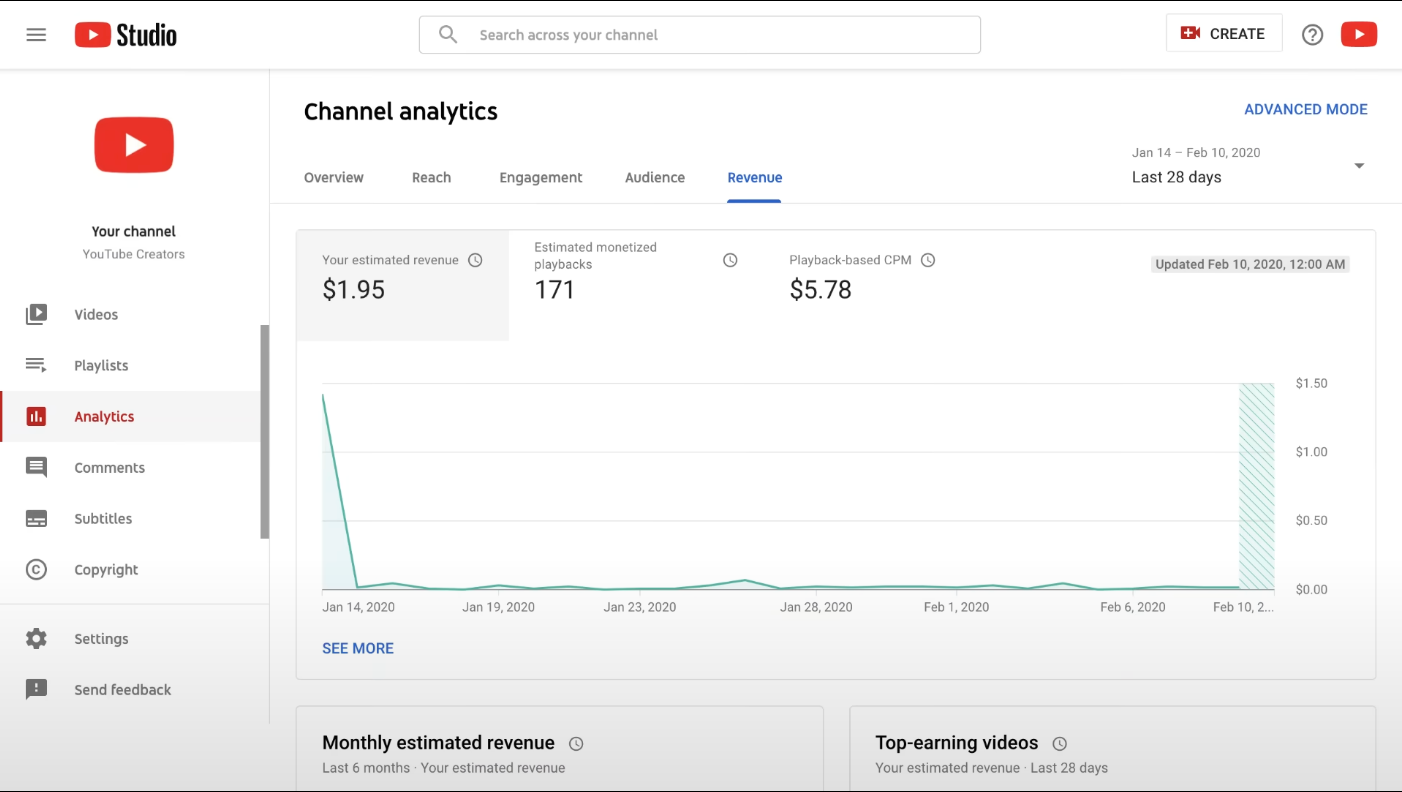
- Estimated Revenue: Your total estimated earnings from YouTube within the selected period.
- Revenue per thousand impressions (RPM): The amount earned per 1,000 video views. This metric helps understand your overall monetization efficiency.
Top-Earning Content
The Top-Earning Content report ranks videos by total revenue, revealing which specific uploads, topics, or formats generate the highest financial return. This report helps diagnose what drives monetization, whether it’s longer average view durations that allow for more ad placements, higher CPM categories, or strong engagement that attracts premium advertisers.
Revenue Sources
This report details the composition of your total channel revenue across different income streams, including ad types (skippable, non-skippable, and bumper ads), YouTube Premium payouts, Channel Memberships, Super Chat, and merchandise. Each source reflects a distinct viewer interaction model: ads depend on impressions and retention, while memberships and Super Chats indicate deeper audience loyalty and engagement.
By breaking down revenue sources, you can assess the stability and scalability of your monetization mix.
5. The Research Tab
A newer addition to YouTube Analytics, the 'Research' tab helps creators understand what their audience and broader YouTube viewers are searching for.
Exploring What Your Audience is Searching For
This section provides insights into search terms used by your audience and general YouTube users related to your content or industry. It's an invaluable tool for content ideation and keyword targeting.
Identifying Content Gaps
By seeing popular search queries that you might not have covered yet, you can identify content gaps and create videos that directly address viewer demand, boosting discoverability.
6. Watch Time
Watch Time is one of the most heavily weighted signals in YouTube's ranking algorithm, representing the total cumulative minutes viewers spend watching your content across a given period.
Why Watch Time Drives Algorithmic Visibility
YouTube's recommendation engine prioritizes channels and videos that keep viewers on the platform longer. A high aggregate Watch Time tells the algorithm that your content is genuinely valuable, which directly influences how often your videos appear in Browse Features, Suggested Videos, and the Home feed. Channels that consistently grow their Watch Time tend to see compounding discoverability gains over time.
Where to Find It
In YouTube Studio, navigate to Analytics and select the Overview tab. The Watch Time card displays total hours for your selected date range. You can drill deeper by switching to the Content tab, which breaks Watch Time down by individual video, Shorts, live streams, and posts — allowing you to compare formats side by side.
How to Interpret Watch Time Data
- Absolute Watch Time: The raw total of hours watched. Use this to benchmark channel health month over month and year over year.
- Watch Time by Traffic Source: Segmenting Watch Time by source (Search, Browse, Suggested, External) reveals which discovery channels deliver the most engaged viewers, not just the most clicks.
- Watch Time by Geography: Identifying which regions contribute the most Watch Time helps inform upload scheduling, language considerations, and regional content opportunities.
Actionable Optimization Strategies
To grow Watch Time, focus on strong opening hooks that reduce early drop-off, strategic use of chapters to help viewers navigate longer content, and end-screen playlists that encourage session continuation. Analyzing which video lengths correlate with the highest Watch Time for your specific audience — rather than applying a universal rule — yields more reliable results. Comparing Watch Time trends against publishing cadence also helps teams determine whether posting frequency is helping or diluting overall performance.
7. Average View Duration
Average View Duration (AVD) measures the mean length of time a viewer watches a single video before leaving, expressed in minutes and seconds. It is one of the clearest indicators of content quality and pacing at the individual video level.
The Difference Between Watch Time and Average View Duration
While Watch Time reflects channel-wide volume, Average View Duration isolates per-video engagement depth. A video with 10,000 views and a 7-minute AVD on a 10-minute video is performing very differently from one with 10,000 views and a 2-minute AVD — even though both contribute the same view count. AVD is the metric that reveals whether viewers are genuinely consuming your content or abandoning it early.
Where to Find It
In YouTube Studio Analytics, open the Content tab and select any individual video. The Overview panel for that video displays Average View Duration alongside Impressions, CTR, and Views. You can also add AVD as a column in the Content tab's sortable table to rank all videos by this metric simultaneously.
Benchmarking Average View Duration
- Percentage Viewed: YouTube also expresses AVD as a percentage of total video length. A 50% or higher percentage viewed is generally considered strong, though benchmarks vary significantly by niche and video length.
- Format Comparison: Shorts, long-form videos, and live streams have fundamentally different AVD norms. Always compare like formats against each other rather than across categories.
- Trend Over Time: A declining AVD on a historically strong video may indicate that the audience discovering it through search or suggestions has shifted, signaling a need to revisit the title, thumbnail, or intro.
Improving Average View Duration
The most effective levers for improving AVD are front-loading value in the first 30 seconds, eliminating slow introductions, using pattern interrupts (b-roll, graphics, tonal shifts) to re-engage attention mid-video, and structuring content with clear narrative progression. Reviewing the Audience Retention curve alongside AVD pinpoints the exact timestamps where viewers disengage, making optimization targeted rather than speculative.
8. Audience Retention Curve
The Audience Retention Curve is a video-level graph that plots the percentage of viewers still watching at every second of a video's runtime. It is one of the most diagnostically powerful reports in YouTube Analytics because it transforms abstract engagement data into a precise, visual map of viewer behavior.
Reading the Retention Curve
The curve begins at 100% at the zero-second mark and typically declines as the video progresses. The shape of that decline tells a detailed story:
- Steep early drop-off: Viewers are clicking away within the first 15–30 seconds, suggesting the intro fails to deliver on the promise made by the title and thumbnail.
- Gradual, steady decline: Normal viewer attrition. The content is holding attention reasonably well throughout.
- Sharp mid-video dips: Specific segments are losing viewers rapidly — often a sign of pacing issues, tangential content, or a topic transition that doesn't land.
- Spikes (re-watches): Sections where the curve rises above the surrounding baseline indicate viewers are rewinding and re-watching, a strong signal of high-value content worth amplifying in future videos.
Where to Find It
In YouTube Studio, navigate to Analytics, select the Content tab, click on an individual video, and then choose the Engagement tab. The Audience Retention graph appears here alongside the video player, allowing you to click any point on the curve and jump directly to that timestamp in the video for immediate context.
Absolute vs. Relative Retention
YouTube offers two retention views. Absolute Retention shows the raw percentage of viewers watching at each moment. Relative Retention compares your video's retention to other YouTube videos of similar length, providing a normalized benchmark that accounts for the natural tendency of longer videos to have lower absolute retention rates.
Turning Retention Data Into Content Decisions
Systematically reviewing retention curves across your top 10–20 videos reveals patterns: which intro styles retain viewers best, which segment lengths cause fatigue, and which content formats sustain attention to the end. These patterns should directly inform scripting, editing, and structural decisions for future productions.
9. Impressions Click-Through Rate (CTR)
Impressions Click-Through Rate measures the percentage of times your video's thumbnail was shown to a viewer on YouTube — in search results, the Home feed, Suggested Videos, or Browse Features — that resulted in an actual click. It is the primary metric for evaluating the effectiveness of your titles and thumbnails as a combined unit.
How CTR Is Calculated
CTR = (Clicks ÷ Impressions) × 100. An impression is counted each time a thumbnail is shown for more than one second and at least 50% of the thumbnail is visible on screen. YouTube's own data suggests that most channels see CTRs ranging from 2% to 10%, with newer or smaller channels sometimes seeing higher rates due to a more targeted initial audience.
Where to Find It
In YouTube Studio Analytics, CTR appears on the Overview tab as a channel-level metric and on the Reach tab for individual videos. The Reach tab also shows the funnel from Impressions to Views to Watch Time, making it easy to see where the conversion breaks down.
Interpreting CTR in Context
- CTR alone is not sufficient: A very high CTR paired with low Average View Duration suggests the title or thumbnail is misleading — viewers click but leave quickly, which can negatively impact algorithmic distribution.
- CTR varies by placement: YouTube breaks down CTR by traffic source. CTR from Browse Features reflects thumbnail appeal to cold audiences, while CTR from Subscriptions reflects loyalty. These should be analyzed separately.
- CTR declines over time: As a video ages and reaches broader, less targeted audiences, CTR naturally decreases. Comparing CTR in the first 48 hours versus the first 30 days provides a more accurate picture of thumbnail performance.
Optimizing for CTR
A/B testing thumbnails using YouTube's built-in Test and Compare feature (available to eligible channels) is the most reliable method for improving CTR. Beyond testing, ensuring visual contrast, clear focal points, minimal text, and emotional resonance in thumbnails — combined with titles that create curiosity or communicate clear value — consistently drives CTR improvements across content categories.
10. Traffic Sources
The Traffic Sources report in YouTube Analytics identifies exactly how viewers are discovering and arriving at your videos. Understanding the composition of your traffic is essential for diagnosing discoverability strengths, identifying algorithmic dependencies, and building a more resilient distribution strategy.
The Main Traffic Source Categories
- YouTube Search: Viewers who found your video by typing a query into YouTube's search bar. High search traffic indicates strong SEO alignment between your titles, descriptions, and viewer intent.
- Browse Features: Traffic from the YouTube Home feed and the Subscriptions feed. This source reflects how well the algorithm is recommending your content to both subscribers and non-subscribers.
- Suggested Videos: Views generated when your video appears in the "Up Next" panel or as a recommendation alongside another video. Strong suggested traffic signals that YouTube's algorithm associates your content with popular videos in your niche.
- External: Traffic arriving from outside YouTube — embedded players on websites, social media shares, email links, and direct URLs. This source reflects the effectiveness of your off-platform promotion.
- Playlists: Views generated when a viewer is watching a playlist that includes your video, either one you created or one curated by another channel.
- Notifications: Views from subscribers who clicked a bell notification when your video was published. This is a direct measure of subscriber engagement quality.
Where to Find It
In YouTube Studio Analytics, navigate to the Reach tab for channel-level traffic source data, or open an individual video's analytics and select the Reach tab to see source breakdowns specific to that upload.
Strategic Implications
Channels that are overly dependent on a single traffic source — particularly Browse Features — are vulnerable to algorithmic shifts. A healthy traffic mix that includes meaningful contributions from Search, Suggested, and External sources creates more stable, predictable growth. Teams should use traffic source data to decide where to invest optimization effort: low search traffic may indicate an SEO gap, while low suggested traffic may point to a need for stronger topical clustering within the channel's content library.
11. Subscriber Growth Rate
Subscriber Growth Rate tracks the velocity at which your channel is gaining net new subscribers over a defined period, accounting for both new subscriptions and unsubscribes. It is a key indicator of overall channel health, content-audience fit, and the long-term sustainability of your viewership base.
Net Subscribers vs. Gross Subscribers
YouTube Analytics reports net subscriber change — the difference between new subscribers gained and subscribers lost within a period. This distinction matters because a channel can gain 5,000 new subscribers while losing 4,800, resulting in a net gain of only 200. Monitoring both gross gains and unsubscribe rates separately provides a more complete picture of audience sentiment and content alignment.
Where to Find It
In YouTube Studio Analytics, the Subscribers card appears on the Overview tab. For deeper analysis, navigate to the Audience tab, which displays a Subscribers Over Time graph and a breakdown of which specific videos drove the most subscriptions and which drove the most unsubscribes within the selected date range.
Interpreting Subscriber Data by Video
- Top subscription-driving videos: These videos are converting casual viewers into committed followers. Analyze what they have in common — topic, format, length, or call-to-action placement — and replicate those elements.
- Top unsubscribe-driving videos: Videos that generate disproportionate unsubscribes often signal a mismatch between the content and existing subscriber expectations. This is particularly common when channels experiment with new formats or topics without adequate audience preparation.
- Subscriber growth by traffic source: Understanding whether subscribers are coming primarily from Search, Browse, or Suggested Videos helps teams assess whether growth is driven by algorithmic reach or direct audience intent.
Growth Rate vs. Absolute Count
For B2B teams benchmarking channel performance, percentage growth rate is more meaningful than raw subscriber counts, particularly for newer or niche channels. A channel growing at 15% month-over-month from a base of 2,000 subscribers is outperforming a channel adding 500 subscribers per month from a base of 100,000. Tracking rate alongside absolute numbers provides the full context needed for accurate performance assessment and goal-setting.
12. Viewer Demographics
The Viewer Demographics report in YouTube Analytics provides a breakdown of your audience by age group, gender, and geography. For B2B marketing teams, this data is foundational to validating whether the channel is reaching its intended buyer personas and informing content, language, and scheduling decisions.
What Demographics Data Includes
- Age and Gender: YouTube segments viewers into age brackets (13–17, 18–24, 25–34, 35–44, 45–54, 55–64, 65+) and reports the gender split within your audience. This data is based on signed-in viewers who have provided this information to Google.
- Geography: The Countries report shows which nations your viewers are located in, ranked by views or Watch Time. A separate Regions breakdown is available for larger markets.
- Device Type: While technically a separate report, device breakdown (mobile, desktop, tablet, TV) is closely related to demographics and informs decisions about caption readability, on-screen text size, and video pacing.
Where to Find It
In YouTube Studio Analytics, navigate to the Audience tab. The age and gender charts appear here alongside other audience composition data. Geography data is accessible by scrolling down within the same tab or by selecting Geography as a dimension in the Advanced Mode view.
Applying Demographics to Content Strategy
If your target buyer persona is a 35–54-year-old enterprise decision-maker but your demographics skew heavily toward 18–24-year-olds, there is a fundamental audience-content mismatch that requires strategic correction — either through topic repositioning, distribution channel adjustments, or both. Conversely, discovering that a significant portion of your audience is located in a geography you haven't explicitly targeted may reveal an untapped market worth pursuing with localized content or subtitles.
Limitations to Understand
Demographics data in YouTube Analytics only reflects signed-in viewers who have shared their information with Google. Viewers watching without a Google account or through embedded players may not be captured, meaning the data represents a sample rather than a complete census of your audience. Teams should treat demographic insights as directional rather than definitive, and triangulate with first-party data from CRM or marketing automation platforms where possible.
13. Unique Viewers
Unique Viewers is a reach metric that estimates the number of distinct individuals who watched your content within a selected time period, regardless of how many times they watched. It is the clearest measure of your channel's true audience size and is distinct from raw view counts, which can be inflated by repeat watches from the same person.
Unique Viewers vs. Views vs. Subscribers
These three metrics measure fundamentally different things and are frequently confused:
- Views: The total number of times your videos were watched, including multiple views from the same person. A single highly engaged viewer who watches a video five times contributes five views but only one Unique Viewer.
- Subscribers: The number of people who have chosen to follow your channel. Subscribers represent intent and loyalty, but many subscribers never watch a given video, and many viewers watch without subscribing.
- Unique Viewers: The estimated count of distinct individuals who actually watched, regardless of subscription status or repeat viewing. This is the most accurate proxy for real audience reach within a period.
Where to Find It
In YouTube Studio Analytics, Unique Viewers appears on the Audience tab. It is displayed alongside the Views per Unique Viewer metric, which shows how many times, on average, each individual viewer watched your content in the selected period — a useful indicator of content stickiness and repeat engagement.
Using Unique Viewers for Strategic Planning
For B2B teams reporting on channel performance to stakeholders, Unique Viewers is often a more credible reach metric than raw views because it eliminates the distortion of repeat watches. Tracking Unique Viewers month over month reveals whether the channel is genuinely expanding its audience or simply deepening engagement with an existing, static group. Both outcomes have value, but they call for different strategic responses: flat Unique Viewers with high Views per Unique Viewer suggests strong loyalty but limited new audience acquisition, pointing toward a need for broader distribution or top-of-funnel content investment.
Data Estimation and Limitations
YouTube estimates Unique Viewers using statistical modeling rather than exact counting, particularly for signed-out viewers and those watching across multiple devices. The metric is most reliable when analyzed as a trend over time rather than as a precise absolute figure for any single reporting period.
14. Comments, Likes, and Shares
Engagement metrics like comments, likes, and shares are among the most direct signals of how deeply your content resonates with viewers — and they carry meaningful weight in YouTube's algorithm.
Why Engagement Signals Matter
YouTube's recommendation engine treats engagement as a proxy for content quality. When viewers take the extra step to like, comment, or share a video, they signal active investment rather than passive consumption. Channels with consistently high engagement rates tend to receive broader algorithmic distribution, as YouTube interprets these actions as evidence that the content is worth surfacing to new audiences.
- Likes: A quick, low-friction signal of approval. While a single like carries modest weight individually, the like-to-view ratio across your catalog reveals how reliably your content earns positive sentiment. A declining ratio on newer uploads can indicate audience fatigue or a mismatch between thumbnail promises and actual content delivery.
- Comments: The richest qualitative data source inside YouTube Analytics. Comment volume and sentiment reveal what topics spark conversation, what questions go unanswered, and what pain points your audience brings to your content. High comment counts also extend a video's algorithmic lifespan, as ongoing discussion signals continued relevance.
- Shares: The highest-intent engagement action. When a viewer shares your video to another platform, a messaging app, or a community, they are effectively endorsing your content to a new audience at zero cost to you. Share data inside YouTube Analytics helps identify which videos have genuine word-of-mouth potential and which formats travel well beyond the platform.
Reading Engagement in Context
Engagement metrics should never be read in isolation. A video with 500,000 views and 200 comments tells a very different story depending on whether those comments are substantive questions, repeat viewers sharing experiences, or spam. Cross-referencing engagement data with audience retention curves helps determine whether high comment volume correlates with specific moments in the video — a controversial claim, a call to action, or a particularly useful segment — giving you a repeatable formula for driving interaction.
Turning Engagement Data Into Content Strategy
Sort your top videos by comment count and look for recurring themes in the questions and reactions. These patterns are a direct editorial brief from your audience, revealing the follow-up videos, deeper dives, and format experiments most likely to sustain loyalty and grow your subscriber base organically.
15. Revenue per Mille (RPM) and Estimated Revenue
For monetized channels, RPM and Estimated Revenue are the two metrics that translate all other performance data into tangible financial outcomes — making them essential for any B2B team evaluating YouTube as a revenue-generating channel.
Understanding RPM vs. CPM
A common source of confusion in YouTube Analytics is the distinction between RPM and CPM (Cost per Mille). CPM reflects what advertisers pay per 1,000 ad impressions and is set by the advertising market. RPM, by contrast, measures how much revenue your channel actually earns per 1,000 video views across all monetization sources combined — including ads, YouTube Premium payouts, Channel Memberships, Super Chat, and merchandise. RPM is always lower than CPM because it accounts for the revenue share YouTube retains and factors in views that generated no ad impression at all.

- RPM (Revenue per Mille): Your all-in earnings per 1,000 views. Tracking RPM over time reveals whether your monetization efficiency is improving, declining, or holding steady — independent of raw view volume fluctuations.
- Estimated Revenue: The total projected earnings for your channel within the selected date range. YouTube labels this "estimated" because final revenue figures are subject to advertiser verification and invalid traffic filtering before payouts are confirmed.
What Drives RPM Higher
RPM is influenced by several factors within your control. Content that attracts advertisers in high-value categories — such as finance, software, B2B services, and professional development — commands higher CPMs, which flows through to a stronger RPM. Longer videos that sustain viewer attention past the mid-roll ad threshold generate more ad placements per view. Diversifying revenue streams through Channel Memberships or Super Chat also lifts RPM by adding income that does not depend on ad impressions.
Using RPM to Benchmark Content Decisions
Comparing RPM across individual videos — not just total estimated revenue — reveals which topics and formats are most financially efficient. A video with moderate view counts but a high RPM may deliver more revenue than a viral video attracting a broad, low-advertiser-value audience. This insight helps B2B content teams prioritize topics that serve both audience growth and monetization goals simultaneously.
15 Key YouTube Analytics Metrics to Track for Growth
While YouTube Analytics offers a wealth of data, focusing on these 15 key metrics will provide the most actionable insights for growing your channel.
- Watch Time (or Audience Retention): The cumulative time viewers spend watching your content. High watch time signals engaging content to YouTube's algorithm.
- Average View Duration: The average length of time viewers watch a specific video. A higher duration means viewers are hooked.
- Audience Retention Curve: A visual representation of when viewers drop off in your videos. This helps pinpoint segments that are less engaging.
- Impressions Click-Through Rate (CTR): The percentage of times your thumbnail was shown that resulted in a click. Crucial for assessing title and thumbnail effectiveness.
- Subscriber Growth Rate: The speed at which your channel is gaining new subscribers. Indicates overall channel health and appeal.
- Unique Viewers: The number of distinct individuals watching your content. Helps understand your true reach.
- Traffic Sources: Identifies how viewers are finding your videos (search, browse, suggested, external). Essential for optimizing discoverability.
- New vs. Returning Viewers: Shows the balance between attracting new audiences and retaining existing ones.
- Viewer Demographics: Age, gender, and geographical location of your audience. Informs content targeting and language.
- When Your Viewers Are on YouTube: Helps schedule uploads for maximum initial engagement.
- Top Performing Videos: Identifies your most successful content for replication and understanding what resonates.
- Top YouTube Search Terms: Reveals what viewers are searching for to find your content, aiding SEO.
- Card and End Screen Click-Through Rates: Measures the effectiveness of your calls to action within videos.
- Comments, Likes, and Shares: Engagement metrics that indicate viewer interaction and loyalty.
- Revenue per Mille (RPM) / Estimated Revenue: For monetized channels, these track earning efficiency and overall income.
How to Use YouTube Analytics to Grow Your Channel
Leveraging the powerful features of YouTube Analytics allows marketers and creators to make data-driven decisions that propel channel growth and refine video marketing strategies.
Improve Video Performance and Double Down on Winners
By analyzing metrics like impressions CTR and audience retention, you can identify what makes your top videos successful. Was it a specific topic, editing style, or intro hook?
Apply these learnings to future content to consistently improve performance and double down on formats that consistently engage your audience.
Increase Watch Time & Audience Retention
Deep-dive into the audience retention graphs for individual videos. If there are sharp drop-offs, investigate what might be causing viewers to leave at that point. Use this feedback to refine your intros, pacing, and overall narrative flow to keep viewers watching longer, thereby boosting watch time.
Boost Discoverability with YouTube SEO Insights
The 'Research' tab and 'Traffic Sources' report are goldmines for YouTube SEO. Analyze the search queries that lead viewers to your content. Incorporate these keywords naturally into your video titles, descriptions, and tags. Understanding what your audience is searching for allows you to create highly relevant content that the algorithm is more likely to recommend.
Measuring True Marketing ROI
While YouTube Analytics is powerful for channel performance, enterprise marketing and analytics leaders often need to connect this data with performance from other paid channels like Google Ads, Facebook Ads, and LinkedIn.
To get a single source of truth and measure the true ROI of your video marketing efforts across the entire customer journey, a unified marketing analytics platform like Improvado can automate data integration from over 500 sources, eliminating manual reporting and providing a complete view of campaign performance.
Enhance Monetization Strategies
For monetized channels, the 'Revenue' tab offers critical insights. Understand which types of ads perform best, identify your top-earning content, and track revenue from alternative sources like memberships or merchandise. This data helps you optimize your content strategy for profitability and explore new monetization avenues effectively.
Common YouTube Analytics Mistakes to Avoid
Even with access to powerful data, misinterpretation or overlooking key metrics can hinder your growth. Avoid these common pitfalls to maximize your YouTube Analytics insights.
Ignoring Watch Time and Audience Retention Metrics
While views are a vanity metric, watch time and audience retention are the true indicators of content quality and viewer engagement. Don't solely focus on view counts; a video with fewer views but higher watch time and retention is often more valuable in the long run, as it signals to YouTube that your content is compelling.
Misinterpreting Click-Through Rate (CTR) Data
A high CTR is great, but it must be paired with good watch time. A high CTR on a misleading thumbnail or title might get clicks, but if viewers immediately leave, it tells YouTube your content isn't satisfying. Always analyze CTR in conjunction with audience retention for a holistic view of content appeal and quality.
Not Experimenting with Different Content Types
Sticking to one format or topic without exploring others can limit your growth. Use the 'Research' tab to identify new content opportunities based on audience interest. Experiment with Shorts, live streams, different video lengths, or new niches. Analytics will help you quickly determine if these experiments are resonating with your audience.
Beyond the Basics: External Tools & Advanced Mode
While the standard YouTube Analytics dashboard is robust, there are ways to dig even deeper or gain additional competitive insights.
Using YouTube's Advanced Mode Feature
For a more detailed report, you can use the 'Advanced Mode' feature within YouTube Analytics. This allows you to combine different metrics, filter data by specific video elements (like traffic source or device type), and export custom reports for deeper analysis in spreadsheet programs. This granular control is essential for uncovering complex trends and answering specific performance questions.
Complementary Tools: Social Blade, vidIQ, and TubeBuddy
Several third-party tools complement YouTube Analytics by offering competitive analysis, advanced keyword research, and optimization suggestions:
- vidIQ & TubeBuddy: These browser extensions provide on-the-fly data insights, keyword suggestions, SEO scores for your videos, and competitive analysis directly within YouTube. They help optimize titles, tags, and descriptions.
- Social Blade: This platform offers public statistics for virtually any YouTube channel, allowing you to track growth trends, estimated earnings, and compare your channel against competitors.
Marketing Intelligence Platforms: Improvado
Improvado integrates YouTube Analytics with data from ad platforms, CRMs, and web analytics tools, creating a single, connected view of performance across the full customer journey. It automatically extracts and standardizes YouTube metrics, then maps them to downstream KPIs like pipeline contribution, ROAS, and revenue impact.
This lets teams analyze how YouTube influences conversions and retention alongside other paid and organic channels, rather than in isolation. With customizable dashboards and automated data refresh, Improvado makes it easy to quantify the real business impact of your video strategy and optimize spend based on cross-channel performance.
Conclusion
In 2026’s competitive creator economy, success on YouTube isn’t about luck but understanding the numbers that drive engagement and revenue. YouTube Analytics equips marketers and creators with the insights needed to refine content strategy, optimize audience targeting, and maximize monetization opportunities.
However, YouTube data alone only tells part of the story. For marketing teams managing campaigns across multiple platforms, unifying performance metrics is critical to measuring true ROI. Improvado connects YouTube Analytics with 1,000+ marketing and ad data sources, creating a single source of truth for performance analysis. This automation eliminates manual reporting, surfaces actionable insights, and helps teams make confident, revenue-focused decisions.

