
Social media analytics goes way beyond reach, clicks, and engagement rate. Imagine a quarterly report presented to the C-Suite saying that your team doubled the impressions and gained a 20% growth in followers.
While these numbers are valuable for the social media team, CFOs and CEOs operate with completely different metrics. They want to see how social media contributes to revenue growth and what’s the ROI of your efforts.
A holistic social media dashboard is an effective way to get granular insights for your day-to-day tasks, as well as to provide an overview of all KPIs to stakeholders. In this guide, we’re exploring what a social media dashboard is, why it’s crucial for businesses today, and the best practices to know when using third-party solutions.
Key Takeaways:
- A social media dashboard consolidates performance metrics from all platforms into one centralized location for real-time analysis.
- The primary benefits include saving time through automation, gaining a holistic view of performance, enabling data-driven optimization, and effectively communicating ROI to executives.
- Essential components of a dashboard include performance KPIs, audience growth metrics, content analysis, competitive benchmarks, and conversion tracking.
- Building a successful dashboard requires a clear strategy that starts with defining goals, aggregating data, choosing the right visualization tools, and designing for clarity.
- Advanced dashboards integrate with other business systems like CRM and web analytics to provide a complete view of the customer journey.
Quick answer
A social media dashboard is a data visualization tool that displays key performance indicators, metrics, and data points related to social media marketing efforts. It connects to platforms like Facebook, Instagram, LinkedIn, X, TikTok, and Pinterest, pulling data in real-time and presenting it in an easy-to-understand graphical format to create a single source of truth.
What Is a Social Media Dashboard? And Why It's Non-Negotiable
Instead of just showing you how many likes a post received, it helps you understand why it performed well. It allows you to drill down from a high-level, cross-channel overview to the performance of a single ad creative.
It contextualizes data by comparing performance over time, against benchmarks, or versus competitors.
The Core Purpose: Unifying Data for Actionable Insights
The fundamental purpose of a social media dashboard is to create a single source of truth. By aggregating data from all your organic and paid social channels, it eliminates data silos. This unified view allows you to spot cross-channel trends, understand how different platforms contribute to your goals, and allocate your budget more effectively.
The dashboard turns raw data into actionable insights, answering critical questions like,
- Which platform is driving the most qualified leads?
- What type of content resonates best with our highest-value audience segment?
The Tangible Business Benefits of a Unified Social Media Dashboard
Implementing a centralized dashboard isn't just an exercise in data organization; it delivers significant, measurable benefits that impact efficiency, strategy, and revenue.
Gaining a Single Source of Truth Across All Channels
Consistency is key in analytics. When different team members pull data from different platforms at different times, you get conflicting numbers and a confused strategy.
A unified dashboard ensures everyone, from the social media manager to the CMO, is looking at the same data, leading to more aligned and effective decision-making.
Enabling Real-Time Performance Tracking and Optimization
The social media landscape changes in minutes, not months. A real-time dashboard allows you to monitor campaign performance as it happens.
You can quickly identify ads that are underperforming and reallocate budget to winners, or double down on a piece of organic content that's going viral.
This agility is a massive competitive advantage, enabling you to optimize for better results continuously.
Automating Tedious Reporting and Analysis
Marketing teams spend, on average, hours every week on manual reporting. This is time that could be spent on strategy and creative work. A dashboard automates this entire process.
With reporting automation, reports can be generated and distributed on a set schedule (daily, weekly, monthly) without any manual intervention, freeing up your team to focus on what truly matters.
Proving Social Media ROI to Stakeholders
A well-designed dashboard is the ultimate tool for communicating value. Instead of presenting a spreadsheet of disconnected metrics, you can show a clear, visual story of how social media activities are driving website traffic, generating leads, and influencing sales.
This makes it infinitely easier to justify budget requests and demonstrate the strategic importance of your team's work.
Uncovering Deeper Audience and Content Insights
By seeing all your data in one place, you can uncover patterns that would be invisible in siloed views. You might discover that your LinkedIn audience engages most with video content on weekday mornings, while your Instagram followers prefer interactive Stories on weekends.
These insights are gold for content planning and audience targeting, helping you deliver the right message to the right person at the right time.
Essential Components: What Every Social Media Dashboard Must Include
While dashboards should be customized to specific goals, a comprehensive social media performance dashboard will always contain a few core components. Think of these as the essential building blocks for a complete view of your social ecosystem.
Core Performance Metrics (Organic & Paid)
This is the foundation. Your dashboard needs to display the most important top-level metrics for each platform, segmented by organic and paid efforts.
This includes impressions, reach, engagement (likes, comments, shares), video views, and clicks. These should be viewable over selectable time periods to track trends.
Audience Demographics and Growth Tracking
Understanding who you're talking to is as important as what you're saying. The dashboard should visualize your audience demographics (age, gender, location, language) and track follower growth rate over time. This helps ensure you're attracting the right audience and validates your targeting strategies.
Content Performance Analysis (Post-by-Post)
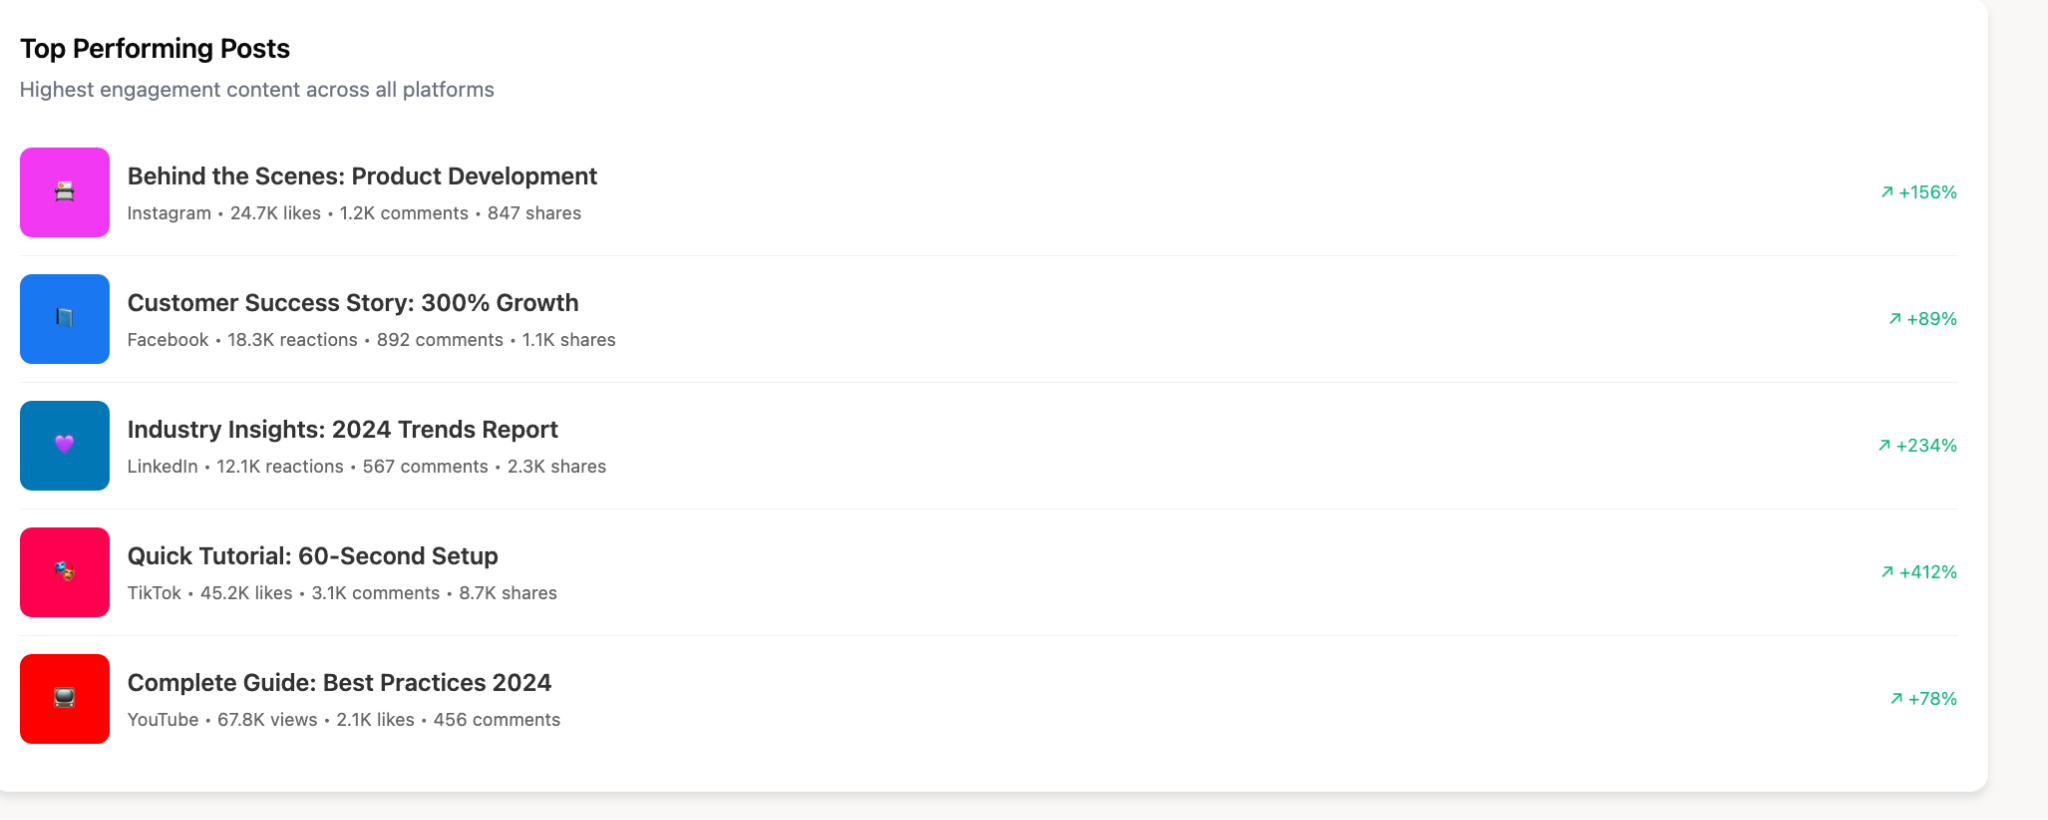
A great dashboard allows you to move from the macro to the micro. You need a section that breaks down the performance of individual posts or ads.
This view should be sortable by different metrics (highest engagement rate, most clicks, etc.) to quickly identify top and bottom-performing content, providing clear guidance for your creative strategy.
Competitive Analysis and Benchmarking
Your performance doesn't exist in a vacuum. A valuable dashboard includes competitor tracking. This could be monitoring their follower growth, engagement rates, or share of voice (how often your brand is mentioned compared to competitors).
This context helps you benchmark your own performance and identify opportunities or threats.
Conversion and Revenue Tracking
This is the component that connects social media to business results. By integrating with tools like Google Analytics or your CRM, the dashboard can track conversions that originate from social media. This includes metrics like leads generated, form fills, e-commerce purchases, and ultimately, the revenue and ROAS attributed to each channel and campaign.
Key Social Media Metrics to Track (Categorized by Goal)
Not all metrics are created equal. The KPIs you prioritize should directly align with your business objectives.
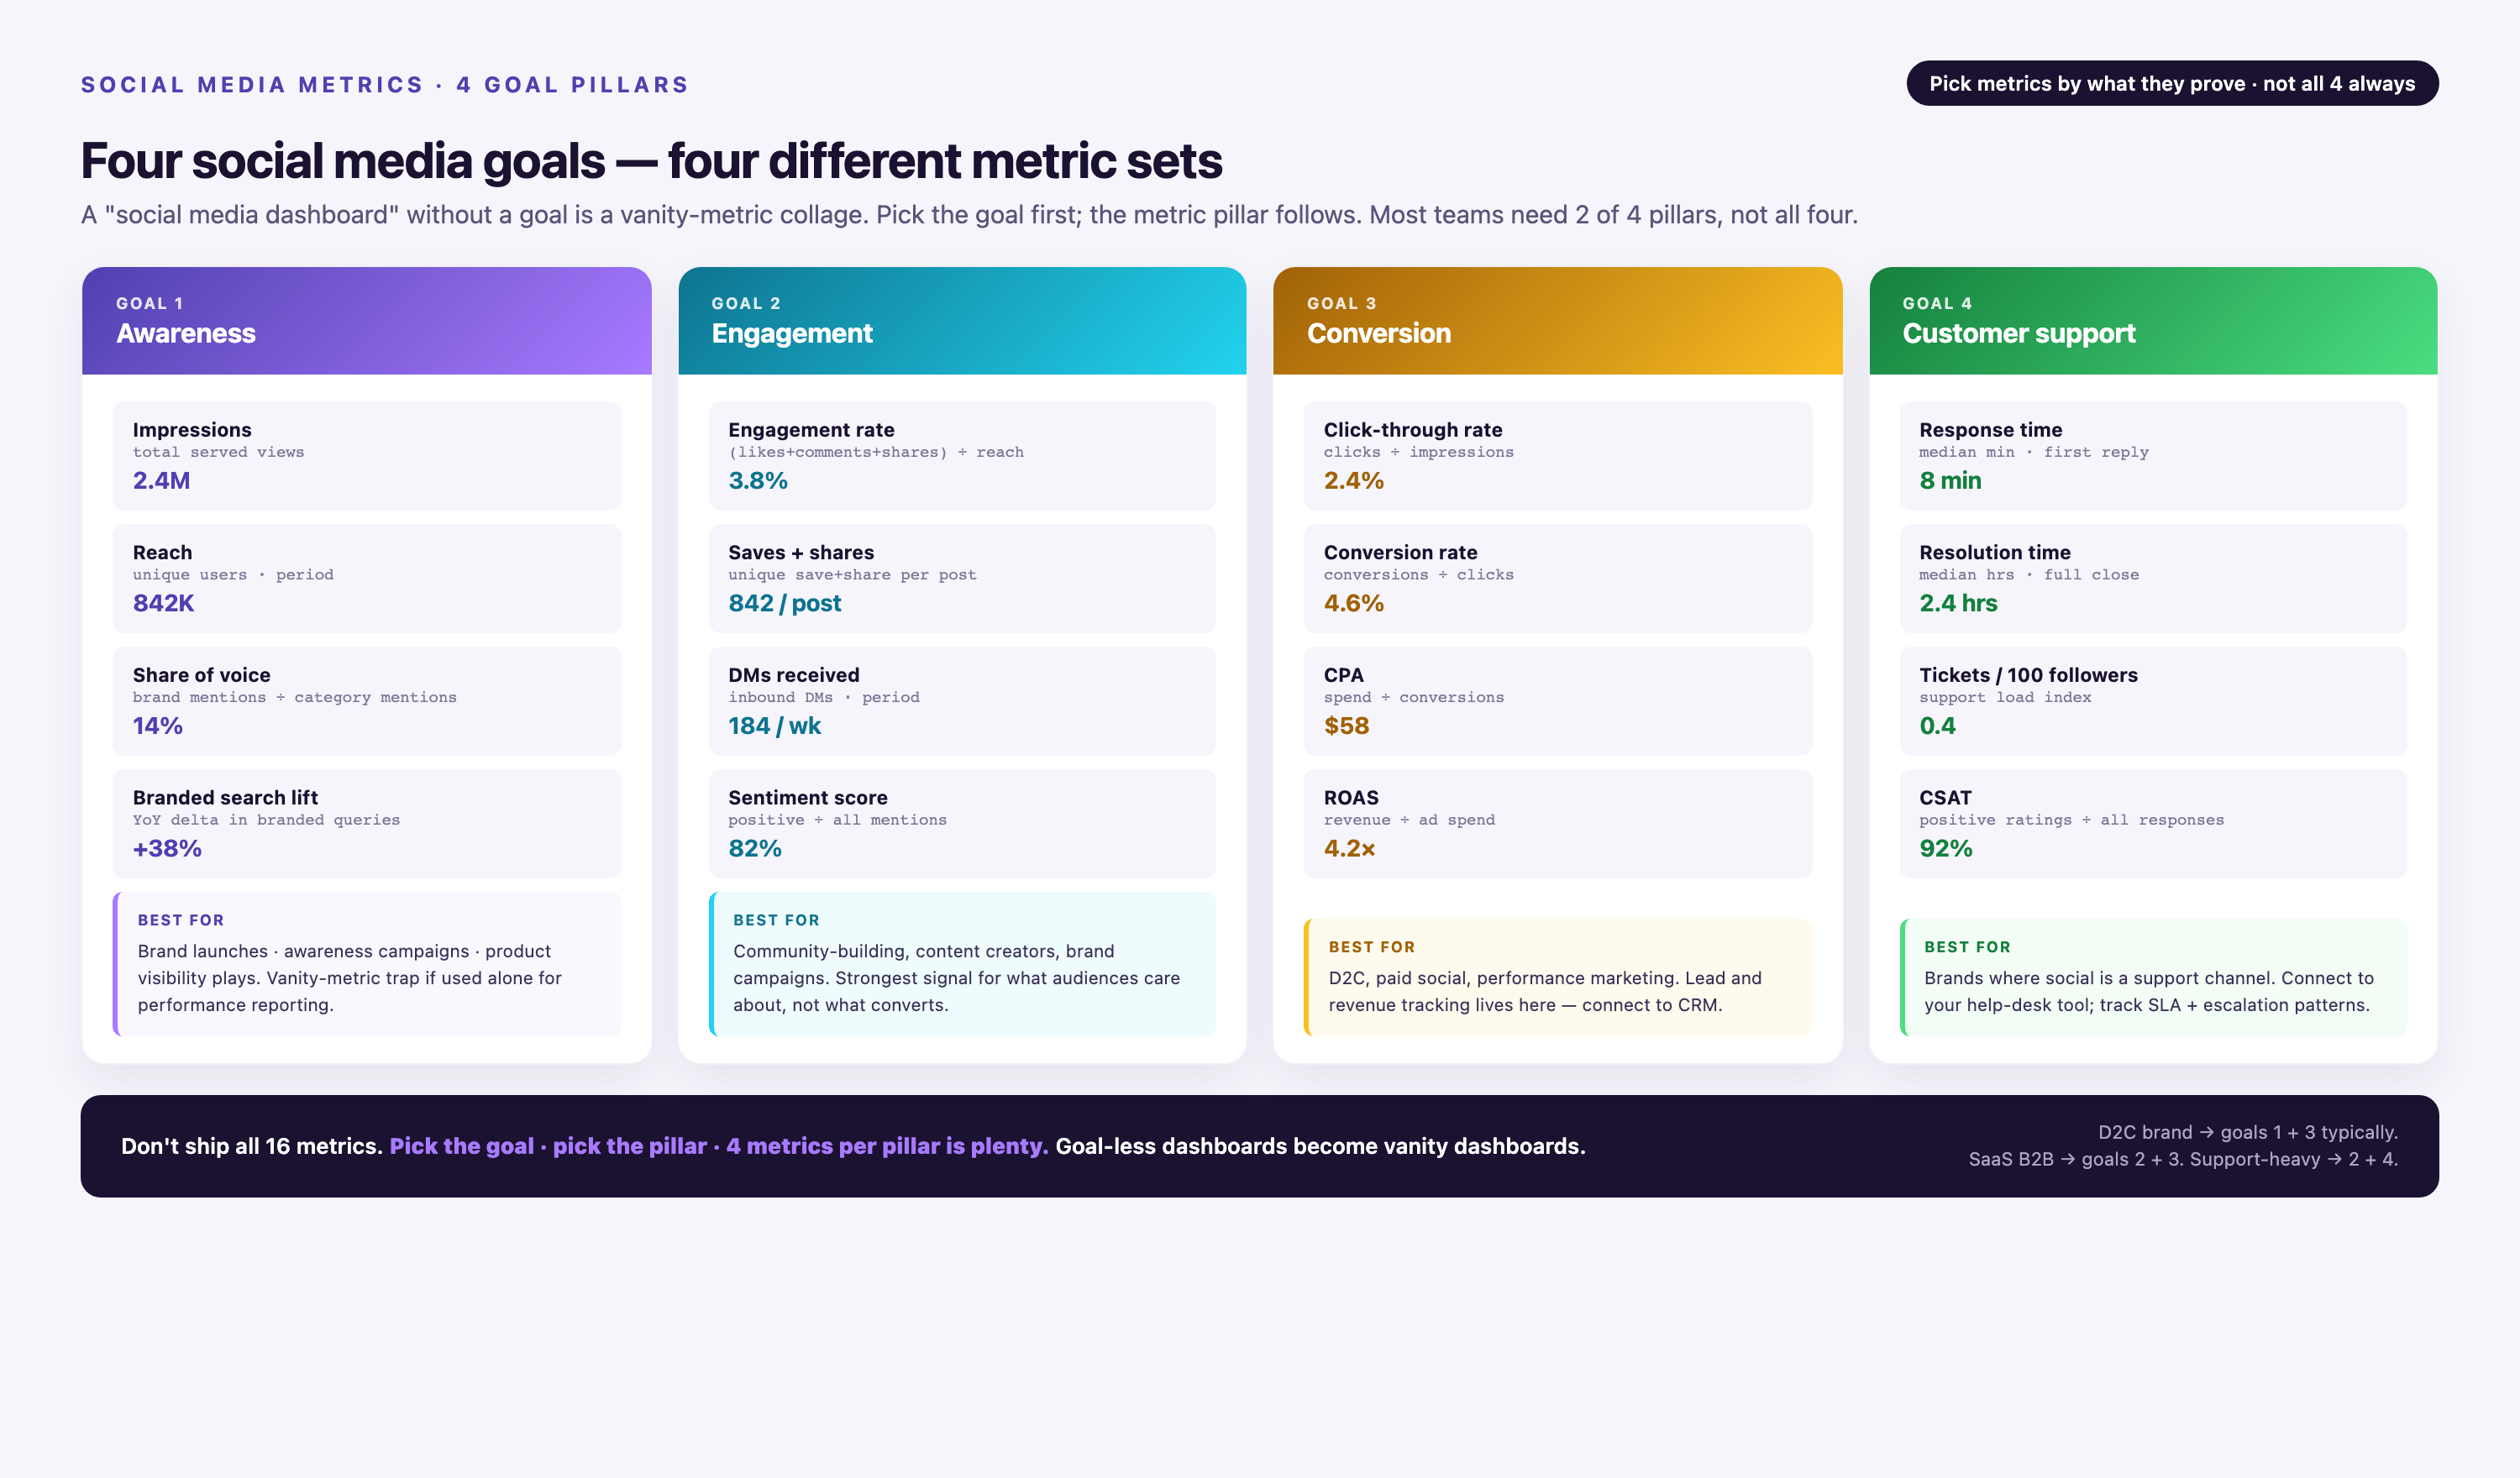
Here’s a breakdown of essential metrics categorized by the goals they help measure.
Awareness Metrics (Top-of-Funnel)
- Reach: The total number of unique users who saw your content. It measures the size of your potential audience.
- Impressions: The total number of times your content was displayed, whether it was clicked or not. One person can have multiple impressions.
- Share of Voice (SOV): A measure of your brand's visibility compared to your competitors. It's calculated as (Your Brand Mentions / Total Mentions for Industry) * 100.
Engagement Metrics (Middle-of-Funnel)
- Engagement Rate: The percentage of people who saw your post and interacted with it. The formula is typically (Total Engagements / Reach or Followers) * 100%.
- Likes, Comments, Shares: These are the fundamental interactions that show your content is resonating with your audience.
- Applause Rate: (Likes / Total Followers) * 100. Measures approval.
- Amplification Rate: (Shares / Total Followers) * 100. Measures how your audience extends your reach.
Conversion Metrics (Bottom-of-Funnel)
- Click-Through Rate (CTR): The percentage of people who saw your post and clicked on the link within it. (Total Clicks / Total Impressions) * 100.
- Cost Per Click (CPC): The amount you pay for each click on your paid social ads.
- Conversion Rate: The percentage of users who clicked a link and completed a desired action (e.g., made a purchase, filled out a form).
- Cost Per Acquisition (CPA): The total cost of acquiring one new customer through a specific campaign or channel.
C-Level & Executive Metrics (Business Impact)
- Return on Ad Spend (ROAS): The amount of revenue generated for every dollar spent on advertising. (Revenue from Ads / Cost of Ads).
- Customer Lifetime Value (LTV): The total revenue a business can expect from a single customer account acquired through social media.
- Social Media ROI: The overall return on your social media investment, including ad spend, tools, and personnel costs. This is the ultimate measure of success.
How to Build a Powerful Social Media Dashboard in 5 Steps
Creating an effective social media dashboard is a strategic process. Whether you're using a BI tool or a specialized platform, following these steps will ensure your final product is both useful and actionable.
Step 1: Define Your Goals and Key Performance Indicators (KPIs)
Before you pull any data, ask the most important question: What are we trying to achieve?
Are you focused on brand awareness, lead generation, or customer retention? Your goals will determine your KPIs.
- For awareness, you'll focus on reach and impressions.
- For lead generation, you'll track conversions and CPA.
- For brand reputation, track sentiment score, comment quality, response rate, and customer support inquiries coming through social channels.
- For retention and loyalty, monitor repeat engagement, referral volume, user-generated content trends, and community growth.
Clearly defining these upfront is critical. This is where looking at various KPI dashboards for inspiration can be incredibly helpful.
Step 2: Aggregate Your Data Sources (The ETL Challenge)
This is often the most challenging step. You need to connect to the APIs of every social platform you use.
This requires technical expertise to handle authentication, data extraction, and scheduling. You also need a place to store this data. This process, known as ETL (Extract, Transform, Load), is where many in-house projects fail.
Improvado removes the complexity by managing this entire pipeline for social data end-to-end. It automatically pulls data from platforms like Meta, LinkedIn, TikTok, X, YouTube, Pinterest, and Snapchat, as well as Google Analytics, UTM sources, and revenue systems, then structures it into a consistent format so insights flow without manual engineering.
With Improvado, you get:
- 1,000+ no-code connectors for social, web analytics, CRM, and paid media platforms
- Automated API maintenance (no manual token refreshes or schema updates)
- Standardized social metrics and dimensions, automated normalization and mapping across platforms and naming structures
- Warehouse delivery to BigQuery, Snowflake, Redshift, or your database
- Transformation engine to align campaigns, platforms, and taxonomy rules
- Data quality monitoring and anomaly alerts to ensure accuracy and consistency
- AI Agent to answer ad-hoc social performance questions, build dashboards and reports using natural language
By offloading the ETL burden, Improvado lets analysts and marketers focus on insight and decision-making.
Step 3: Choose Your Visualization Platform (BI Tools)
Once your data is consolidated, you need a tool to visualize it. Popular choices include:
- Business Intelligence (BI) Tools: Platforms like Tableau, Looker (Google Data Studio), or Power BI offer incredible flexibility and customization but have a steep learning curve.
- Social Media Management Tools: Tools like Hootsuite or Sprout Social have built-in dashboards, but they are often limited to the data within their platform and lack customization.
- Marketing Data Platforms: Solutions like Improvado handle the entire process from data aggregation to visualization, offering pre-built templates and full customization without requiring you to manage the underlying data pipelines.
Step 4: Design Your Dashboard Layout and Visuals
Good design is about clarity. Follow these principles:
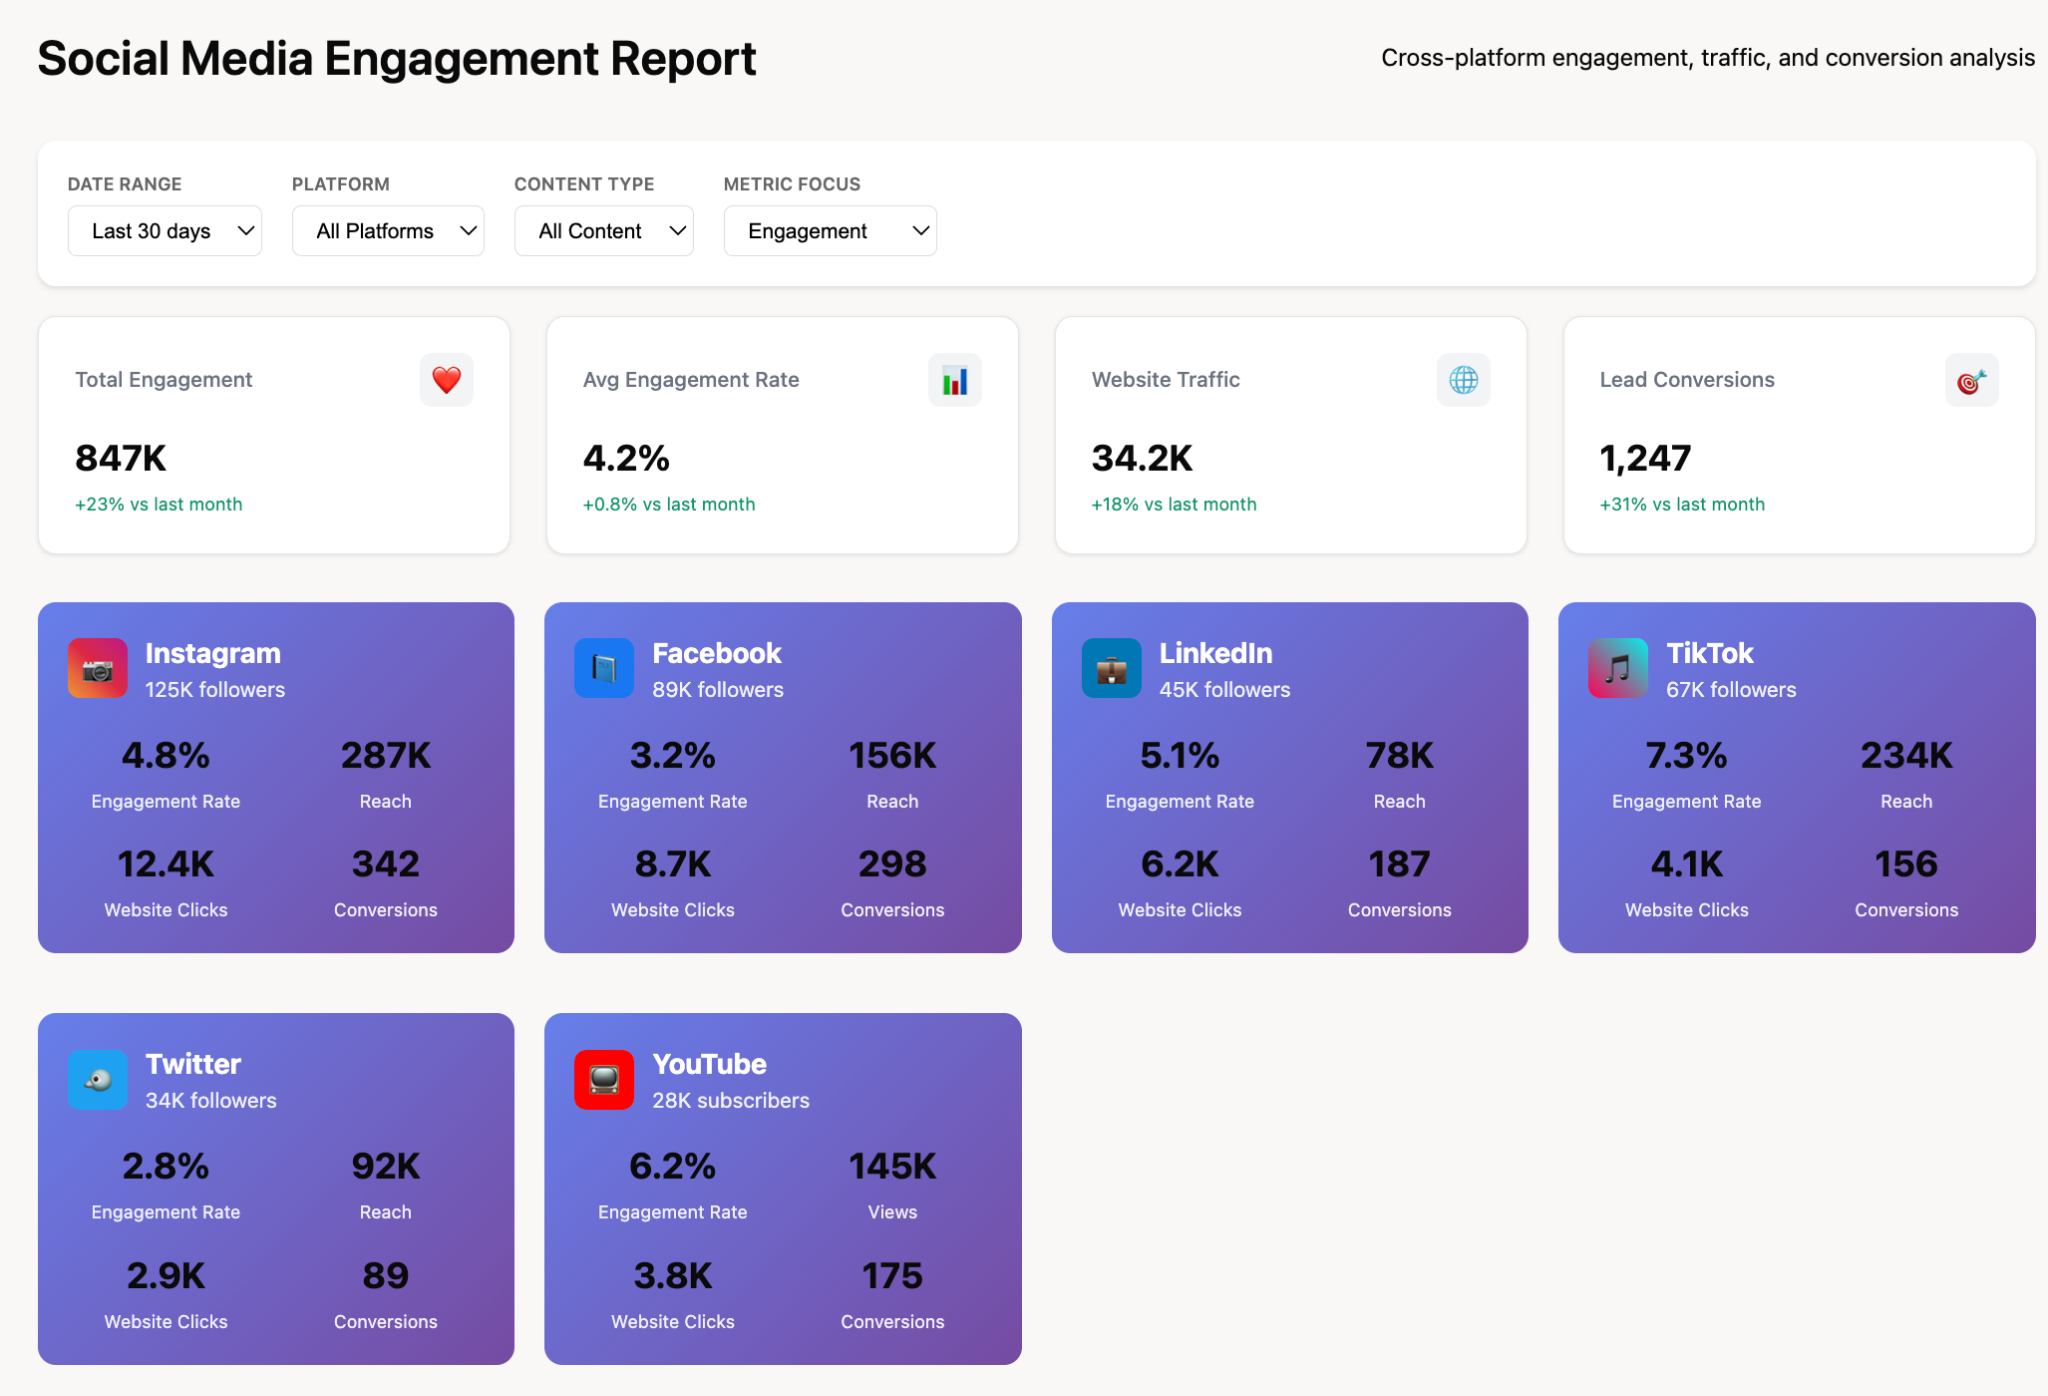
- Start with the Big Picture: Place high-level, summary metrics at the top.
- Group Related Metrics: Have separate sections for organic performance, paid campaigns, audience growth, etc.
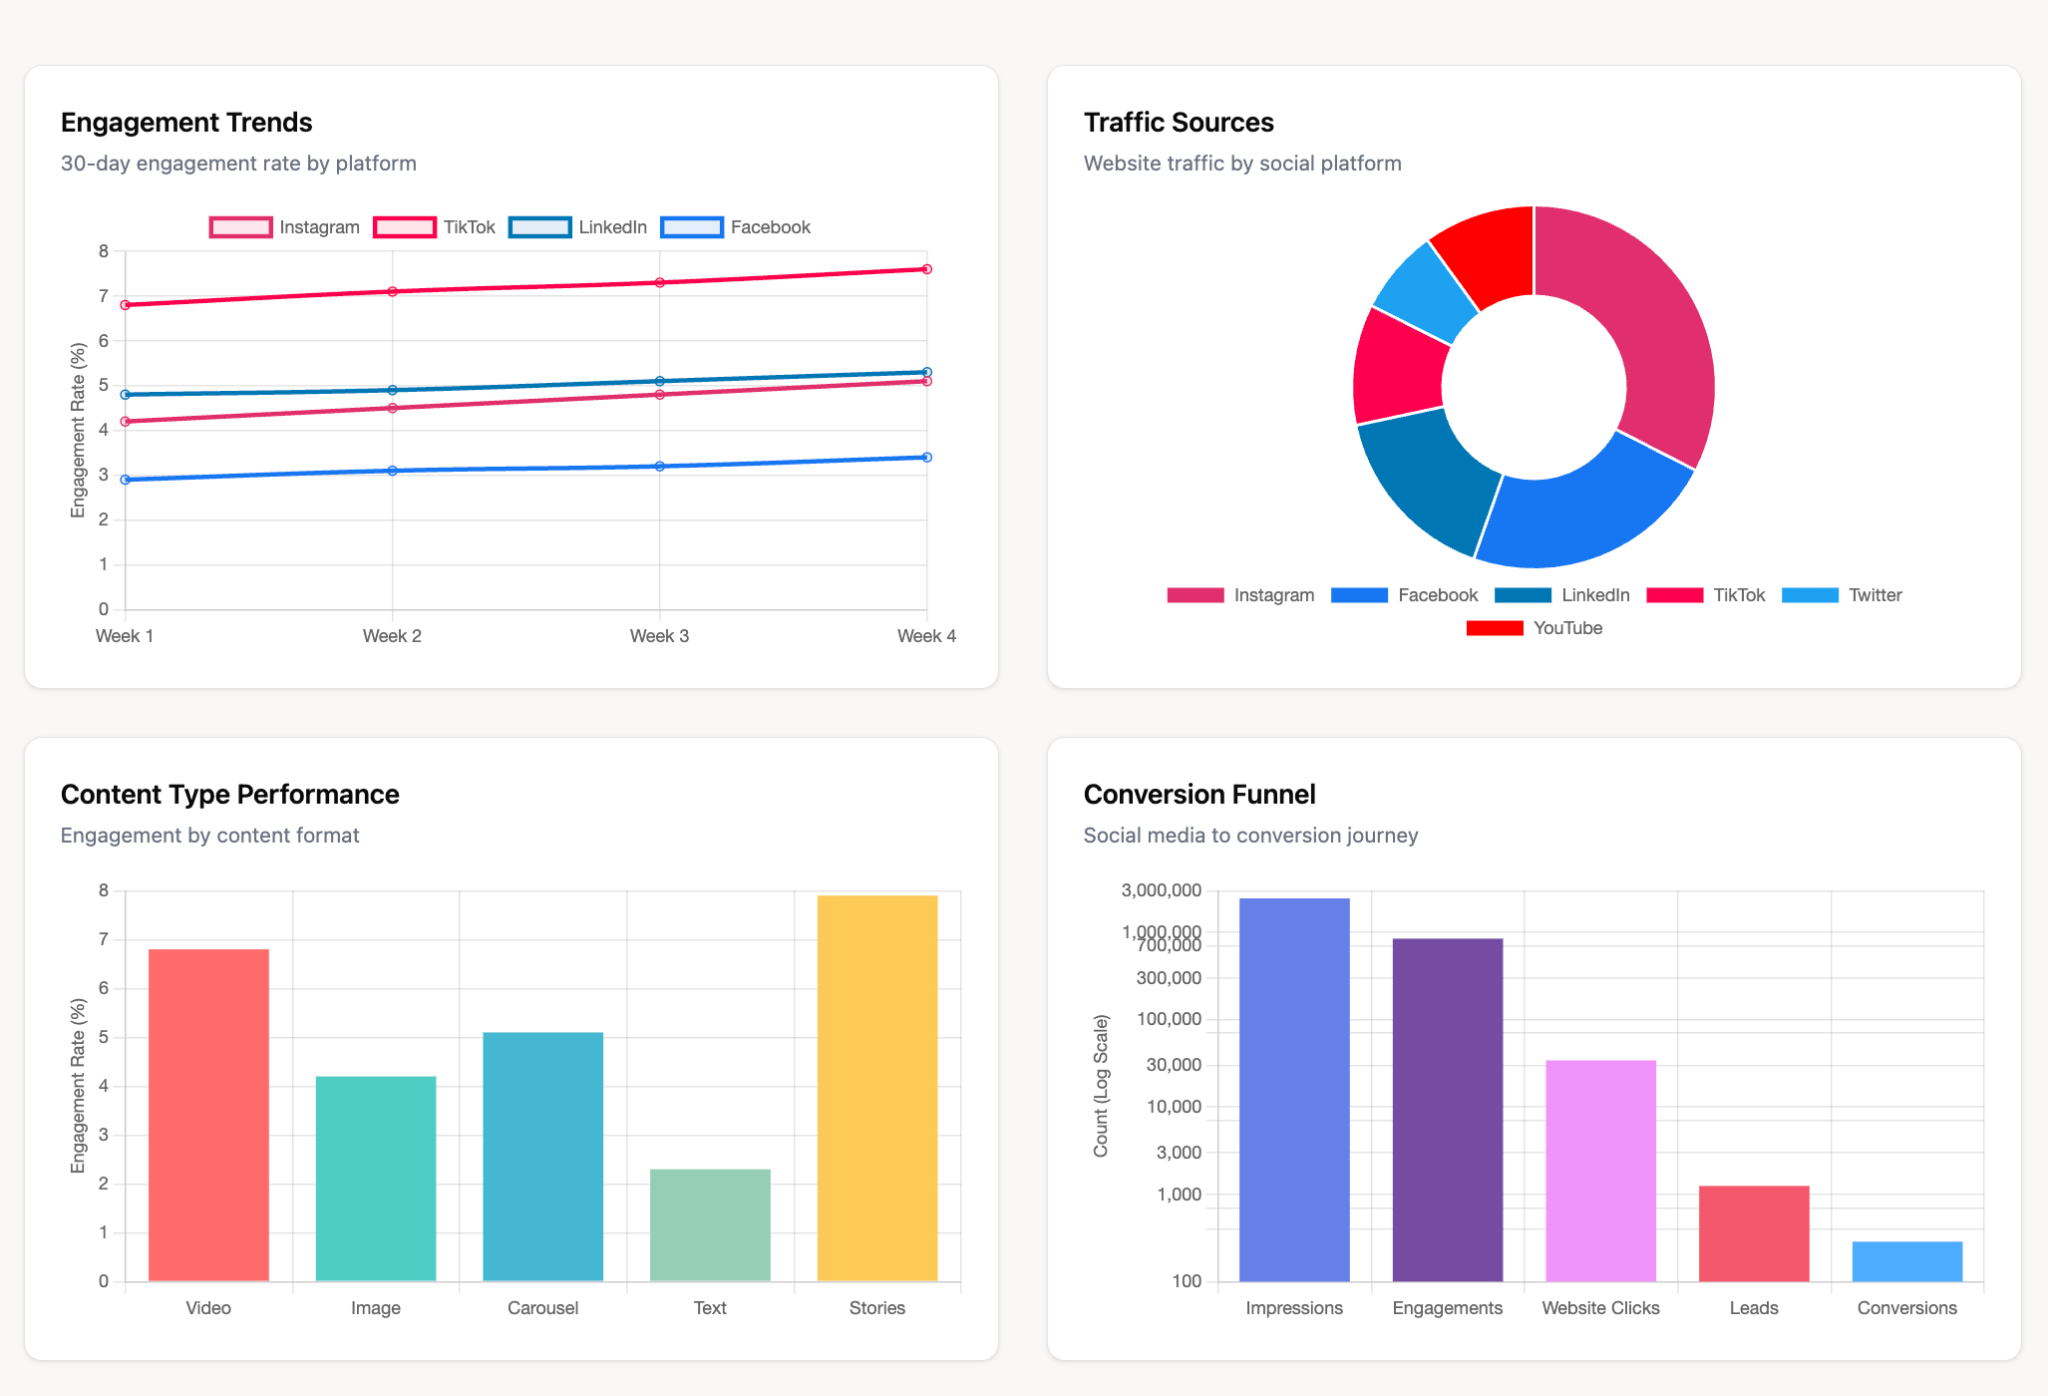
- Use the Right Chart for the Job: Use line charts for trends over time, bar charts for comparisons, and pie charts for composition.
- Keep it Clean: Avoid clutter. Use color strategically to highlight key information, not to decorate.
Step 5: Implement Automation, Alerts, and Sharing Protocols
A static dashboard is a dead dashboard. Set up automated data refreshes, ideally hourly or daily.
Configure alerts that notify you of significant changes, like a sudden drop in ROAS or a spike in negative sentiment.
Finally, establish a protocol for sharing the dashboard with stakeholders, whether through scheduled email reports, a shared link, or live presentations.
Social Media Dashboard Examples & Templates for Inspiration
A great way to start is by looking at established templates. Here are five examples of social media dashboard templates tailored for different purposes.
The All-in-One Social Media Performance Dashboard
This is the master view for a social media manager. It provides a holistic overview across all channels.
- Key Widgets: Overall Spend vs. Budget, Cross-Channel Reach & Engagement, Top Performing Campaigns (Organic & Paid), Follower Growth by Platform, Conversion Funnel from Social.
- Goal: To monitor the overall health of the social media program at a glance.
The Paid Social Advertising (ROAS) Dashboard
This dashboard is for performance marketers and is hyper-focused on the financial return of paid campaigns.
- Key Widgets: ROAS by Platform/Campaign/Ad Set, CPA, CPC, CTR, Total Conversions, Revenue Attributed to Ads.
- Goal: To maximize the profitability of paid social advertising by enabling rapid optimization.
The Brand Health & Sentiment Monitoring Dashboard
This is for brand managers and PR teams, focusing on audience perception and conversation.
- Key Widgets: Brand Mentions Over Time, Sentiment Analysis (Positive, Neutral, Negative), Share of Voice vs. Competitors, Key Conversation Themes, Influencer Mentions.
- Goal: To protect and manage brand reputation online.
The Competitive Intelligence Dashboard
This dashboard keeps a close eye on what your competitors are doing and how they are performing.
- Key Widgets: Competitor Follower Growth, Competitor Engagement Rates, Competitor Top Performing Posts, Competitor Ad Examples, Competitor Share of Voice.
- Goal: To identify competitive threats and opportunities and benchmark your own strategy.
The Executive Summary (C-Suite) Dashboard
This is a high-level, simplified dashboard designed for busy executives. It strips away the granular details and focuses on business impact.
- Key Widgets: Total Social Media ROI, Leads Generated from Social, Customer Acquisition Cost from Social, Contribution to Revenue Pipeline, Overall Audience Growth.
- Goal: To quickly communicate the business value of social media to leadership.
Comparing Dashboard Solutions: In-House vs. Platform vs. ETL Provider
When deciding how to create your social media dashboard, you generally have three paths. Each has distinct advantages and disadvantages, and the right choice depends on your team's resources, technical expertise, and goals.
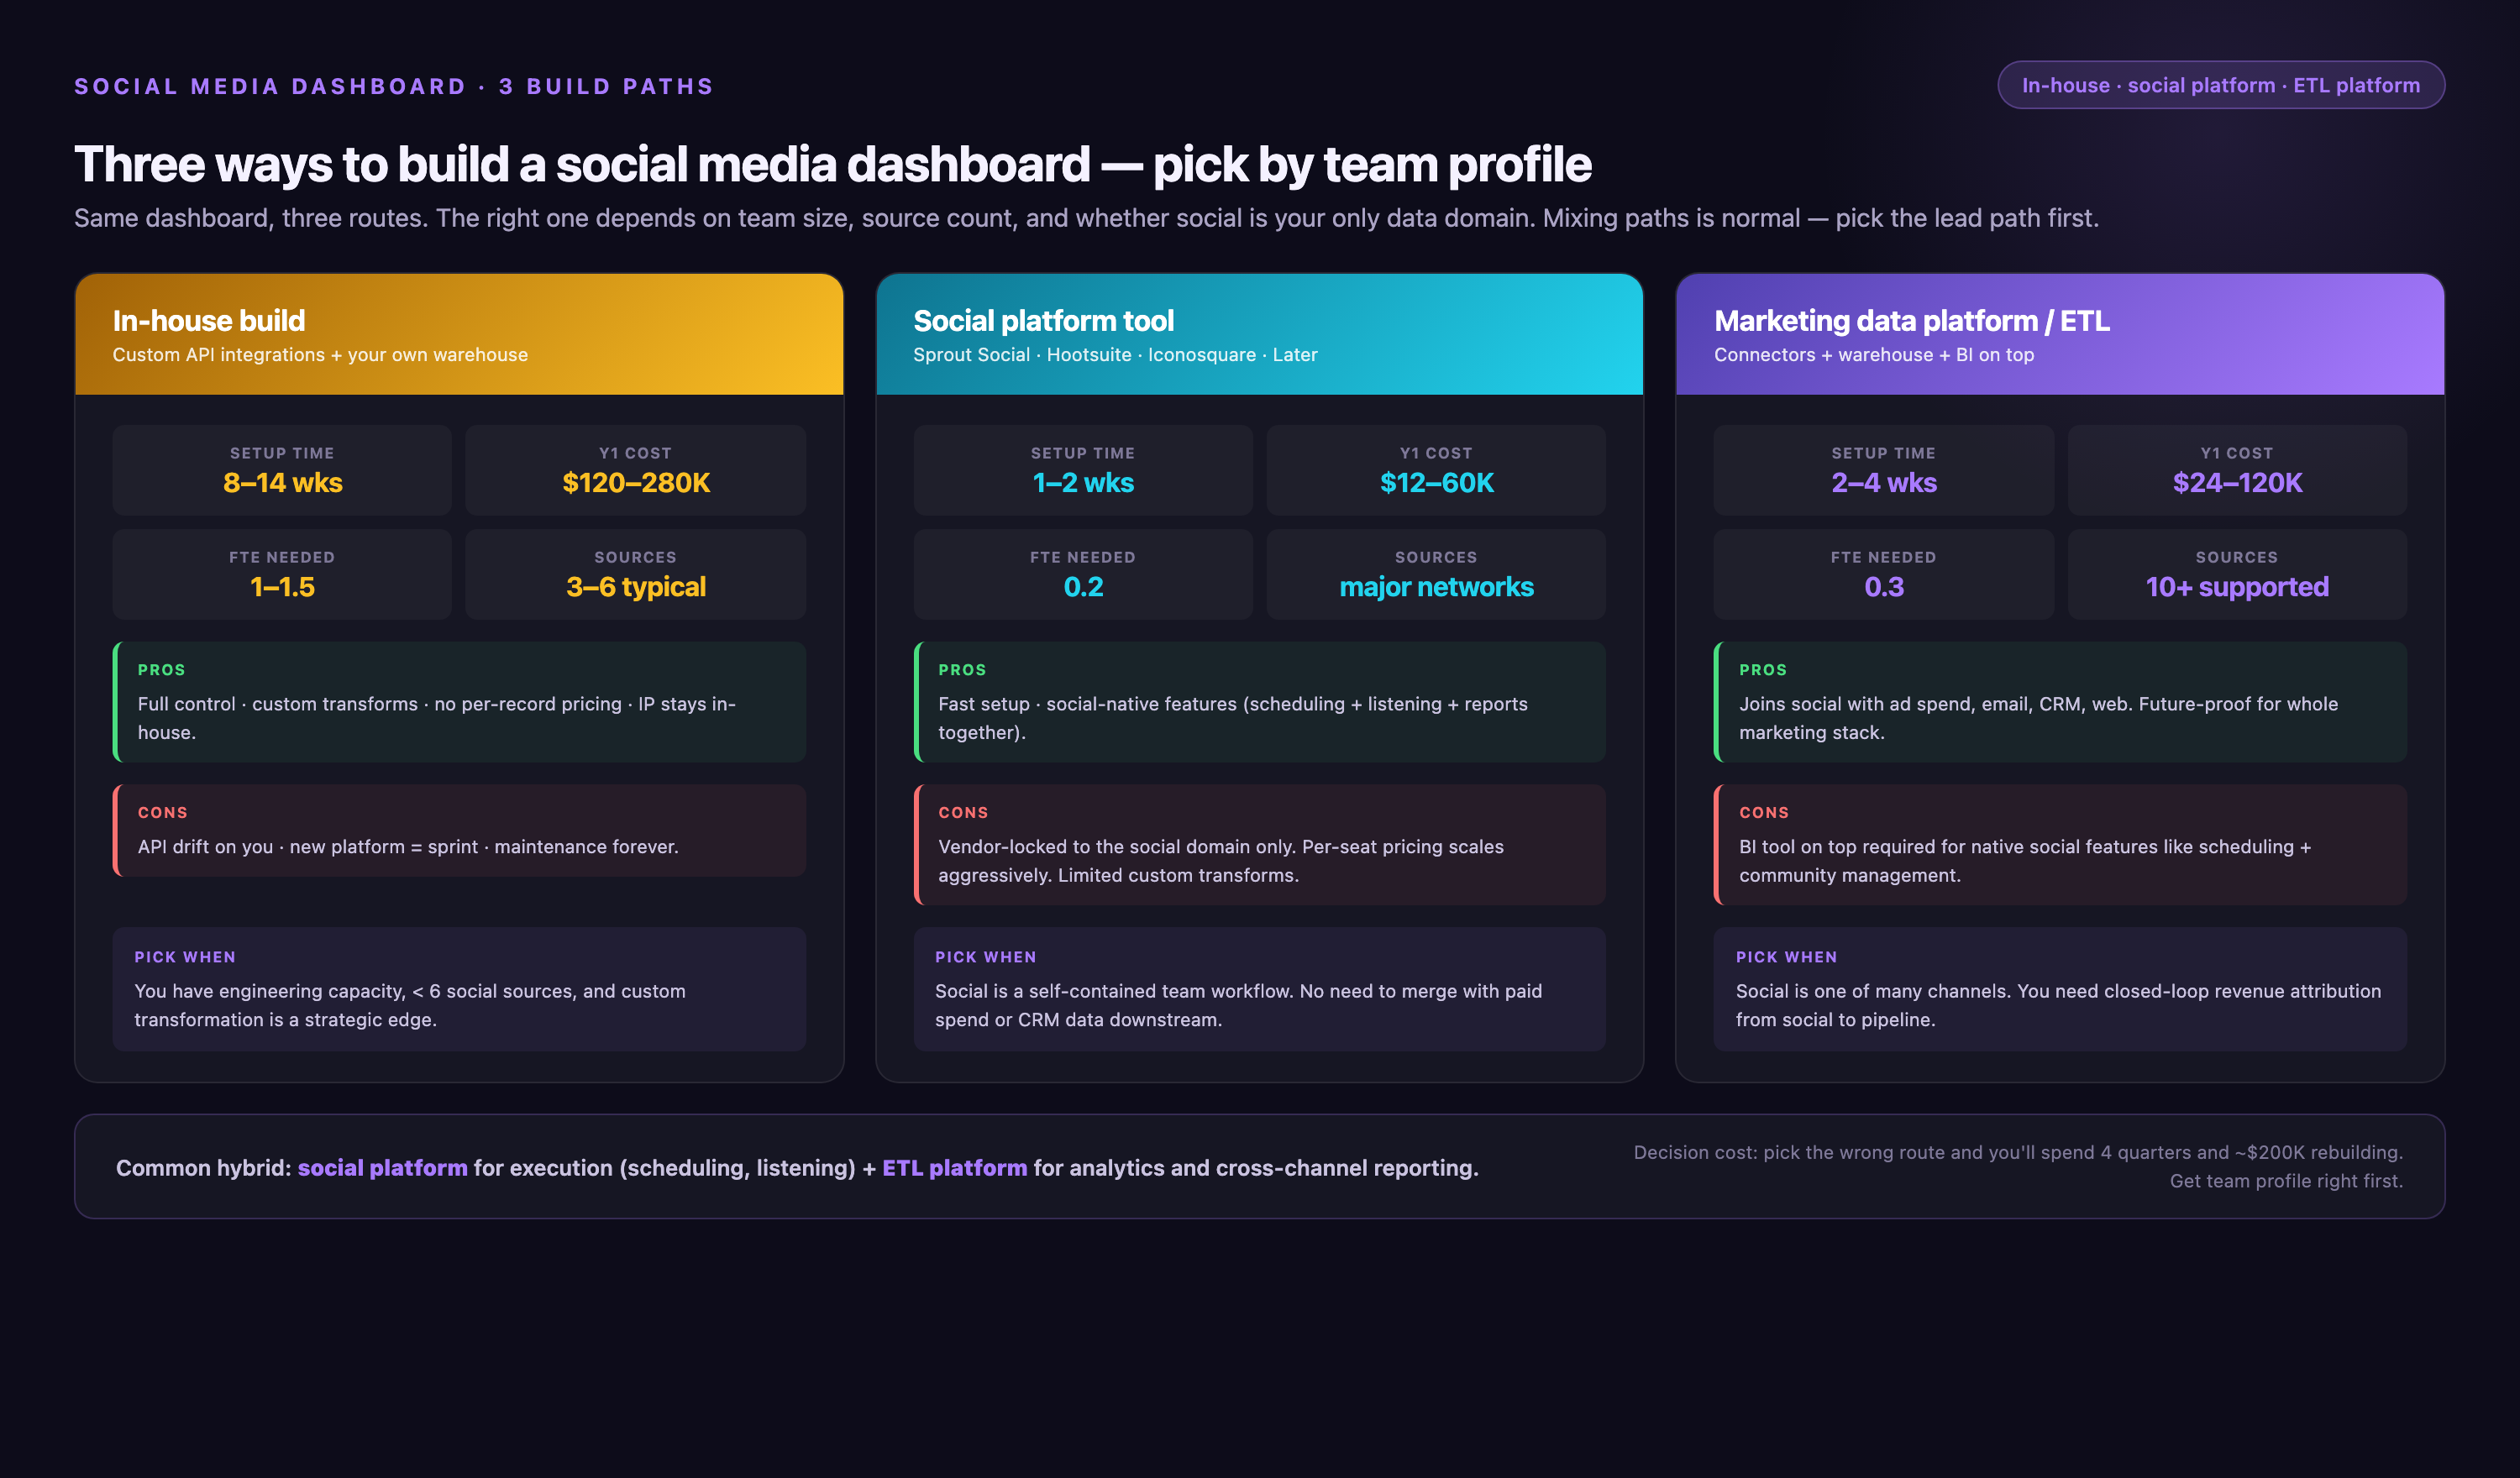
| Aspect | In-House Build (with BI Tool) | Native Platform Analytics | Marketing ETL Platform (Improvado) |
|---|---|---|---|
| Data Consolidation | Possible, but requires extensive engineering resources to build and maintain pipelines. | Not possible. Data is siloed within each platform (e.g., Facebook data is separate from LinkedIn). | Core feature. Aggregates data from all social and marketing platforms automatically. |
| Customization | Extremely high. You can build anything you can imagine if you have the skills. | Very low. You are limited to the pre-built reports and metrics provided by the platform. | High. Offers pre-built templates but also allows for full customization and data delivery to any BI tool. |
| Maintenance | Very high and ongoing. API changes can break pipelines, requiring constant monitoring and updates. | Zero. The platform handles all maintenance. | Zero. The platform manages all API connections, updates, and maintenance for you. |
| Time to Value | Very slow. Can take 6-12 months to build a fully functional system. | Instant. The dashboards are available out-of-the-box. | Fast. You can have a functional, cross-channel dashboard in days or weeks, not months. |
| Total Cost of Ownership | High. Includes salaries for data engineers, data scientists, and BI tool licenses. | Low (often included with ad spend). | Predictable subscription cost. Lower TCO than building in-house for most teams. |
| Scalability | Dependent on your infrastructure. Can be challenging to scale without significant investment. | Limited to the platform's capabilities. | Highly scalable. Designed to handle massive volumes of marketing data. |
Advanced Dashboard Features to Gain a Competitive Edge
Once you've mastered the basics, advanced features can unlock deeper levels of insight and strategic advantage.
Integrating CRM and Sales Data
The ultimate goal is to connect social media activity to actual sales. By integrating data from your CRM (like Salesforce or HubSpot), your dashboard can track the entire customer journey. You can see which social channels are sourcing the leads that eventually become high-value customers, enabling you to optimize your spend for lead quality, not just quantity.
Applying Advanced Marketing Attribution Models
Which touchpoint gets the credit for a conversion?
A simple "last-click" model often undervalues the role of social media. An advanced dashboard can apply more sophisticated models, such as linear, time-decay, or data-driven marketing attribution.
This provides a much more accurate picture of how your social channels contribute to conversions throughout the funnel.
Leveraging AI for Predictive Analytics and Anomaly Detection
The future of analytics is predictive. Modern platforms can use AI and machine learning to analyze historical data and forecast future performance.
AI can also power anomaly detection, automatically alerting you to unusual spikes or dips in your metrics that might signal a problem or an opportunity, allowing you to react proactively.
Overcoming Common Dashboard Challenges
Building and maintaining a dashboard is not without its hurdles. Understanding these common challenges is the first step to overcoming them.
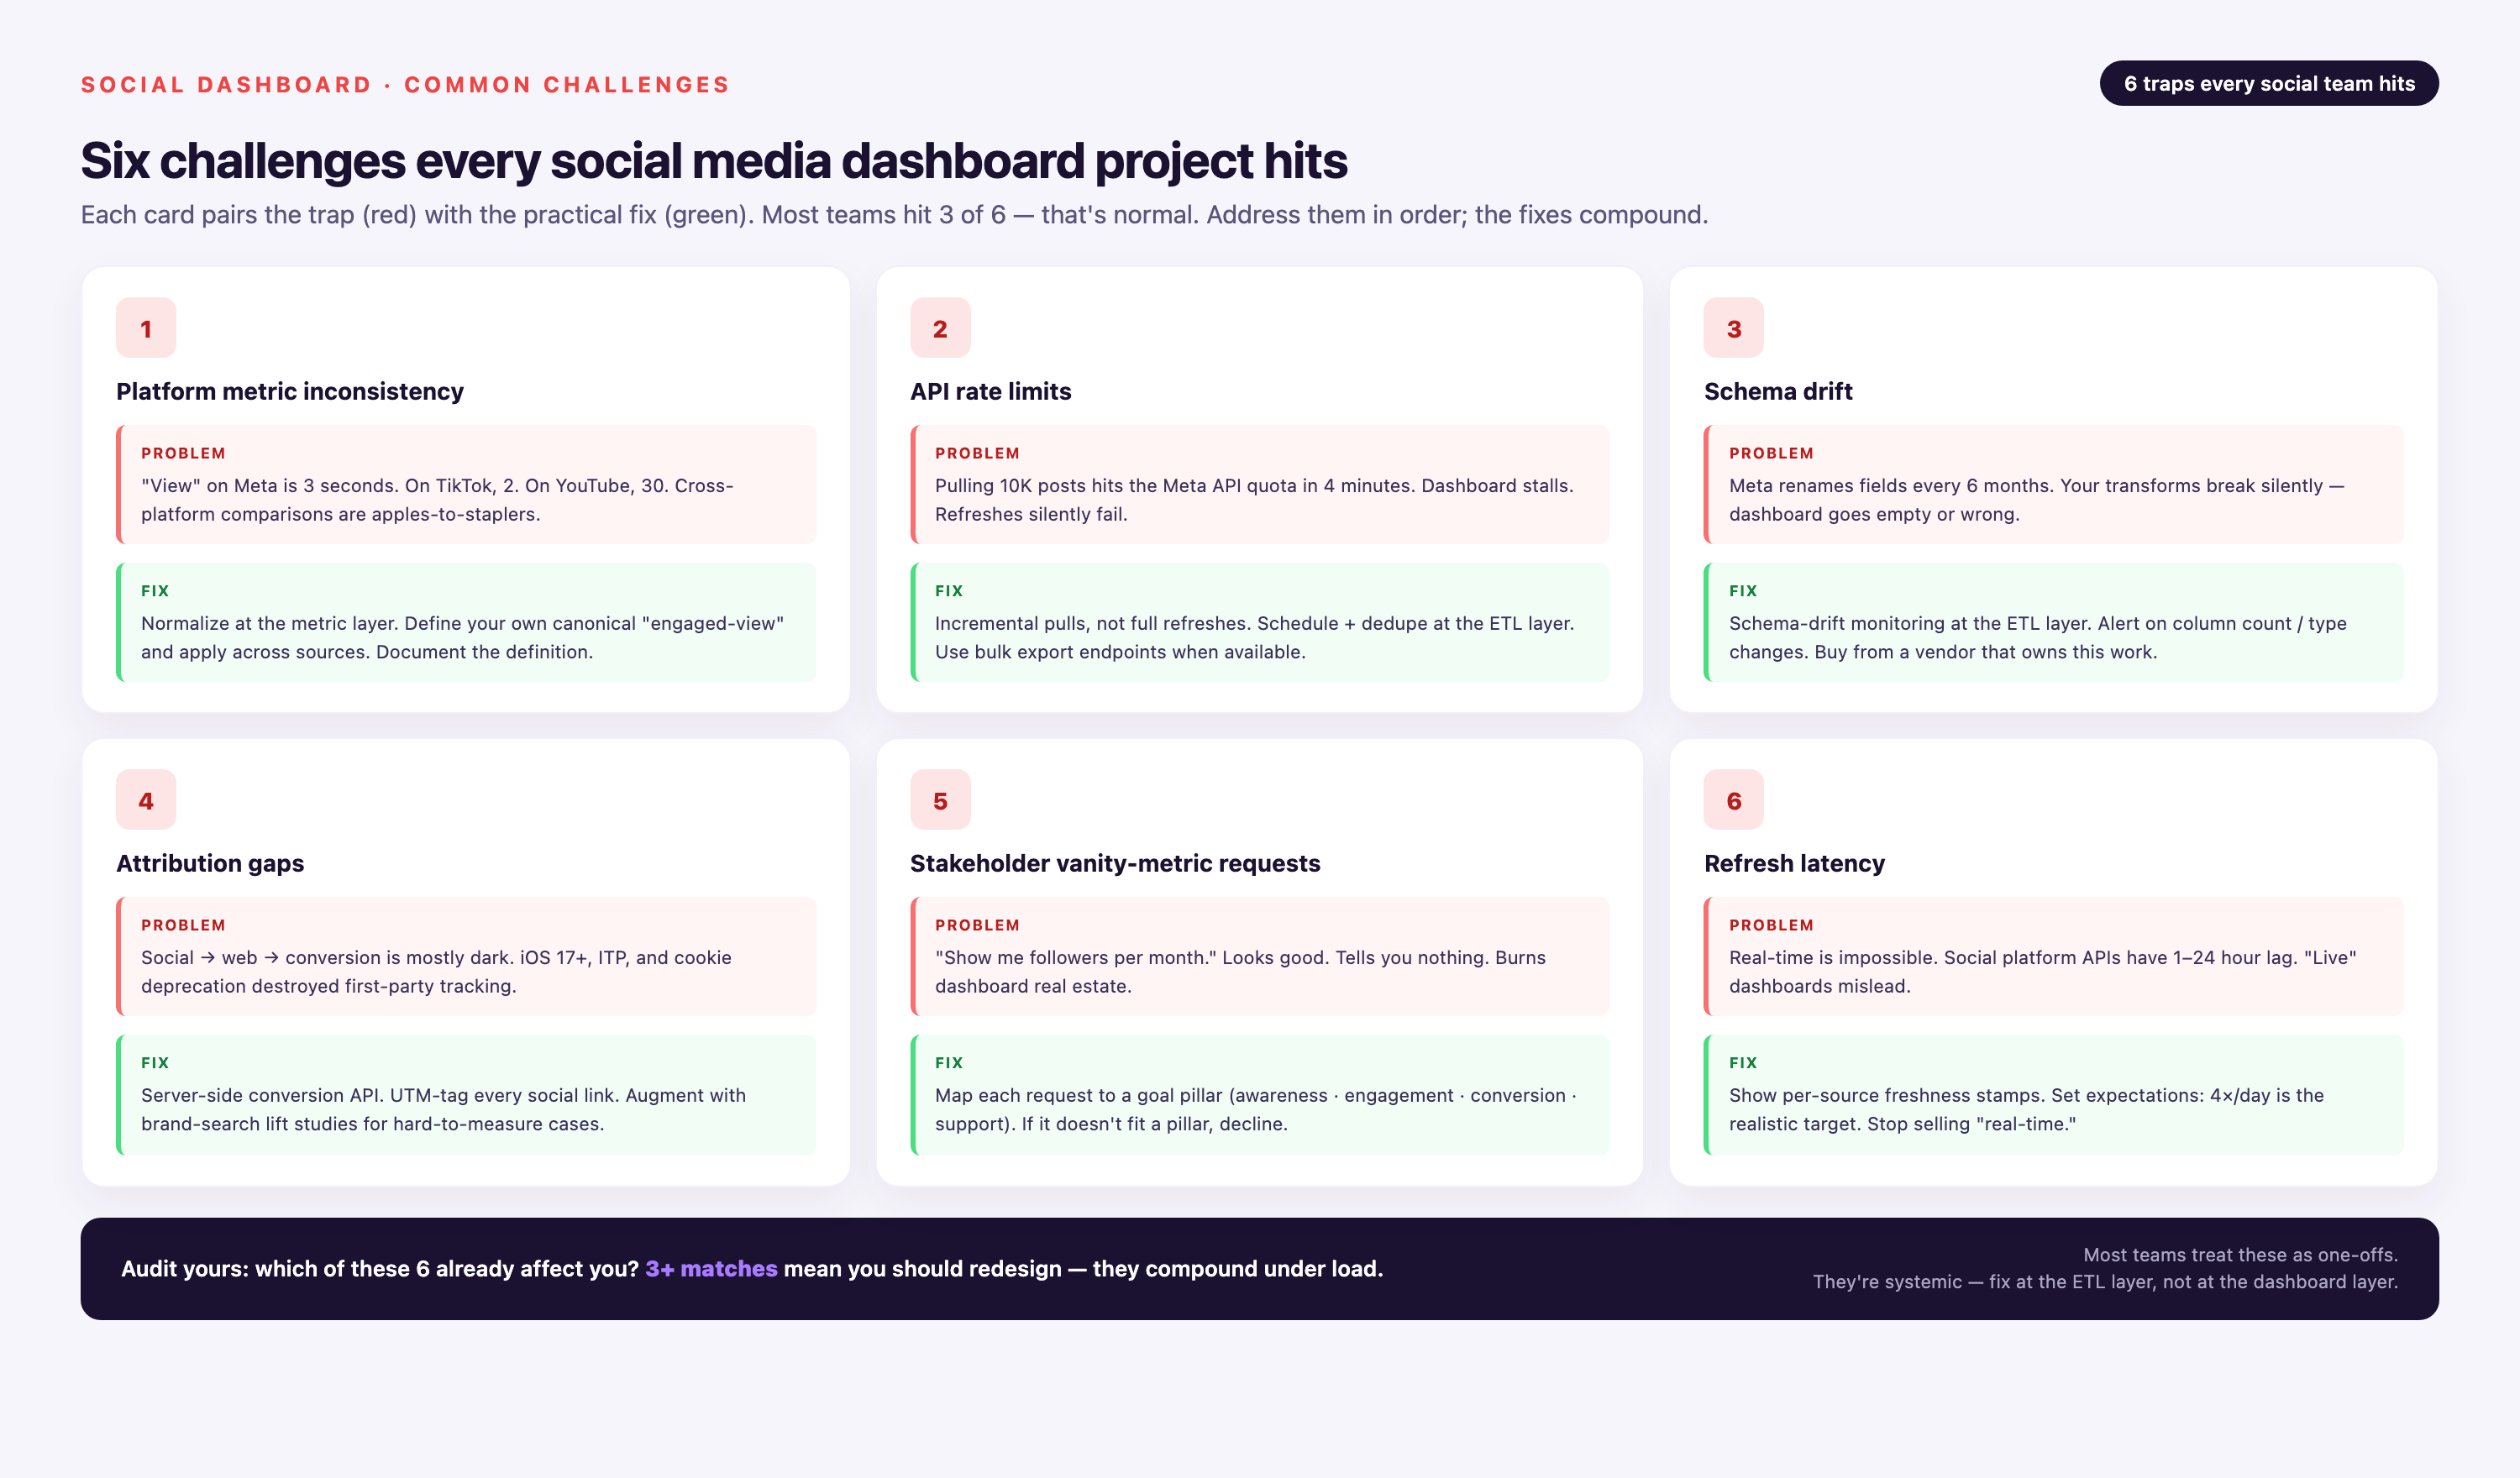
The Data Silo Problem: Centralizing Disparate Platforms
This is the most fundamental challenge. Every social platform is a data silo. When each system stores metrics in isolation, you lose context and waste time stitching insights together manually. For large teams operating across dozens, often hundreds, of marketing and advertising tools, this issue compounds quickly. The result: teams routinely lose 20–40% of their week manually pulling data or waiting on IT and analytics teams to deliver unified reports.
The solution is a centralized data strategy. That means deploying a marketing data pipeline capable of extracting data from every platform and loading it into a single, analysis-ready repository. Centralizing data in this way dissolves silo walls, creates consistent measurement frameworks, and gives decision-makers a complete and trustworthy view of performance.
Improvado enables this transformation by integrating data from 1,000+ marketing platforms into one business-ready dataset, with automated normalization, naming governance, and AI-powered analysis layered on top. With unified dashboards and an AI Agent that can produce insights and answer questions on demand, marketing teams can cut reporting time by up to 75%, reduce data engineering dependencies, and reallocate time toward scaling ROAS and marketing ROI.
Before Improvado, preparing reports at Signal Theory was a labor-intensive process, often taking four hours or more per report. Switching to Improvado reduced that time by over 80%, making reporting significantly more efficient and far less stressful.
"Reports that used to take hours now only take about 30 minutes. We're reporting for significantly more clients, even though it is only being handled by a single person. That's been huge for us.”

Ensuring Data Accuracy and Granularity
Your dashboard is only as good as the data feeding it. It's crucial to ensure data is accurate, complete, and pulled at the right level of granularity.
For example, you need to be able to analyze performance at the campaign, ad set, and individual ad level to make effective optimizations.
Normalizing Metrics Across Different Channels
Every social platform speaks its own analytical language. A “click” on LinkedIn may not equal a “click” on TikTok. Facebook’s definition of engagement differs from X’s.. Attribution windows vary, naming standards are inconsistent, and even seemingly universal metrics like impressions, CTR, or conversions often follow platform-specific logic.
To solve this, teams need consistent metric definitions, standardized naming conventions, and a governed data model that aligns KPIs across every network. Doing this manually is slow, error-prone, and difficult to maintain as APIs evolve and new channels are introduced.
Improvado automates this entire normalization layer. The platform harmonizes metrics across 1,000+ marketing and advertising sources, applying standardized naming logic, attribution rules, and business-ready taxonomies. With AI-powered data transformations, users can generate and modify transformation logic in natural language, no SQL required, accelerating modeling work and reducing reliance on engineering.
Choosing the Right Social Media Dashboard Software
The market is filled with tools. When evaluating solutions, focus on these key areas to find the one that fits your long-term needs.
Key Features to Look For
Look for a solution that offers a comprehensive feature set:
- Broad Data Source Connectivity: Ensure it connects to all the social platforms you use now and might use in the future.
- Automated Data Transformation: The tool should handle data cleaning, mapping, and normalization automatically.
- Customizable Visualizations: You need the flexibility to create reports that match your specific KPIs and branding.
- Alerting and Scheduled Reporting: Automation features are essential for efficiency.
Scalability and the Need for a Data Warehouse
As your marketing efforts grow, so will your data volume. A solution that relies on spreadsheets or simple databases will eventually break. For true scalability, your data needs to be housed in a proper data warehouse like BigQuery, Snowflake, or Redshift. The best dashboard solutions are built on this type of robust infrastructure or can seamlessly deliver data to it.
Customization and Flexibility
Your business is unique, and your dashboard should reflect that. Avoid rigid, one-size-fits-all solutions. The ideal platform provides the flexibility to create custom metrics, design bespoke visualizations, and integrate with any other tool in your marketing technology stack.
Conclusion
By moving away from fragmented, manual reporting to a unified, automated, and real-time social media command center, you unlock the ability to make smarter decisions, faster. You can optimize campaigns with precision, prove your impact on the bottom line with confidence, and free up your team to focus on the creative and strategic work that drives growth.
The journey from data chaos to analytical clarity requires a clear strategy, the right tools, and a commitment to data-driven culture. Whether you choose to build in-house or partner with a platform like Improvado, the investment in a centralized social media dashboard will pay dividends in efficiency, performance, and strategic insight, establishing a solid foundation for your marketing success.