.png)
Your business is flooded with data. Every click, sale, and social media post creates a new data point. You have analytics dashboards, spreadsheets, and reports. Yet, a simple question remains: What does it all mean? Getting clear, actionable answers from your data can feel impossible.
Many professionals believe this is a job only for data scientists. They see data analysis as a complex, technical field beyond their reach. The truth is, you don't need a Ph.D. in statistics to find meaningful answers. You need a framework.
This guide provides a step-by-step process for anyone to ask the right questions, analyze data effectively, and turn insights into impactful business decisions.
Key Takeaways:
- Start with questions, not data: The quality of your answers depends entirely on the quality of your questions. Always define your business question first.
- Follow a 5-step process: A structured approach (Define, Collect, Clean, Analyze, Visualize) removes guesswork and leads to reliable answers.
- Avoid common pitfalls: Be aware of biases like confirmation bias and correlation vs. causation to prevent costly mistakes in your analysis.
- Leverage the right tools: While spreadsheets work for simple tasks, automated platforms are essential for integrating complex data and scaling your analysis efforts.
The Foundation: Why Asking the Right Question Is Half the Battle
Many data projects fail before they even begin. The reason is simple. They start with the data, not the question. People dive into a dataset hoping for a magical insight to appear.
This approach is like starting a journey without a destination. You will wander aimlessly and likely end up nowhere.
A well-defined question provides focus. It guides your entire data analysis process. It tells you which data to collect, what analysis to perform, and how to interpret the results. Without a clear question, data is just a collection of numbers.
The Difference Between Vague and Actionable Questions
Not all questions are created equal. A vague question leads to a vague answer. An actionable question leads to a specific, measurable insight that can drive a decision.
- Vague question: "How is our marketing performing?"
- Actionable question: "Which of our top three marketing channels generated the highest customer lifetime value (CLV) in Q2 for new customers acquired?"
The second question is powerful. It specifies the channels, the metric (CLV), the time frame (Q2), and the customer segment (new). Answering it provides a clear direction for allocating marketing budget.
How to Formulate a SMART Data Question
The SMART framework, often used for goal setting, is perfect for crafting data questions. It ensures your inquiry is focused and your answer will be useful.
- Specific: What exactly do you want to find out?
- Measurable: How will you quantify the answer? What metrics will you use?
- Achievable: Do you have access to the data needed to answer the question?
- Relevant: Why is this question important? How will the answer help the business?
- Time-bound: What is the specific time frame for your analysis?
Involving Stakeholders to Define Business Questions
The best data questions come from business needs. Talk to stakeholders from marketing, sales, product, and finance. Understand their challenges and goals.
What decisions are they struggling to make?
Collaborating with stakeholders ensures your data analysis is relevant. It connects your work directly to business value. This makes it much easier to get buy-in for the decisions your data answers support.
The 5-Step Framework to Get Data Answers
Once you have a strong question, you need a structured process to find the answer. This five-step framework provides a reliable path from question to insight. It helps you stay organized and ensures your analysis is thorough and accurate.
Step 1: Define Your Business Question Clearly
This is your foundation. We covered it above, but it's worth repeating. Write down your SMART question. Make sure everyone on your team understands it. This question will be your north star throughout the process.
Step 2: Identify and Collect the Relevant Data
With your question defined, you now know what data you need. List all the potential data sources. This could include your CRM, Google Analytics, social media platforms, ad networks, and customer support software.
The goal is to gather all the necessary pieces of the puzzle.
Step 3: Clean and Prepare Your Dataset for Analysis
Raw data is almost always messy. It contains errors, duplicates, and missing values. This "dirty" data can lead to wrong answers. Data cleaning is the critical process of fixing these issues. It ensures your dataset is accurate, consistent, and ready for analysis.
Step 4: Analyze the Data to Find Patterns and Trends
This is where you explore the data to find the answer to your question. You might calculate averages, look for correlations, or segment the data into groups. The specific techniques depend on your question. The goal is to uncover the story hidden within the numbers.
Step 5: Visualize and Communicate Your Findings
An answer is useless if no one understands it. Data visualization turns your findings into charts and graphs. This makes complex information easy to digest. A clear presentation helps stakeholders grasp the key insights quickly and confidently make data-driven decisions.
Gathering Your Evidence: Finding and Collecting the Right Data
The quality of your data directly impacts the quality of your answers. You cannot create a masterpiece with poor-quality ingredients. The same is true for data analysis. It is vital to identify and gather clean, relevant data from all necessary sources.
Identifying Your Primary Data Sources
Your business uses many different tools. Each one holds a piece of the puzzle. To answer a question like "What is our marketing ROI?", you might need data from:
- Google Ads & Facebook Ads: For ad spend and impressions.
- Google Analytics: For website traffic and conversions.
- Salesforce or HubSpot: For lead data and sales revenue.
- Stripe or Shopify: For transaction details.
The Challenge of Siloed Data and How to Overcome It
Marketing data often lives in disconnected systems that don’t communicate. These silos make it difficult and slow to combine metrics, compare performance, or answer even basic questions. Manual exports and spreadsheets introduce errors and delay decisions.
Improvado removes this barrier by automatically integrating data from 1,000+ marketing, analytics, and revenue platforms into a single, unified environment. It standardizes metrics, resolves naming mismatches, and keeps everything updated in real time. With clean, connected data, teams get reliable answers without manual effort.
Preparing Your Data for Interrogation: Cleaning and Transformation
Data preparation is often the most time-consuming part of the analysis process. Some experts say it can take up to 80% of the total time. While it's not glamorous, it's absolutely essential. Skipping this step is a recipe for disaster.
What is Data Cleaning and Why Does It Matter?
Data cleaning involves standardizing formats, correcting errors, and handling missing values. Imagine trying to calculate total sales when some entries are in USD and others are in EUR without a currency label. The result would be meaningless. Cleaning ensures every piece of data is consistent and comparable.
Common Data Issues: Duplicates, Missing Values, and Inconsistencies
Be on the lookout for these common problems:
- Duplicate records: The same customer or sale entered multiple times.
- Missing data: Empty cells where information should be.
- Structural errors: Typos, inconsistent capitalization, or extra spaces.
- Outliers: Extreme values that might be errors or could represent a significant event.
The Role of an ETL process in Preparing Data
For complex datasets, an automated approach is necessary. The ETL process (Extract, Transform, Load) is a cornerstone of modern data management. It automates the work of pulling data from sources (Extract), cleaning and standardizing it (Transform), and loading it into a central repository for analysis (Load). This process ensures your data is always analysis-ready.
Choosing Your Analysis Method: From Spreadsheets to Advanced Platforms
With clean data, you're ready for analysis. The tool you choose depends on the complexity of your question and the size of your dataset. Each method has its own strengths and weaknesses.
Manual Analysis using Spreadsheets (Excel, Google Sheets)
Spreadsheets are familiar and accessible. They are great for small datasets and simple questions. You can use pivot tables, formulas, and basic charting to find answers. However, they become slow and unwieldy with large amounts of data. They also make collaboration and version control difficult.
Using Business Intelligence (BI) Tools for Deeper Insights
BI tools like Tableau, Power BI, or Looker Studio are a major step up. They can handle larger datasets and offer advanced visualization options. They allow you to create interactive dashboards that stakeholders can explore. However, they often require some technical skill to set up and manage data connections.
The Power of Automated Analytics Platforms
Automated platforms like Improvado combine data integration, transformation, and visualization in one place. They are designed to handle the complexity of modern data ecosystems. These platforms remove the manual work, allowing you to focus on asking questions and interpreting results, not wrestling with data prep.
| Feature | Manual Spreadsheets | Business Intelligence (BI) Tools | Automated Platforms (Improvado) |
|---|---|---|---|
| Speed | Slow; highly manual process. | Moderate; faster once set up. | Fast; data is always live and analysis-ready. |
| Accuracy | Low; high risk of human error. | High; reduces manual mistakes. | Very High; automated checks ensure data integrity. |
| Scalability | Poor; struggles with large datasets. | Good; designed for large-scale analysis. | Excellent; built for massive, complex datasets. |
| Data Integration | Manual; copy-pasting or CSV uploads. | Requires connectors; can be technical. | Automated; hundreds of pre-built connectors. |
| Skill Level Required | Basic to intermediate spreadsheet skills. | Intermediate to advanced technical skills. | Beginner-friendly; focus on insights, not tech. |
| Best For | Quick, one-off analysis on small data. | Dedicated analysts creating complex dashboards. | Teams needing fast, reliable cross-channel answers. |
Artificial Intelligence and AI Agents
Artificial intelligence represents the next major shift in how organizations analyze data. Instead of relying solely on dashboards or manual exploration, AI Agents interpret large datasets automatically and deliver insights in real time. They reduce the cognitive and operational load of analysis by handling tasks that previously required analysts, SQL queries, or multiple BI tools.
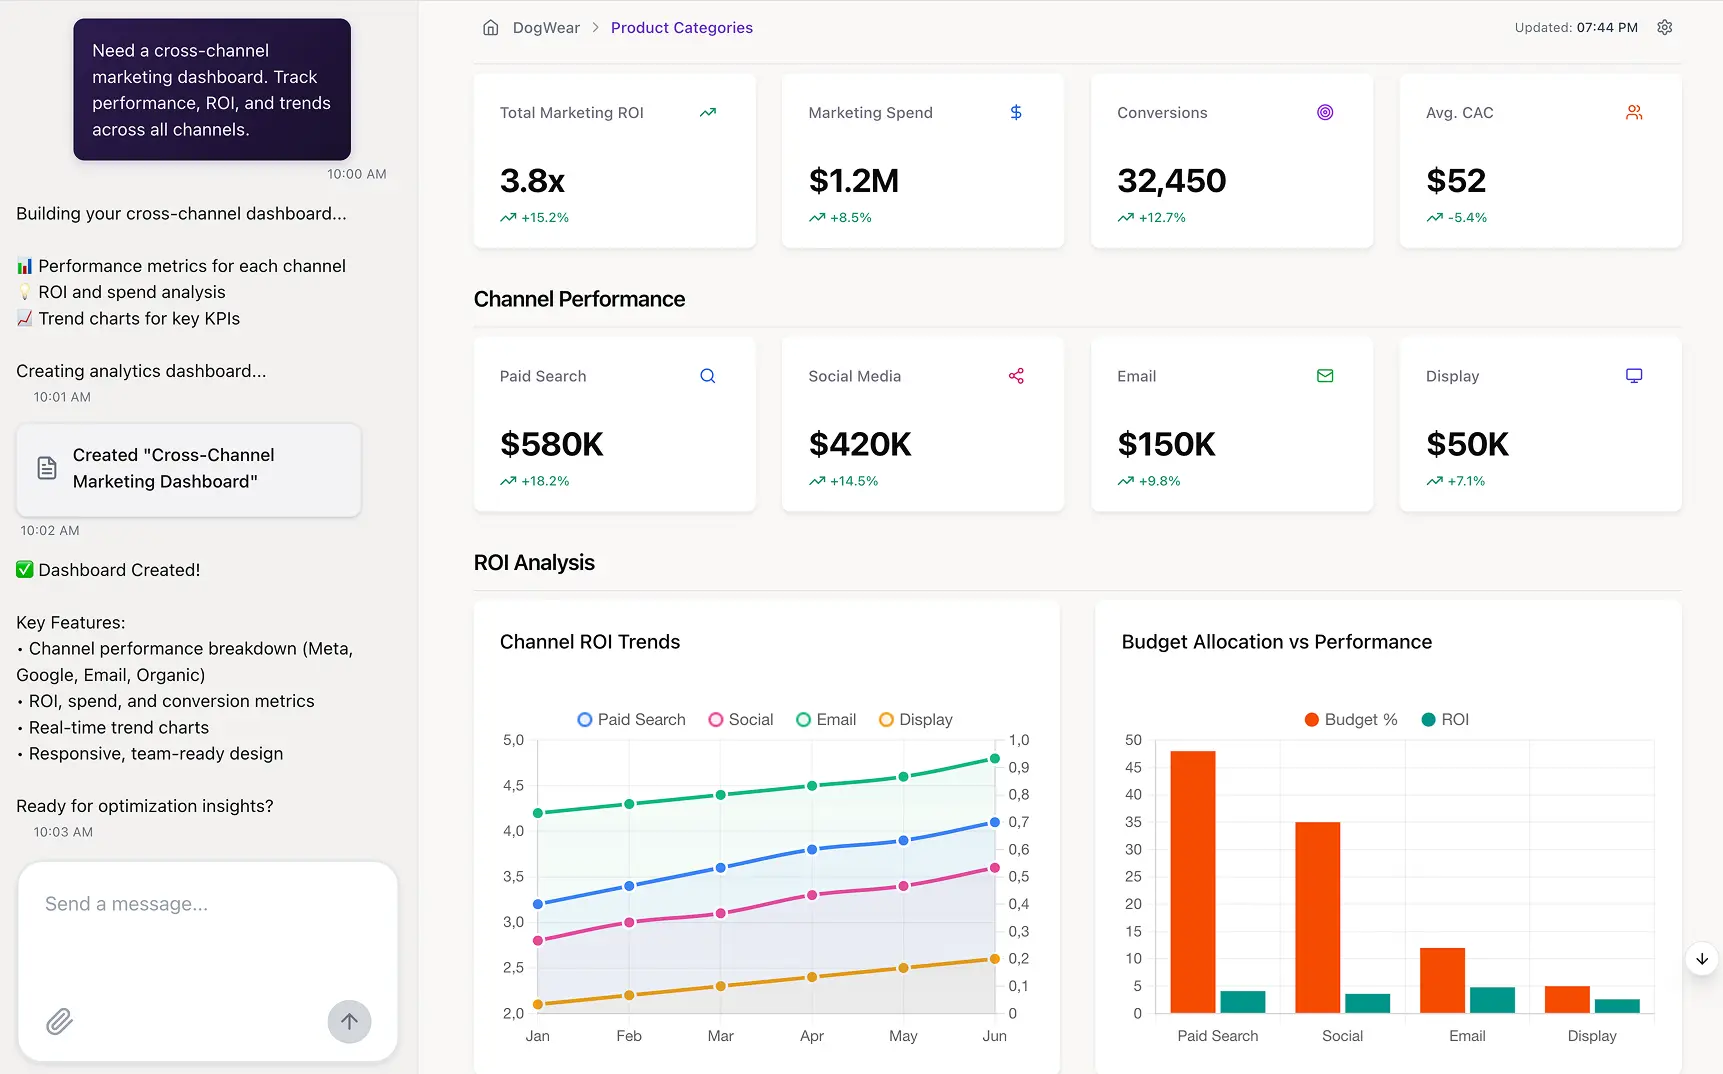
Improvado’s AI Agent is an example of this evolution. It sits on top of your unified, governed data foundation and allows you to interact with your entire marketing and revenue dataset through natural language. You ask a question, and the Agent analyzes the data, selects the right metrics, and returns a precise, contextualized answer in seconds.
AI Agents can:
- Summarize performance across channels, campaigns, or regions
- Diagnose anomalies and explain what caused changes
- Build dashboards and executive-ready report sections
- Provide pacing insights and optimization recommendations
- Automate recurring updates for stakeholders
This turns analytics into a conversational workflow. Instead of navigating tools or waiting for custom analysis, teams get immediate answers supported by consistent, high-quality data. AI-driven analysis becomes not just faster, but more accessible and more reliable across the organization.
I use Improvado AI Agent to get basic analytics and quick solves. I just enter the question, and it gives me the answer I need.

Common Data Analysis Traps and How to Avoid Them
As you analyze data, your own human biases can lead you astray. Being aware of these common mental traps is crucial for objective analysis. It helps you avoid making expensive mistakes based on flawed interpretations.
Trap #1: Confirmation Bias and Presuppositions
Confirmation bias is the tendency to favor information that confirms your existing beliefs. If you believe a certain ad campaign was successful, you might unconsciously look for data that supports this belief and ignore data that contradicts it. To avoid this, play devil's advocate. Actively search for evidence that could disprove your hypothesis.
Trap #2: Mistaking Correlation for Causation
This is a classic error. Just because two things happen at the same time doesn't mean one caused the other. For example, ice cream sales and shark attacks both increase in the summer. This is a correlation. The cause is the hot weather, which drives people to both swim and eat ice cream. Always question whether a relationship is causal or just a coincidence.
Trap #3: The Allure of Simple Explanations
When you see a change in a metric, it's tempting to jump to the first simple explanation, like seasonality. While it might be the answer, don't stop there. Dig deeper. Could there be other factors at play? A competitor's campaign? A change on your website? A bug? A thorough analysis explores multiple possibilities before settling on an answer.
Trap #4: P-Hacking and Misinterpreting Statistical Significance
This is common in A/B testing. P-hacking occurs when you stop a test as soon as it shows a "statistically significant" result. Random fluctuations can create temporary significance. It's crucial to let tests run for their intended duration to get a reliable answer. A result that seems significant on day two might disappear by day ten.
From Data to Decisions: Answering Specific Business Questions
Let's apply this framework to some real-world examples. The process remains the same, but the data sources and analysis techniques will change based on the question.
Question: "Which marketing channel has the best ROI?"
To answer this, you need to connect ad spend data with revenue data. This requires sophisticated marketing attribution to understand which touchpoints led to a sale. A central data warehouse is often required to store and join these disparate datasets for accurate analysis.
Question: "Why did our website traffic drop last month?"
This question requires a detective's mindset. You'll need to break down traffic by source (organic, paid, social), by device, and by geography. Was the drop across the board, or was it isolated to one area? You would analyze data from Google Analytics, Google Search Console, and your ad platforms to pinpoint the cause.
Question: "Who are our most valuable customer segments?"
Here, you would analyze customer data from your CRM and transaction data from your payment processor. You might segment customers by demographics, purchase history, or frequency. The goal is to identify the characteristics of customers with the highest lifetime value so you can find more people like them.
Scaling Your Data Capabilities: Tools and Strategies
As your business grows, so does your data. The manual methods that worked in the beginning will eventually break. To continue getting timely and accurate answers, you need to scale your tools and processes.
The Limitations of Manual Data Handling
Relying on spreadsheets and manual downloads is not sustainable. It's slow, error-prone, and doesn't provide a real-time view of your business. Your team ends up spending more time gathering data than analyzing it, which is a huge waste of valuable talent.
Leveraging reporting automation to save time
The first step toward scaling is automation. Implementing reporting automation frees your team from tedious, repetitive tasks. Reports can be generated and distributed automatically, ensuring everyone has access to the latest data without any manual effort.
Why data integration tools are essential for growth
To get a complete picture of your business, you must break down data silos. This is where data integration tools become a non-negotiable part of your tech stack. They ensure that all your data flows into a single source of truth, providing the holistic view needed for strategic decision-making.
Choosing the right marketing analytics platform for your team
Ultimately, a dedicated platform is the key to truly scalable analytics. When evaluating options, consider factors like the number of integrations, ease of use, and customer support. The goal is choosing the right marketing analytics platform that empowers your entire team to self-serve and get their own data answers.
Fostering a Data-Driven Culture in Your Organization
Tools are only part of the solution. To truly succeed, you need to build a culture where data is at the heart of every decision. This means empowering everyone, not just analysts, to engage with data confidently.
How to Train Your Team to Ask Data Questions
Start by teaching the SMART framework for questions. Run workshops using real business problems. Encourage curiosity and create a safe environment where people feel comfortable asking "dumb" questions. The more people practice, the better their questions will become.
Making Data Accessible to Non-Analysts
Democratize your data. Use user-friendly tools and dashboards that allow people to explore data without needing to write code. Provide training and resources to help them understand the key metrics and how to interpret them. The goal is to make data a daily resource for everyone.
Celebrating Data-Informed Wins
When a decision based on data leads to a positive outcome, celebrate it. Share the story across the company. Highlight how a specific insight led to a successful campaign or product improvement. This reinforces the value of data and encourages others to adopt a similar approach.
Advanced Techniques for Deeper Data Answers
Once you've mastered the fundamentals, you can explore more advanced techniques to uncover even deeper insights. These methods can help you move from explaining what happened to predicting what will happen next.
Introduction to Predictive Analytics
Predictive analytics uses historical data to forecast future outcomes. For example, it can identify customers who are likely to churn or predict which leads are most likely to convert. This allows you to be proactive and take action before an event occurs.
Using Machine Learning to Uncover Hidden Patterns
Machine learning algorithms can analyze vast datasets to find complex patterns that a human analyst would never see. This can be used for sophisticated customer segmentation, product recommendations, or detecting fraudulent activity.
Understanding complex customer journeys with marketing attribution
Modern customer journeys are complex, often spanning multiple devices and channels. Advanced marketing attribution models use data science to assign proper credit to each touchpoint. This provides a much more accurate answer to the critical question of marketing ROI.
Conclusion
Getting answers from your data is ultimately a workflow problem, not a talent problem. You need clean inputs, unified sources, consistent metrics, and fast access to insights. Improvado provides this end-to-end foundation. Its automated data pipeline pulls information from every marketing, analytics, and revenue platform, standardizes it, and prepares it for reliable analysis. This removes the manual reconciliation and spreadsheet work that slows teams down and introduces errors.
Once the data foundation is in place, Improvado’s AI Agent unlocks the final step: instant insight. Instead of digging through dashboards or waiting for custom reports, you simply ask a question in natural language. The AI Agent analyzes the unified dataset, generates clear explanations, builds visualizations, and delivers answers in seconds. It turns complex analysis into a fast, repeatable workflow accessible to anyone on the team.
If you want to move from slow, fragmented reporting to a system where answers are immediate and trustworthy, request a demo of Improvado.
“Improvado allows us to have all information in one place for quick action. We can see at a glance if we're on target with spending or if changes are needed—without having to dig into each platform individually.
On the reporting side, we saw a significant amount of time saved! Some of our data sources required lots of manipulation, and now it's automated and done very quickly. Now we save about 80% of time for the team.”