Enhance marketing intelligence with AI-integrated data
GET A DEMO
AI-fueled marketing dashboards
All
Take full control of all your marketing data

The 3+1 Categories of Digital Analytics Tools [Picking a Right One]

The market of digital analytics solutions is going through some fundamental changes right now. Google has just announced the sunset of Universal Analytics (also known as “the ‘better’ Google Analytics”) next year, while the market is moving towards cookieless tracking, server-side implementations, all while trying to comply with GDPR and other new regulations.

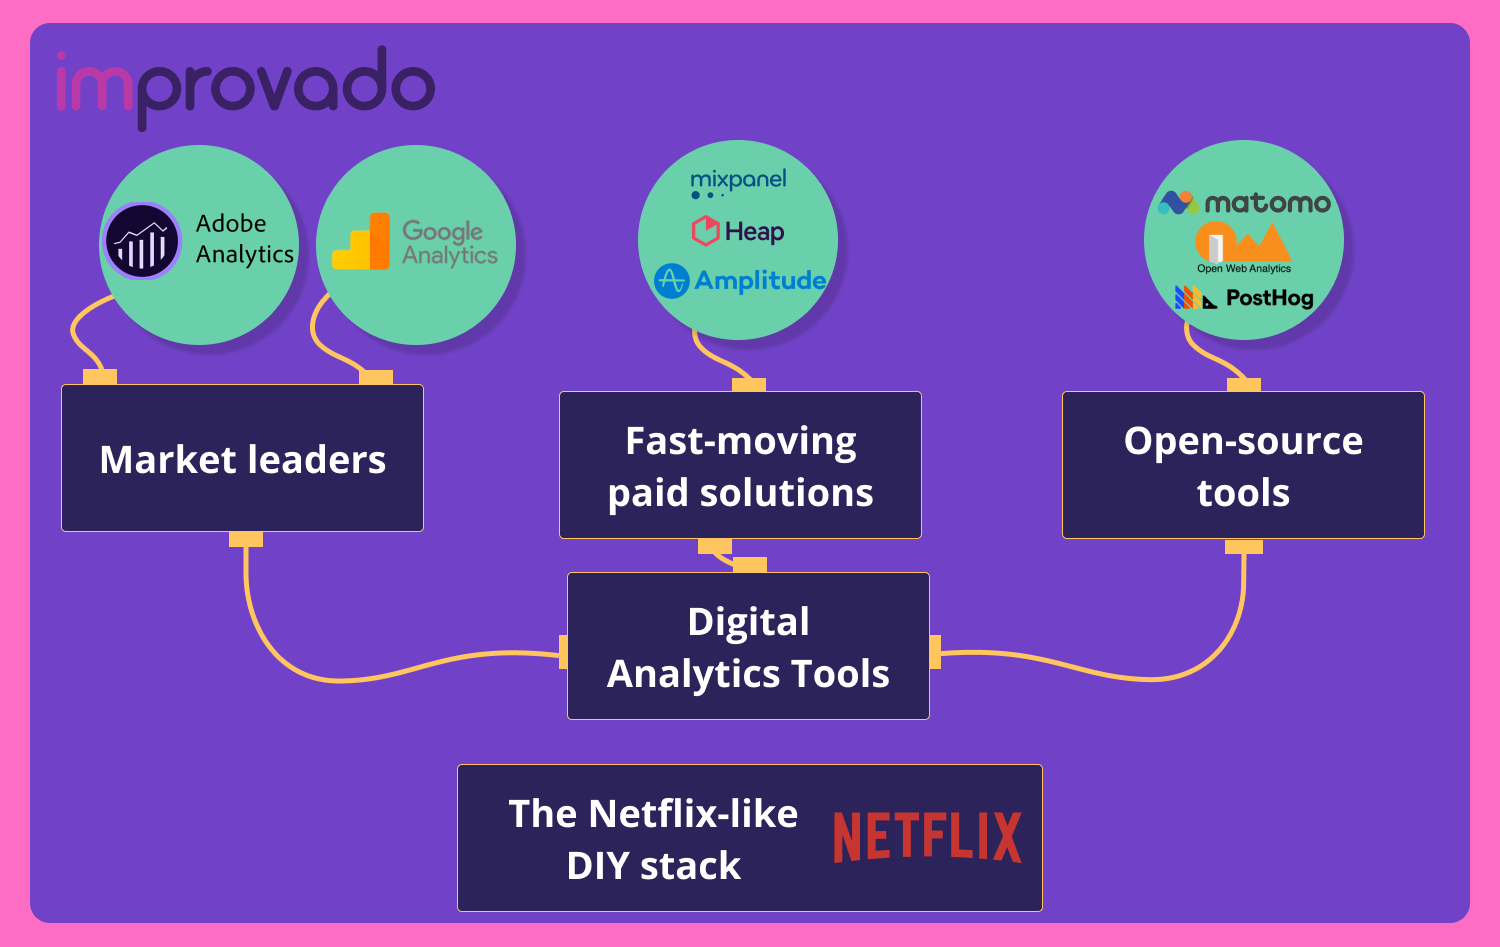
Many of those trends force companies to reconsider their choices of digital analytics solutions to comply with legal requirements or future-proof their analytics practice. However, not all digital analytics tools are the same. In fact, recent years have revealed four distinct categories of tools. Instead of only choosing a tool, companies oftentimes unconsciously decide on tool categories instead.

This article intends to show and explain the different categories of solutions while also giving you some examples of the tools in each category. 

At the end of the article, you will also find some important questions you should ask yourself when choosing a category or even a specific tool. You will be able to confidently choose the right category for your business and challenge the preconceived assumptions you might be confronted with. Let’s get moving.
categories of analytics tools
3+1 categories of digital analytics tools

Category #1: the market leaders

By installations: Google Analytics

By maturity: Adobe Analytics

Category #2: fast-moving paid solutions

Category #3: open-source DIY solutions

Bonus category: the Netflix-like DIY toolstack

Category #1: the market leaders

The first category of Digital Analytics Solutions contains only two tools:

  • The market leader by tool maturity. Adobe Analytics is the most mature tool in the current market. 
  • The market leader by install base. Google Analytics is a leading digital analytics tool in this category. 

It says a lot that there is more than one tool in this category, as it shows that the most adopted solution is not always the most feature-rich or mature tool available. Let’s take a look at both tools individually.

Google Analytics

Google Analytics is by far the most well-known solution on the market. For many people working in or with digital experiences, it is synonymous with digital analytics. Its enormous install base is largely driven by the free base tier that allows anyone to open an account and start collecting data. Some of the limitations of the free Google Analytics version, like data sampling or a limited number of events per month, can be mitigated by buying the paid version.
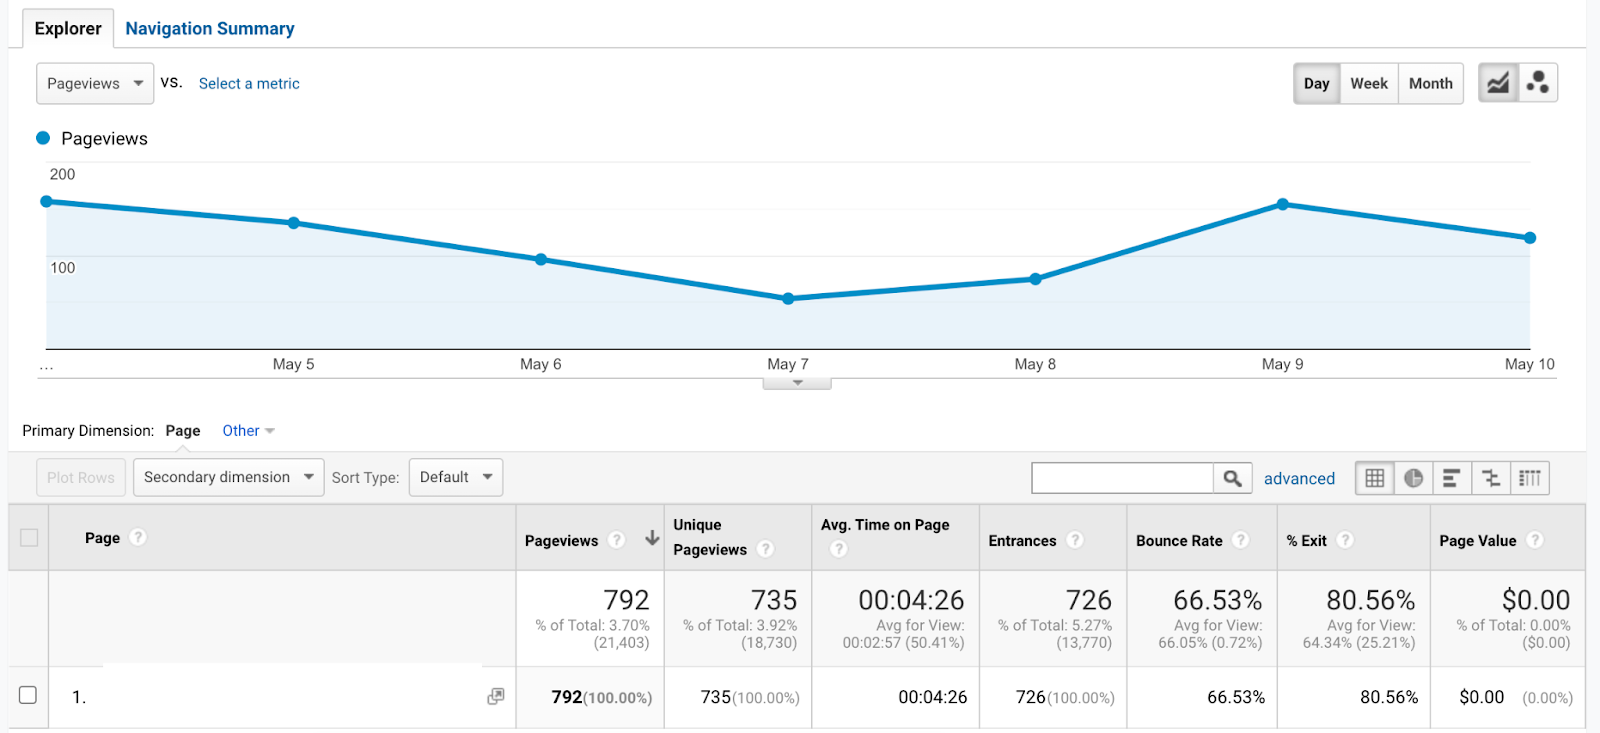
Google Analytics content dashboard
Google Analytics site content dashboard

The paid version is especially attractive for larger websites. It can help to avoid the particularly annoying problem of sampled data and also allows for more than 10 million hits per month. On top of that, the paid version brings more advanced reporting capabilities like rollups from mixed sources or custom tables. Because the base version is free, the percentage of paying customers is comparatively low, making the paid version somewhat of a statistical anomaly.

While some people see Google Analytics as a stand-alone solution, especially the free version should be seen as an extension of Google Ads. A big portion of the product is tailored to marketing use cases with very little customizability for other applications. For example, Google Analytics provides some useful marketing features, such as:

  • Acquisition Source reports
  • Google Ads campaigns and metrics
  • Google Search keywords and metrics
  • Some high-level page performance reports

Because of those built-in reports, a lot of marketing executives see Google Analytics as the only tool they ever need. While this makes it easy to get the feeling of knowing what is going on on a page, there is not a lot of customizable information available beyond traffic acquisition.
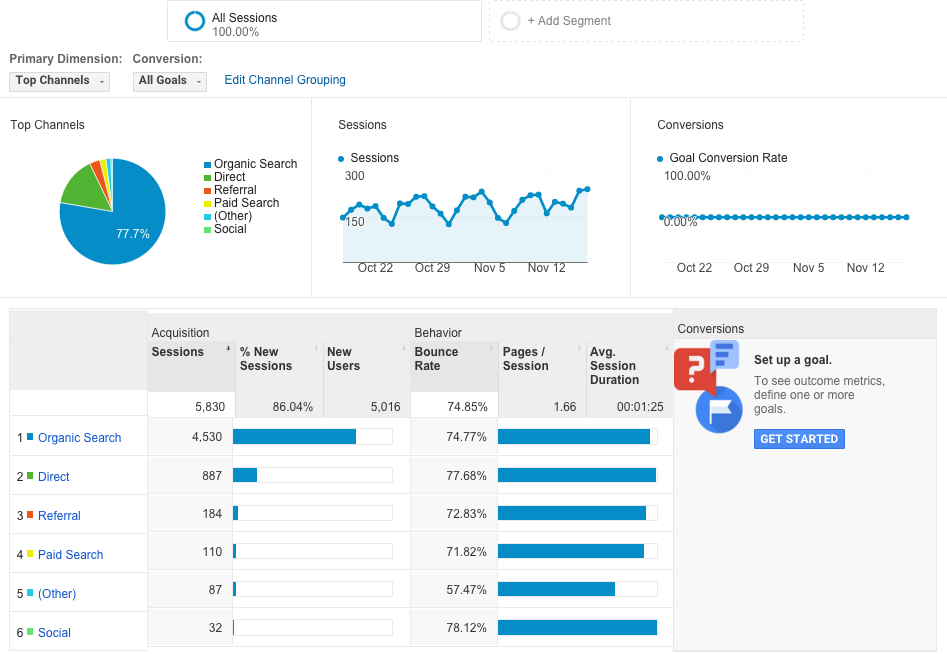
Google Analytics acquisition
Google Analytics traffic acquisition dashboard

To analyze more complex business questions or even allow for dashboarding, many companies combine Google Analytics with Big Query and Data Studio. This allows to cover more use cases but introduces a high entry threshold for any non-analytic user and can hinder agility when it comes to data democratization.

While there are some potential barriers to more complex use cases, every comparison should mention the impressively big and vibrant community around Google Analytics, Big Query, Data Studio, and also Google Tag Manager. Industry leaders like Simo Ahava regularly contribute stellar content to drive value for customers. Thanks to Google Tag Manager’s template system, it is easy to profit from the effort community members have put into the product.

Adobe Analytics

Adobe Analytics is the other solution in the category of market-leading digital analytics tools. While it is well known in the space of enterprise applications, not everyone outside of the digital analytics community has even heard of it. While there is no free tier available, the cost for the tool can be even lower than for the paid version of Google Analytics.

Adobe Analytics Google Analytics
Entry tier ~$30,000 per year Free
Regular tier Depends on event volume $150,000 per year

For marketing analytics use cases, Adobe Analytics can offer all the features of Google Analytics and even more. Even non-Adobe data like Google Search Keywords or Google Ads data can be used to build reports and dashboards due to a wide range of available connectors and integrations. Thanks to the deep levels of customizability, the features don’t stop with marketing analytics but cover product analytics use cases just as well.

📊Learn how to build granular marketing reports with Adobe Analytics Data Feed📊

Besides the general features, one innovation sets Adobe Analytics apart from other competition on the market: the main user interface, called Analysis Workspace. Analysis Workspace allows the whole company to work in a shared environment that covers day-to-day reporting, dashboarding, as well as deep-dives, and data science use cases. It offers best-in-industry collaboration capabilities that scale across the whole company, bringing together marketing, product, and analytics in a truly unique way.

Adobe Analytics interface
Adobe Analytics: Analysis Workspace interface

On the downside, the flexibility and customizability of Adobe Analytics often lead to the sentiment that it is an unwieldy and complicated tool. Especially when compared to Google Analytics, Adobe Analytics can feel a little bit “empty” when you first implement it.

Similarly, Google provides some more guardrails through the report-like interface where Adobe will allow you to combine everything with everything, potentially creating misleading or confusing results.

Apart from the two market leaders, there are many more analytics tools on the market, leading us to the next category.

Learn how Improvado can help you aggregate data across CRMs, CDPs, and other platforms

Explore

Category #2: fast-moving paid solutions

Not every tool can be a market leader. This category contains all the tools that are professionally developed and sold to companies but don’t have the maturity or install base of the market leaders.

This category covers many different tools, such as Amplitude, Mixpanel, Heap, and many others. There are some striking similarities between tools of this category. Many of them differentiate themselves from Google Analytics, for example, by emphasizing a focus on product analytics beyond just marketing analytics. Others offer special capabilities that can be highly relevant to a certain audience, such as cohort analysis or measuring the impact of new features. 

Tools like Amplitude have earned a reputation for being built explicitly for startups, product-driven teams, and developer-heavy environments.

Amplitude dashboard

Just like many marketers see Google Analytics as the only tool they will ever need, tools from this second category can be seen the same by product teams. A lot of the tools in this category even go beyond high-level analytics features by offering session recording, A/B testing, or even user-level CRM-like data. While Google Analytics focuses on websites, many of these tools prioritize apps or even cross-device use cases.

On the other hand, many of them lack basic functionalities expected from a marketing analytics product. Users migrating from Google Analytics will be missing integrations with Google Ads or Google Search Console immediately, together with a user-friendly way to correlate fluctuations in traffic to marketing activities.

The most prevalent form of customer growth for tools from this category is to offer a free tier limited by the number of users, sessions, or events that can be tracked and the available features. This simplifies trying out a product but can lead to confusing scenarios. For example, a discussion about the tools can only be held considering the product tier the customer is paying for, leaving out potentially critical features to higher product tiers.

In contrast to both Google Analytics and Adobe Analytics, tools of this category usually do not come with a dedicated Tag Management System like Google Tag Manager or Adobe Launch. This complicates the deployment of tools to a page or app without tightly integrating the user experience into the analytics tool, potentially creating technical debt that can slow down product development cycles.

Another caveat when opting for a tool of this category is the limited scalability. Analysts from large companies describe tools of this category as not very responsive when working with large amounts of data, especially with sudden increases in data volume. 

On top of that, the limited use cases and specialized interfaces can make it hard to collaborate on the data for the whole company, making the product or analytics teams the siloed owners of the data. Companies might end up using Google Analytics for traffic acquisition and a separate, dedicated tool for product analytics.

On the positive side, the smaller company size and install base makes those tools potentially more innovative and agile in trying out new product features. Their strong focus on a core audience and few use cases allow them to react quickly to customer needs and new innovations in the industry. 

Especially larger customers of those tools usually have direct access to the product teams that develop the tools. This makes it easier for the customers to emphasize their wishes for new product features that might become a reality sooner. It is not unusual for vendors and clients to communicate directly in open Slack channels to provide guidance or spot bugs.

Category #3: open source DIY solutions

In our third category of Digital Analytics tools, we find all the tools your IT department will find on Google when searching for alternative solutions to the ones mentioned above. 

Some popular tools from this category are Matomo, Open Web Analytics, and Post Hog. As well as the previous category, these tools aren't the market leaders by maturity or install base. The openly available source code sets them apart from the previous category, usually offering an option to self-host the tool as an alternative to the previous SAAS offerings.

Self-hosting means your company is the only owner and processor of your data. You don't have to share the data with third-party vendors or other external sources. 

With on-premise deployment, data privacy depends solely on what you do with the data. You don't have to rely on the GDPR-compliance of third-party vendors when you can take all measures of caution by yourself.

In addition to the self-hosted version, some vendors and communities have created hosted options that allow for a managed instance of the tool. This option may be attractive to companies who are aware of the big availability responsibilities that come with hosting their own analytics tool. 

However, many of those companies are then surprised by the quickly rising cost of hosting for any sufficiently responsive application. While Google Analytics’ paid version allows for around one billion hits per month at $150,000 per year, Matomo’s hosting would cost $175,000 per year for only 100 million monthly hits.

Many of the tools are heavily inspired by Google Analytics, both considering the user interface and the available reports. Just like Google Analytics, they are heavily focused on analyzing websites but lack the features to analyze mobile apps or connected devices. Through their focus on first-party data, they often lack some very basic functionality that we have become accustomed to from Google Analytics. 

Companies migrating from Google Analytics today because of privacy considerations will be disappointed to find very few integrations with marketing tools like Google Ads and often very rudimentary campaign tracking capabilities.

Open Web Analytics is a good example of another important limitation of this category: uncertain long-term support. Since those tools are usually developed by a community of enthusiasts without obligations, there is no guarantee that it will still be supported in a year from now. Especially smaller projects can die, even shortly after they are announced, due to a lack of community engagement. Just like the previous category of tools, the tools that fall into this category usually don’t offer a way to manage the implementation, such as a Tag Management System.

A positive side to this group is the definite advantage of hosting the complete analytics stack on first-party servers. Even some cookieless solutions are available that position themselves to be extra-GDPR compliant. 

However, the ever-changing legal landscape makes legal compliance a quickly moving target, so companies should carefully evaluate their options to not jump on a seemingly compliant solution purely on GDPR compliance.

One final word of warning: While your IT department might find it an interesting challenge to host an analytics tool on company servers, they should be aware of the big responsibilities that come with that. Hosting such a tool means ensuring that data collection is always available from around the world. Once traffic levels surpass certain thresholds, providing a responsive database and, therefore, usable frontend experience to analysts and business users becomes a difficult and expensive task.

Learn how cross-channel marketing analytics help your company reach out to your audience

Bonus category: the Netflix-like DIY stack

Recent years have brought a trend of replicating what digital-native companies like Netflix have built. With a laser focus on excellent user experiences through personalization and iterative testing, products are often designed with a global event feed that contains every user interaction and gets funneled into various activation channels.

Companies utilizing a setup like this would commonly use open source components (in contrast to complete open-source analytics systems) in a highly customized way. They may collect data using Snowplow in the user’s clients, feed server logs into Kafka, store the data in AWS’ S3 and analyze it using AWS Redshift or fully customized visualization tools.

Netflix Chukwa pipeline

Because of this very technical and sophisticated setup, analytics teams usually consist of skilled data scientists or data engineers that are needed to operate and develop the full tool stack. Those teams are also in charge of adding new analytics features to the tools, including queries and visualizations.

Advanced companies like Netflix often embrace a very open culture around what they are building. This openness then inspires many less-advanced companies to try and replicate what they are doing without the necessary commitment in terms of investment, team size, or skill level. Confronted with failing projects and disappointed stakeholders, such companies then resentfully fall back to ready-made solutions that fit their use cases much better.

It is important to note that any custom solution has the potential to drastically slow down important data-driven initiatives. With a too complex system, even the most mundane analysis can require expert involvement and weeks of leadup time, next to struggling with other teams for prioritization.

While such data-advanced companies have some of the most sophisticated data processing pipelines in production today, it would be far from the truth to claim that those companies only use their in-house-built solutions. Take Netflix as an example: Their main website uses a custom analytics solution, while the brand page uses Google Analytics.

So while the in-house solution may be perfectly equipped for sophisticated product analytics, it may lack the marketing analytics or day-to-day reporting and analytics capabilities needed for other parts of the website or product.

How to choose the right digital analytics tool?

Now that we have gone through the 3+1 categories of analytics tools, we are left with the most important question: What is the right tool for your business? To figure this out, you should ask yourself a few questions:

  • Who will work with data in my company daily in the next several years? 

Your dedicated analytics team may handle most of the data today. However,data-driven companies have made it mandatory for decision-makers to work with data in the analytics tools themselves. This mandates a self-service-first environment where true collaboration can happen in the tool.

  • Which non-marketing use cases are important for your company? 

While Google Analytics may work well enough for your marketing questions, it falls short for any more sophisticated or product-centric analysis. However, using a tool like Adobe Analytics that works for marketing and product is crucial to enable shared responsibility for both marketing and product performance.

  • How fast do you need to iterate on your marketing or product execution?

Relying on a tool that requires your data scientists to adjust a data pipeline, build new queries, and integrate them into a dashboard takes days or weeks and can cripple your ability to iterate quickly and make adjustments on time. In reality, most changes should be quick and easy for anyone to implement, thanks to tools that support data democratization.

  • What is your confidence level in judging and maintaining the required analytics tool for those use cases?

It can be very challenging to see beyond the horizon of your business today and decide on the tool that will sustain your business for many years to come. You may also need to invest in the right team to build and execute the data strategy that will truly accelerate your daily business.

  • Who influences the choice of tool in your business?

A considerable number of companies don’t take the responsibility seriously and solely rely on what the team might be used to or what marketing agencies are proposing because of convenience. You need to insist on a coherent long-term strategy, or you might find yourself switching tools every year.

  • Have you considered the total cost of ownership and operation?

A few saved bucks on licensing costs may come with a hefty investment in additional tools, bigger teams to operate and maintain tools, and a much slower pace of innovation and fine-tuning. All of those come with direct or indirect financial consequences that a more mature solution may not require.

So, who should choose which tool? Let’s take a look at some prototypical companies and the tools they should choose:

A company that… … should choose…
… is focused on websites which function as marketing pages that serve information to the customer… … the market leader Google Analytics (free version) to correlate traffic volume and quality to marketing efforts in a quick and simple way.
… primarily builds digital products in a developer-heavy environment with little focus on marketing… … a product-focused tool from the second category to aid product development and confidently build new features.
… has both strong marketing and product use cases in a unique industry position and prioritizes collaboration across the company… … the most mature solution, Adobe Analytics, to show the full journey from traffic acquisition to product adoption and allow all involved teams to work together on the data.
… operates in a highly sensitive industry with strong regulatory requirements and no big focus on digital business… … a self-hosted open-source tool from the third category to guarantee transparency of data collection and handling.
… has the skills and resources to build and maintain global messaging pipelines and use them for analytics… … a DIY-toolstack from the bonus category to bring all the flexibility for custom use cases.

In the end, choosing the right tool can be a tough and complex challenge. Switching existing tools is a long and painful process but can be avoided considering the above mentioned questions. Hopefully, this article gave you an orientation and some important questions to ask your own team and tool vendors.

Guide
Read our guide to marketing attribution model and build revenue attribution to make better business decisions
Download free guide
Thank you! Your submission has been received!
Oops! Something went wrong while submitting the form.
No items found.
Share
Take full control of all your marketing data

500+ data sources under one roof to drive business growth. 👇

Get a demo
Get up to 368% ROI
No items found.
Calculate how much time your marketing team can allocate from reporting to action 👉
Your data is on the way and we’ll be processed soon by our system. Please check your email in a few minutes.
Oops! Something went wrong while submitting the form.