Amazon is a highly competitive retail media environment. Organic visibility alone is rarely sufficient to drive sustained product discovery. Sponsored listings have become a core lever for revenue growth, but they also introduce complex performance and budget management requirements.
Effective Amazon advertising depends on accurate visibility into search performance, targeting efficiency, and sponsored product outcomes. Without a structured reporting layer, teams rely on fragmented platform views and manual exports, limiting optimization speed and budget control.
This guide explains how to build a comprehensive Amazon Ads dashboard to standardize performance tracking, improve PPC decision-making, and support scalable retail media operations.
Key Takeaways:
- An Amazon Ads dashboard visualizes key performance indicators (KPIs) from your advertising campaigns, enabling faster, data-driven decisions.
- Essential metrics include ACoS, ROAS, CTR, CVR, and Total Sales. Tracking these is fundamental to understanding campaign effectiveness.
- The native Amazon Advertising Console provides basic reporting but often lacks the customization, speed, and cross-channel context needed for advanced optimization.
- Building a custom, unified dashboard by integrating data from Amazon Ads, Seller Central, and other marketing channels provides a complete view of performance.
- Automated platforms like Improvado eliminate manual data collection, providing real-time, granular insights to maximize marketing ROI and outmaneuver competitors.
What Is an Amazon Ads Dashboard? And Why You Urgently Need One
An Amazon Ads dashboard is a structured reporting layer that consolidates campaign, targeting, and search performance into a single analytical view. It transforms raw platform data into standardized metrics, trend views, and diagnostic breakdowns. Teams use it to monitor efficiency, control budgets, and identify optimization opportunities without manual data handling.
Without a dedicated dashboard, reporting relies on native platform views and exported spreadsheets. This fragments analysis, slows decision-making, and increases the risk of inconsistent metrics across teams.
The Role of Amazon’s Advertising Console
Amazon’s native interface, the Advertising Console, is the operational starting point. It supports:
- Campaign creation and bid management
- Basic performance reporting
- Keyword and targeting management
- Budget pacing controls
However, the console is designed for in-platform execution. It does not provide cross-campaign standardization, historical data modeling, or advanced performance diagnostics required at scale.
From CSV Exports to Analytical Workflows
Many sellers still export bulk reports and build manual spreadsheets. This approach introduces:
- Delayed reporting cycles
- Formula errors and version conflicts
- Inconsistent metric definitions
- Limited historical trend analysis
A dedicated dashboard replaces manual workflows with automated data refresh, standardized calculations, and structured visual analysis. Performance shifts from retrospective reporting to continuous optimization.
Operational Benefits for Retail Media Teams
A production-grade Amazon Ads dashboard delivers:
- Performance visibility across campaigns, products, keywords, and audiences
- Budget control through pacing, efficiency, and profitability tracking
- Faster optimization via trend detection and outlier identification
- Consistent metrics across teams, regions, and reporting periods
The outcome is improved return on ad spend, reduced manual effort, and scalable retail media operations.
Who Uses Amazon Ads Dashboards?
Different roles rely on dashboards for different decisions:
- Retail media and growth teams monitor revenue contribution and efficiency
- PPC specialists optimize bids, keywords, and targeting daily
- Agency account teams deliver standardized client reporting
- Marketing leadership tracks ROI, share of voice, and strategic progress
A shared analytical layer ensures every role operates on the same trusted performance data.
Navigating the Native Amazon Ads Dashboard
To appreciate the need for advanced solutions, you must first understand the native tool.
The Amazon Advertising Console is a powerful platform, but it has its limits. Knowing your way around is the first step toward mastering your ad strategy.
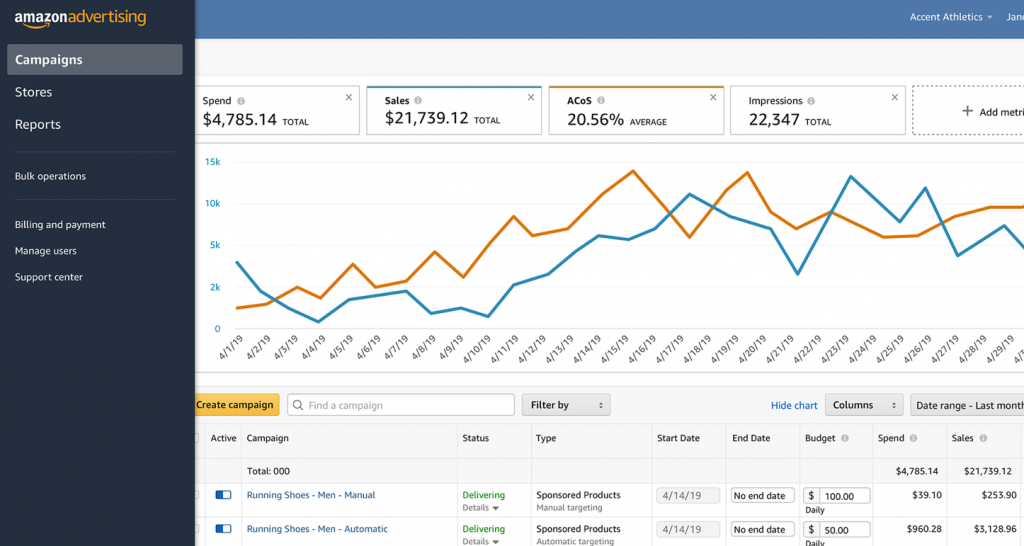
The Campaign Manager: Your Central Hub
The Campaign Manager is the heart of the Advertising Console. It's where you'll spend most of your time.
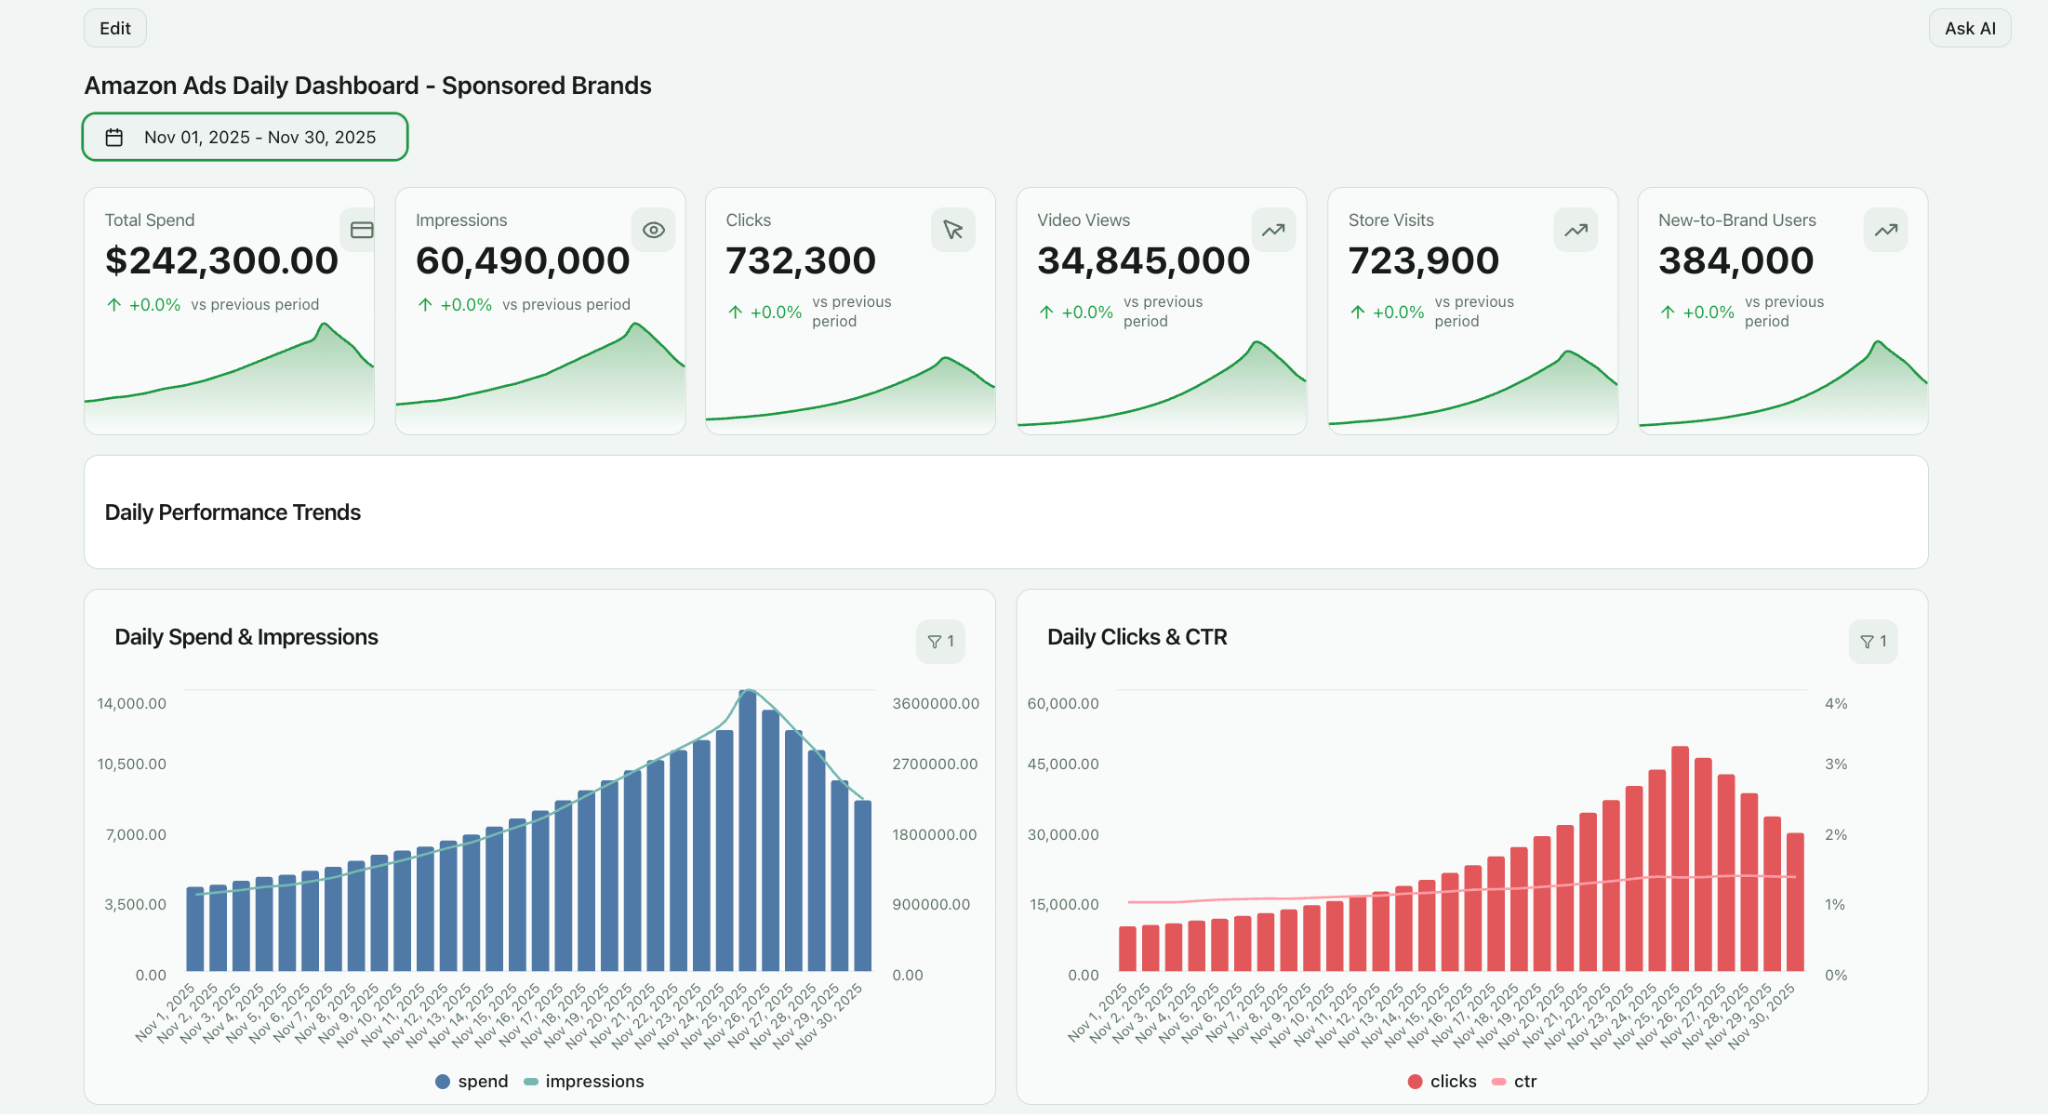
This section lists all your campaigns. You can filter them by status, type, date range, and more. It offers a high-level overview of key metrics like spend, sales, and ACoS for each campaign.
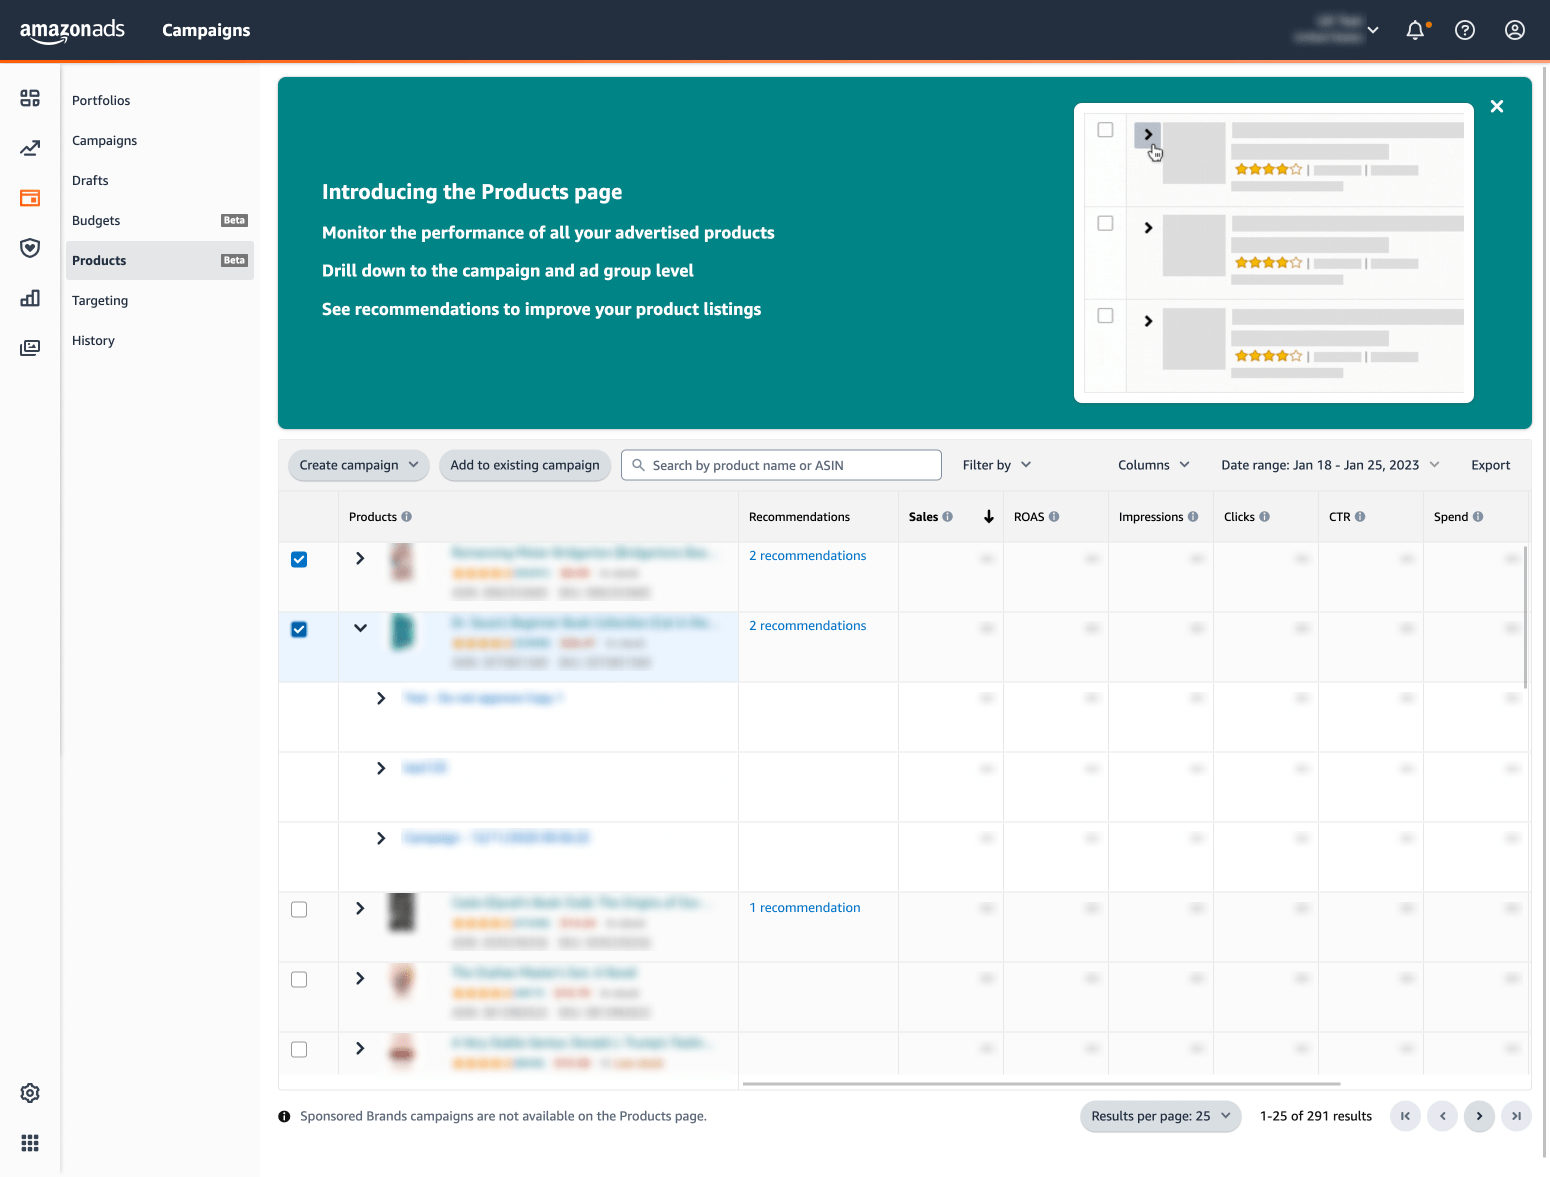
Key Sections: Portfolios, Campaigns, Ad Groups, and Keywords
The console is organized hierarchically. Understanding this structure is key:
- Portfolios: These are optional folders to group campaigns. They are useful for organizing by brand, product line, or season.
- Campaigns: This is where you set the overall budget, targeting strategy, and campaign type (e.g., Sponsored Products).
- Ad Groups: Within a campaign, ad groups contain a set of related products and the keywords or targets you bid on.
- Keywords/Targets: This is the most granular level. Here you manage bids for specific keywords, products (ASINs), or categories.
Understanding the Default Views and Columns
The Campaign Manager in Amazon’s Advertising Console provides configurable table views for campaign, ad group, targeting, and search term performance. Each view supports column-level customization, allowing teams to select the operational metrics required for daily execution.
Default columns typically include:
- Spend
- Sales
- ACoS
- Clicks
- Impressions
Additional performance and efficiency metrics can be enabled, including:
- CTR and CVR
- Orders and units sold
- ROAS
- New-to-brand sales
- Branded vs non-branded search attribution
- Detail page view rate
Customizing column sets is necessary to align the console view with specific optimization tasks, such as bid management, keyword harvesting, or budget pacing. However, these configurations remain user-specific and are not governed across teams, which often leads to inconsistent internal reporting practices.
Limitations of the Native Dashboard
The native console is designed for campaign execution, not enterprise-grade analytics. Several structural limitations emerge as spend and account complexity grow.
- Data latency: Performance data is not fully real-time. Certain metrics, including attributed conversions and new-to-brand reporting, can lag by several hours or longer. This limits intraday optimization and budget reallocation accuracy.
- Interface constraints at scale: Large accounts with thousands of campaigns and targets experience slow loading, limited filtering logic, and constrained bulk analysis capabilities. Deep historical analysis often requires manual exports.
- Siloed performance view: The console only reflects Amazon media performance. It does not connect to revenue systems, inventory data, margin data, CRM, or other paid media channels. This prevents unified ROI analysis and cross-channel budget planning.
- Limited historical modeling: Native reporting offers restricted lookback windows and minimal support for custom time-series modeling, cohort tracking, or lifecycle performance analysis.
- No data blending or governance: The console does not support metric standardization across accounts, regions, or brands. There is no layer for enforcing naming conventions, validating data quality, or blending Amazon Ads data with external datasets.
- Visualization constraints: Reporting is table-based with limited charting flexibility. Custom executive dashboards, profitability views, or product-level intelligence require external BI tools.
The Essential Metrics to Track in Your Amazon Advertising Dashboard
A dashboard is only effective if it reflects how retail media performance is actually managed.
Amazon Ads optimization depends on understanding discovery, engagement, conversion, and profitability — at campaign, product, and keyword levels. Mature teams structure metrics by funnel stage and decision use case.
Top-of-Funnel Metrics (Awareness and Discovery)
These metrics measure visibility in Amazon’s search and browsing environment. They inform share of voice and category-level exposure.
- Impressions: The number of times ads appear in search results, category pages, or product detail pages. Used to assess visibility by keyword, product, or placement.
- Reach (Unique Shoppers): The number of distinct users exposed to ads. Important for understanding audience penetration and frequency management.
- Search Term Impression Share: The percentage of eligible auctions where your ad appeared. Indicates competitive positioning on priority keywords.
- Branded vs Non-Branded Impression Split: Separates exposure driven by brand equity from generic category discovery. Critical for growth strategy planning.
- New-to-Brand Impressions: Measures exposure to shoppers who have not purchased your brand in the past 12 months. Used to assess incremental audience acquisition.

Mid-Funnel Metrics (Consideration and Engagement)
These metrics evaluate ad relevance and shopper interest.
- Clicks: Total ad clicks. Used for bid optimization, keyword harvesting, and placement testing.
- Click-Through Rate (CTR): Clicks ÷ Impressions. Indicates ad relevance to search intent and effectiveness of creative assets.
- Cost-Per-Click (CPC): Average cost paid per click. Used to manage bid efficiency and auction competitiveness.
- Detail Page View Rate: Percentage of ad clicks that result in a product detail page view. Highlights listing quality and page load issues.
- Search Term Performance: Click and conversion performance by shopper search query. Used to refine targeting and negative keyword rules.
Bottom-of-Funnel Metrics (Conversion)
These metrics measure purchase behavior after ad engagement.
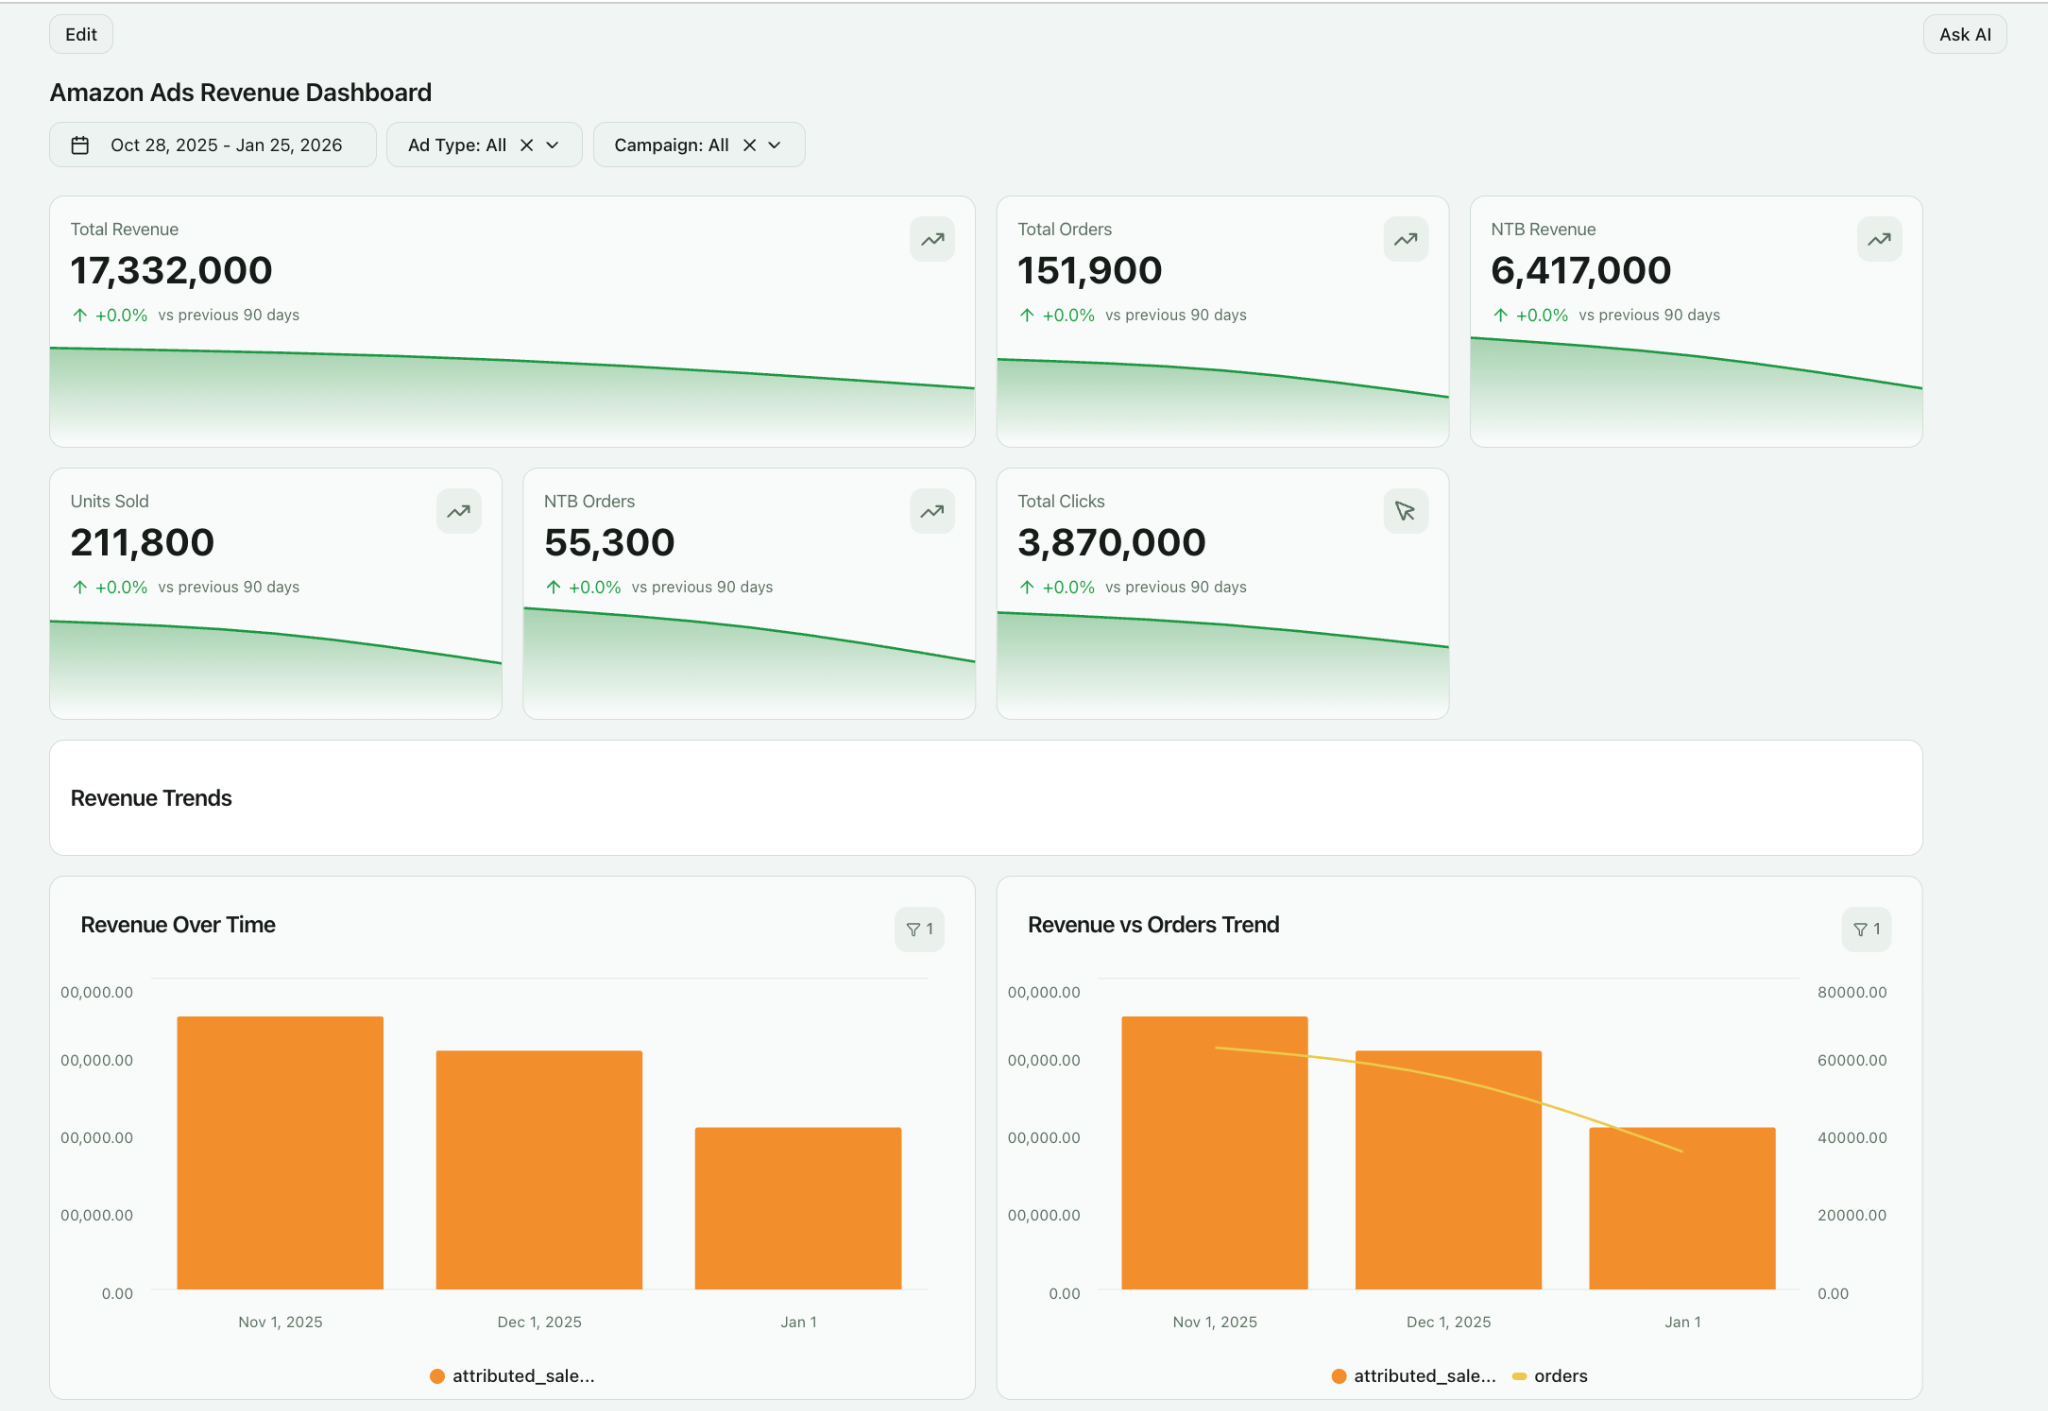
- Orders: Total attributed purchase events within Amazon’s attribution window.
- Units Sold: Total products sold through ad-attributed orders. Important for multi-unit purchase analysis.
- Attributed Sales: Revenue generated from ad-driven purchases. Core revenue measurement for campaign performance.
- Conversion Rate (CVR): Orders ÷ Clicks. Indicates effectiveness of product detail pages, pricing, reviews, and fulfillment options.
- New-to-Brand Orders and Sales: Tracks first-time brand purchases driven by ads. Used to assess customer acquisition efficiency.
Efficiency and Profitability Metrics
These metrics determine sustainable spend levels and scaling decisions.
- Ad Spend: Total media investment across campaigns and placements.
- Advertising Cost of Sales (ACoS): Ad Spend ÷ Attributed Sales. Core efficiency metric for tactical optimization.
- Return on Ad Spend (ROAS); Attributed Sales ÷ Ad Spend. Common for executive-level performance reporting.
- Total Advertising Cost of Sales (TACoS): Ad Spend ÷ Total Brand Sales (organic + paid). Used to understand organic lift and overall business impact.
- Contribution Margin After Ads: Attributed Sales minus product cost, fees, and ad spend. Required for true profitability management.
- Budget Pacing vs Target: Tracks spend velocity against daily or monthly budgets. Used to prevent underspend or early budget exhaustion.
Operational and Diagnostic Metrics
These metrics support daily account management and troubleshooting.
- Buy Box Win Rate: Percentage of time your product holds the Buy Box. Directly affects conversion performance.
- Inventory Availability Rate; Out-of-stock exposure impact on ad efficiency.
- Placement Performance: Performance by ad placement (Top of Search, Product Pages, Rest of Search). Used for bid modifiers.
- Daypart Performance; Conversion and efficiency by hour and day. Used for scheduling and bid automation.
Building a Custom Amazon Ads Dashboard for Peak Performance
As Amazon spend grows, the native console becomes an execution interface, not an analytics layer.
A custom dashboard provides standardized metrics, historical modeling, and cross-functional reporting. It supports daily optimization, executive oversight, and long-term retail media planning.
Building this layer requires a structured implementation process.
Step 1: Define Your Business Goals and KPIs
Start with the decisions the dashboard must support. Metrics selection follows from decision requirements, not the other way around.
Common objective frameworks include:
- Product launch acceleration → impression share, CTR, new-to-brand reach
- Revenue scaling → attributed sales, CVR, budget pacing
- Profitability control → ACoS, TACoS, contribution margin
- Category defense → branded search impression share, competitor overlap
- Portfolio management → product-level profitability and lifecycle tracking
Clear objective definition ensures dashboards drive action, not passive reporting.
Step 2: Map Required Your Data Sources
Amazon Ads data alone is insufficient for full performance management. A production-grade dashboard typically combines:
- Amazon Advertising API (campaign, keyword, targeting, placement data)
- Seller Central or Vendor Central (organic sales, inventory, Buy Box status)
- Product catalog and cost data (margin and profitability modeling)
- Retail operations data (pricing, promotions, stock levels)
- Additional media platforms (Google, Meta, TikTok, DSPs) when budgets are managed holistically
This source mapping step defines the analytical scope and integration complexity.
Step 3: Select the Right Analytics Architecture
Teams typically choose between:
- BI tools with custom data pipelines: Requires separate extraction, transformation, storage, and maintenance workflows. Increases engineering overhead and governance risk.
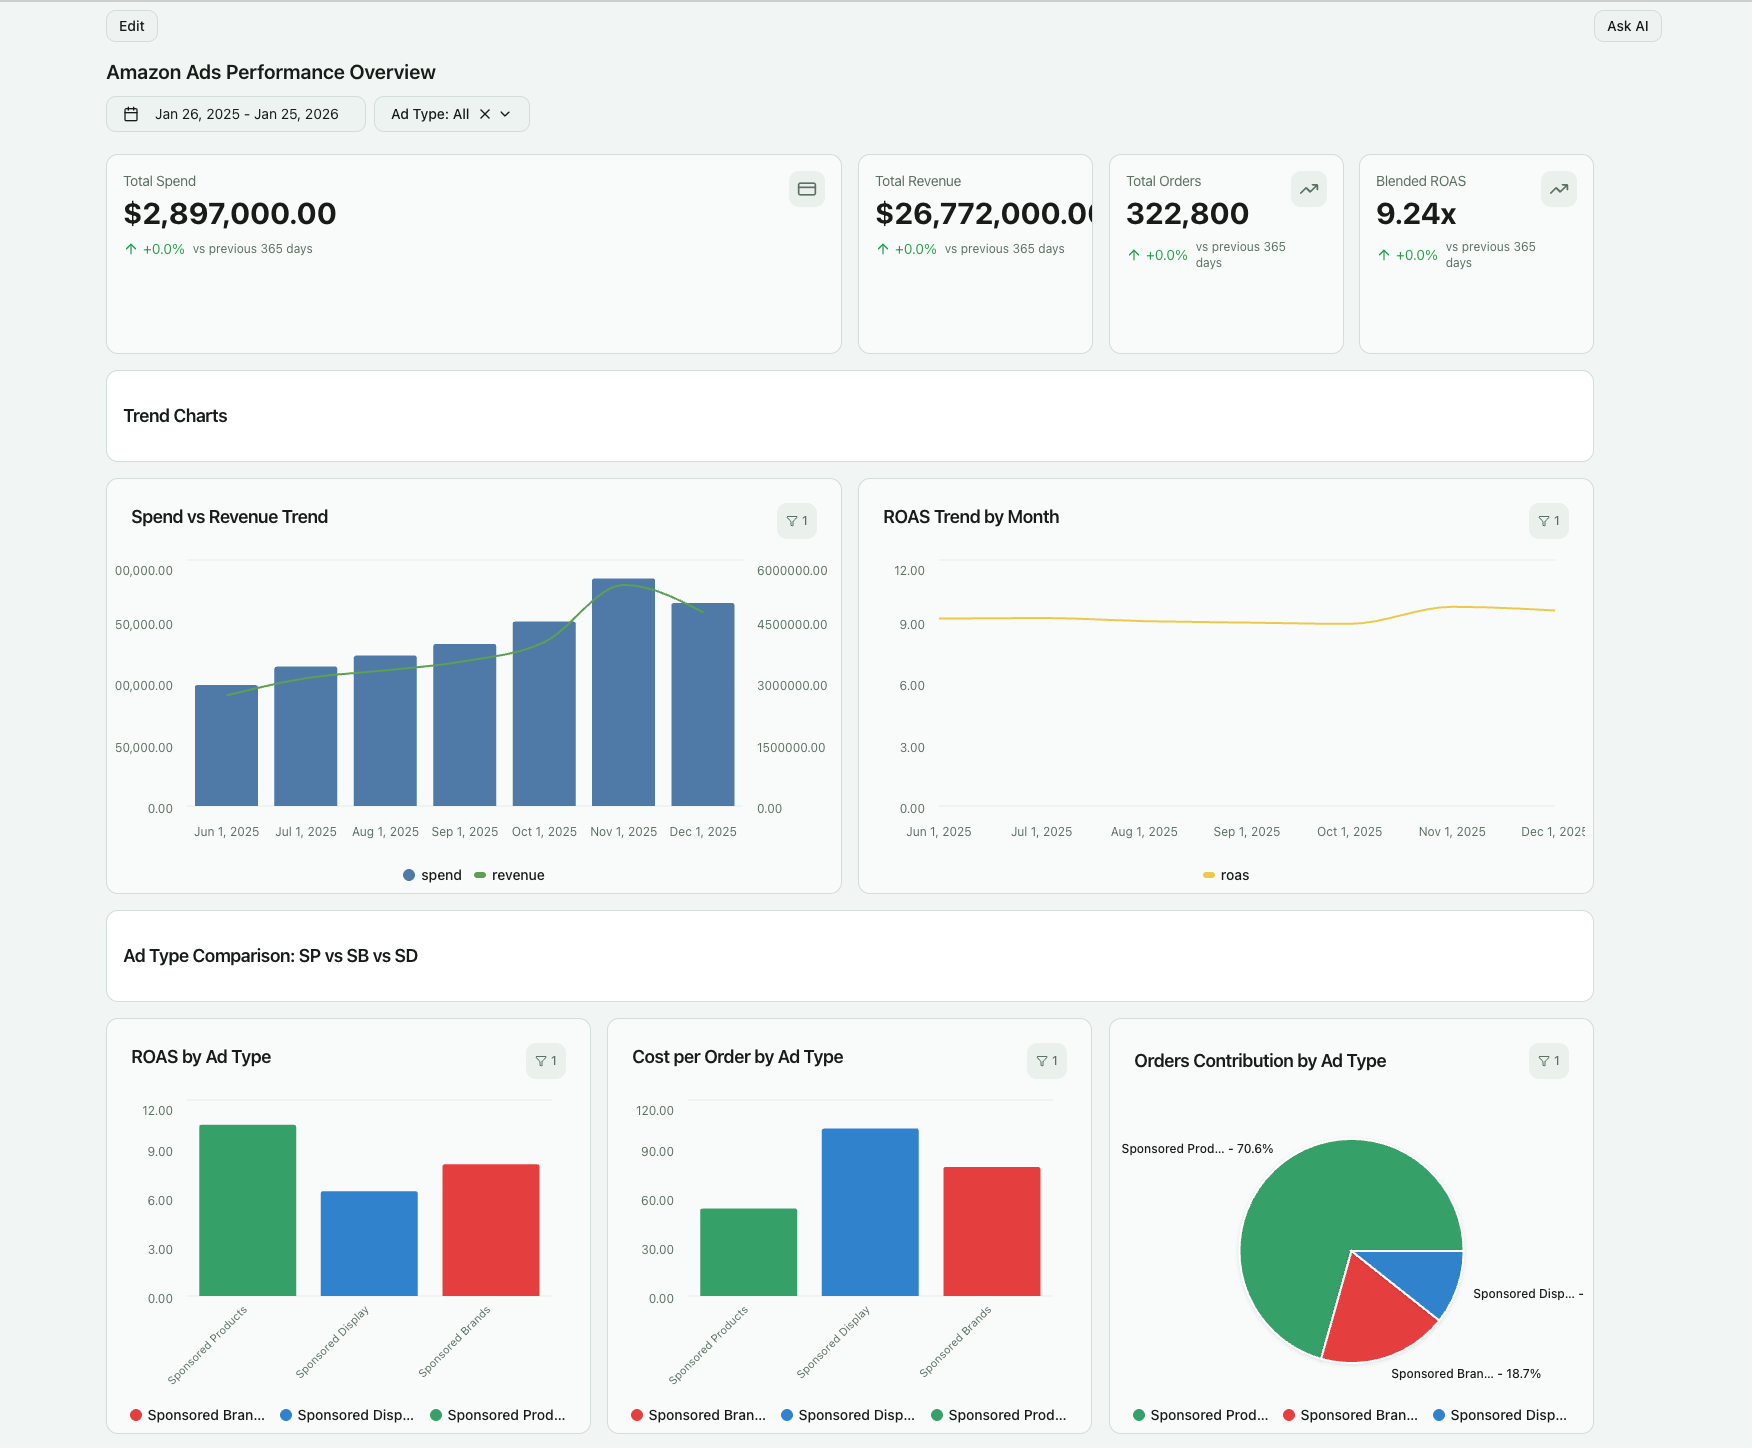
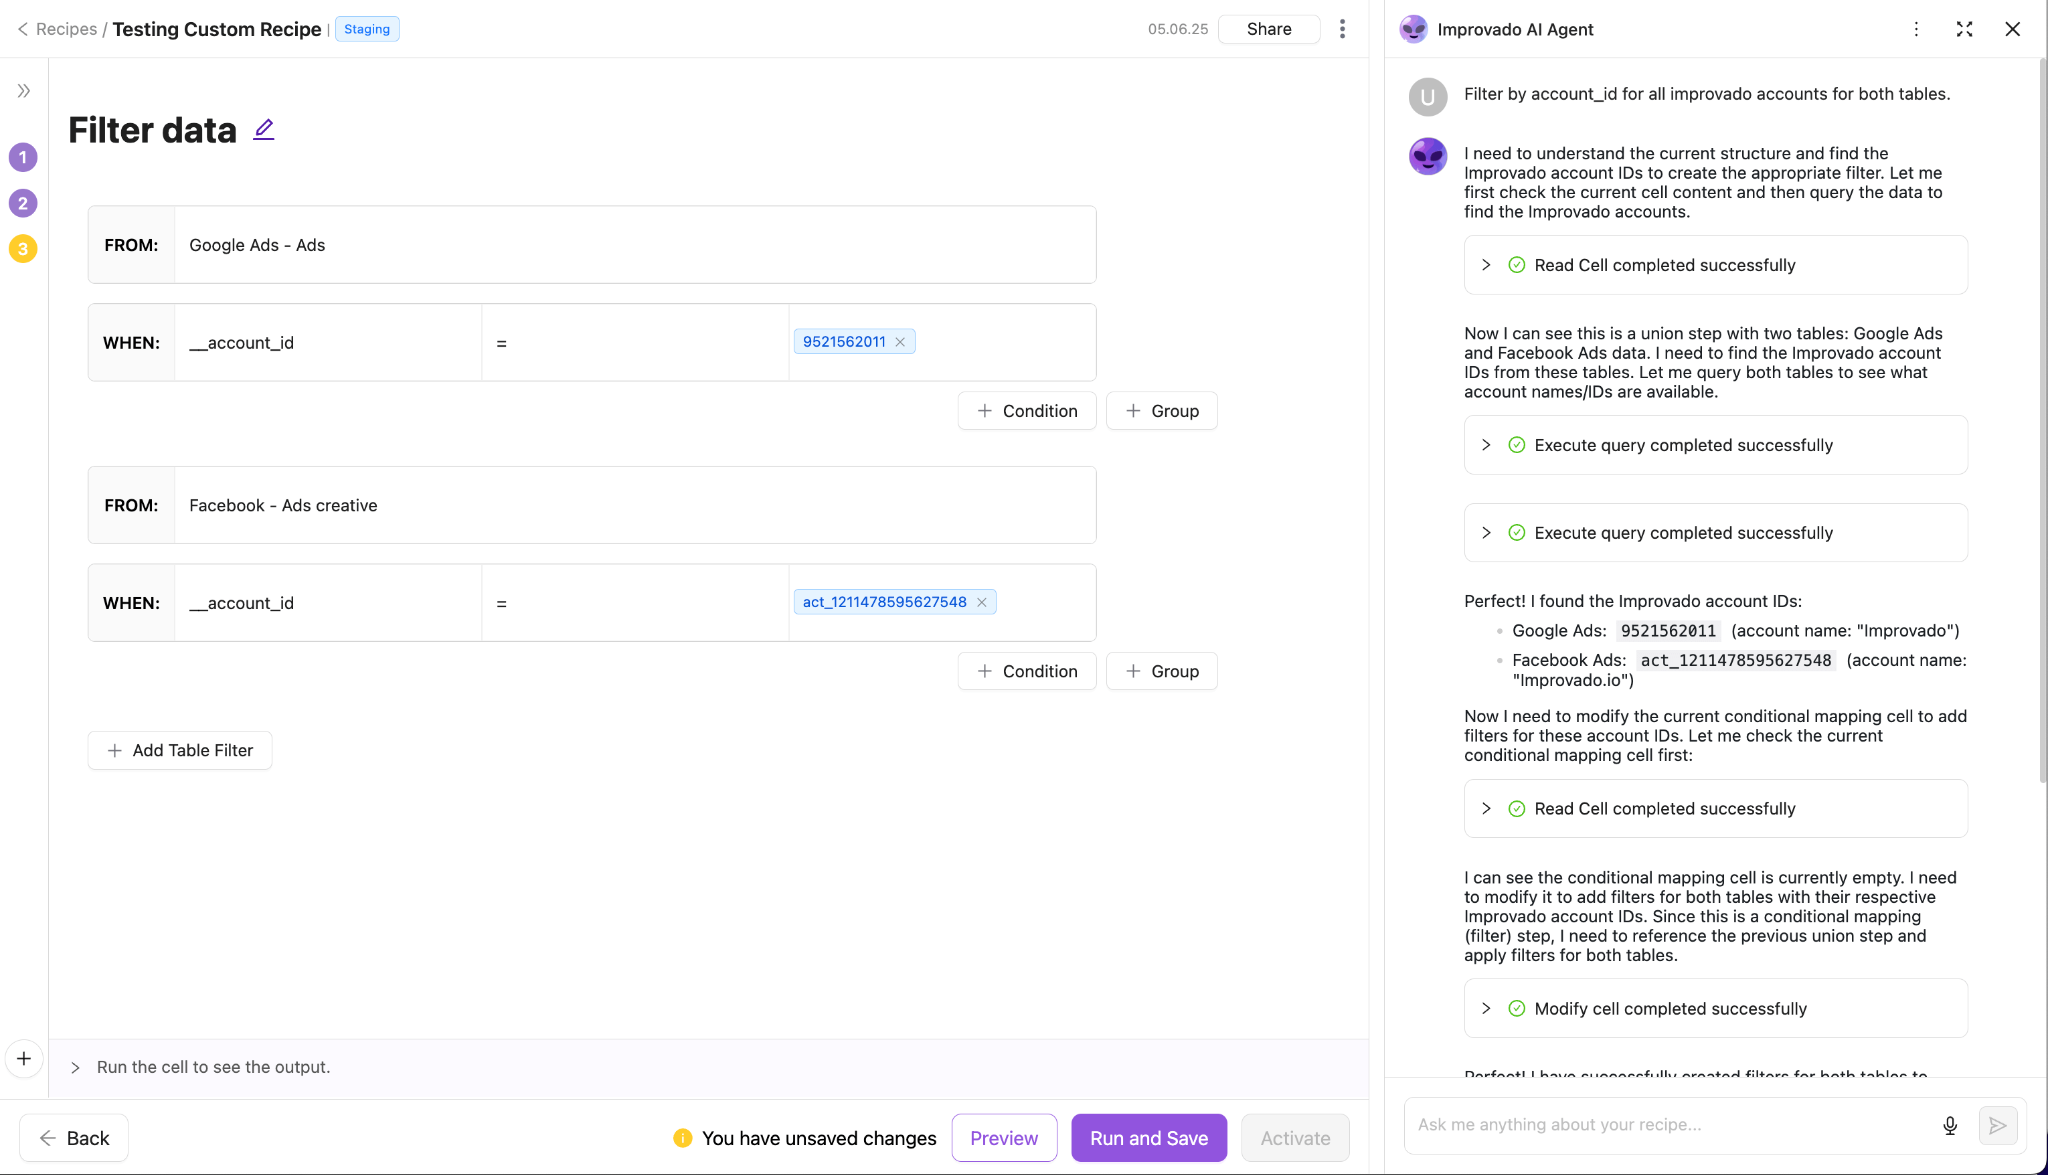
- End-to-end analytics platforms: Improvado centralizes ingestion, transformation, governance, BI enablement, and AI-driven analysis in one system. It connects to 1,000+ sources, standardizes schemas, and delivers analysis-ready datasets to BI tools or native dashboards.
For enterprise teams, the second model reduces implementation time, technical dependency, and reporting fragility.
Step 4: Aggregate and Normalize Your Data
Raw Amazon data is not analysis-ready. Effective dashboards require:
- Metric standardization across accounts and regions
- Campaign and product naming convention alignment
- Currency and timezone normalization
- Attribution window harmonization
- Product-to-campaign-to-revenue mapping
- Governance rules for data validation and anomaly detection
Improvado applies no-code transformations inside the warehouse and enforces governance controls. AI Agent allows teams to define rules and transformations in plain English.
Step 5: Visualize Your Data for Actionable Insights
Dashboards should reflect how teams operate, not just how data is structured.
Typical views include:
- Executive performance and ROI overview
- Budget pacing and efficiency monitoring
- Campaign and keyword optimization workspaces
- Product-level profitability dashboards
- New-to-brand acquisition tracking
- Inventory and Buy Box risk monitoring
Improvado delivers BI-ready datasets and native dashboards. Customization credits included in each pricing plan allow teams to build bespoke views or extend functionality with professional services support.
Step 6: Operationalize Insights
The final step is embedding dashboards into daily workflows:
- Scheduled reporting and automated refresh
- Alerting for pacing, efficiency, and data anomalies
- AI Agent queries for instant ad hoc analysis
- Shared metric definitions across teams and agencies
The result is faster optimization cycles, controlled spend, and scalable retail media execution.
Comparison: Native Amazon Dashboard vs. Improvado's Unified Platform
Choosing the right tool is a critical decision. The native Amazon dashboard is a starting point, but a unified analytics platform like Improvado provides the capabilities needed to truly scale and win.
| Feature | Native Amazon Ads Dashboard | Improvado Unified Dashboard |
|---|---|---|
| Data Sources | Amazon Ads data only | Amazon Ads, Seller Central, Google, Facebook, CRM, 1,000+ more |
| Real-Time Updates | Delayed data (up to 24 hours) | Real-time data refreshes |
| Customization | Limited column and filter options | Fully customizable widgets, metrics, and visualizations |
| Cross-Channel View | None; siloed to Amazon Ads | Holistic view of all marketing channels in one place |
| Data Granularity | Standard campaign and keyword level | Deep granularity with custom dimensions and blended metrics |
| Historical Data | Limited to 90 days in the UI | Unlimited historical data storage in a dedicated data warehouse |
| Automation and Alerts | No automated alerting | Custom, automated alerts for performance anomalies |
| Scalability | Slows down with many accounts and campaigns | Built to handle massive data volumes for large brands and agencies |
Advanced Analytics: Going Beyond Basic Dashboard Metrics
Basic KPIs show what happened. Advanced analytics explains why it happened and where to act next. Mature retail media teams use dashboards to move from performance monitoring to structured optimization and competitive intelligence.
Search Term Intelligence for Keyword Strategy
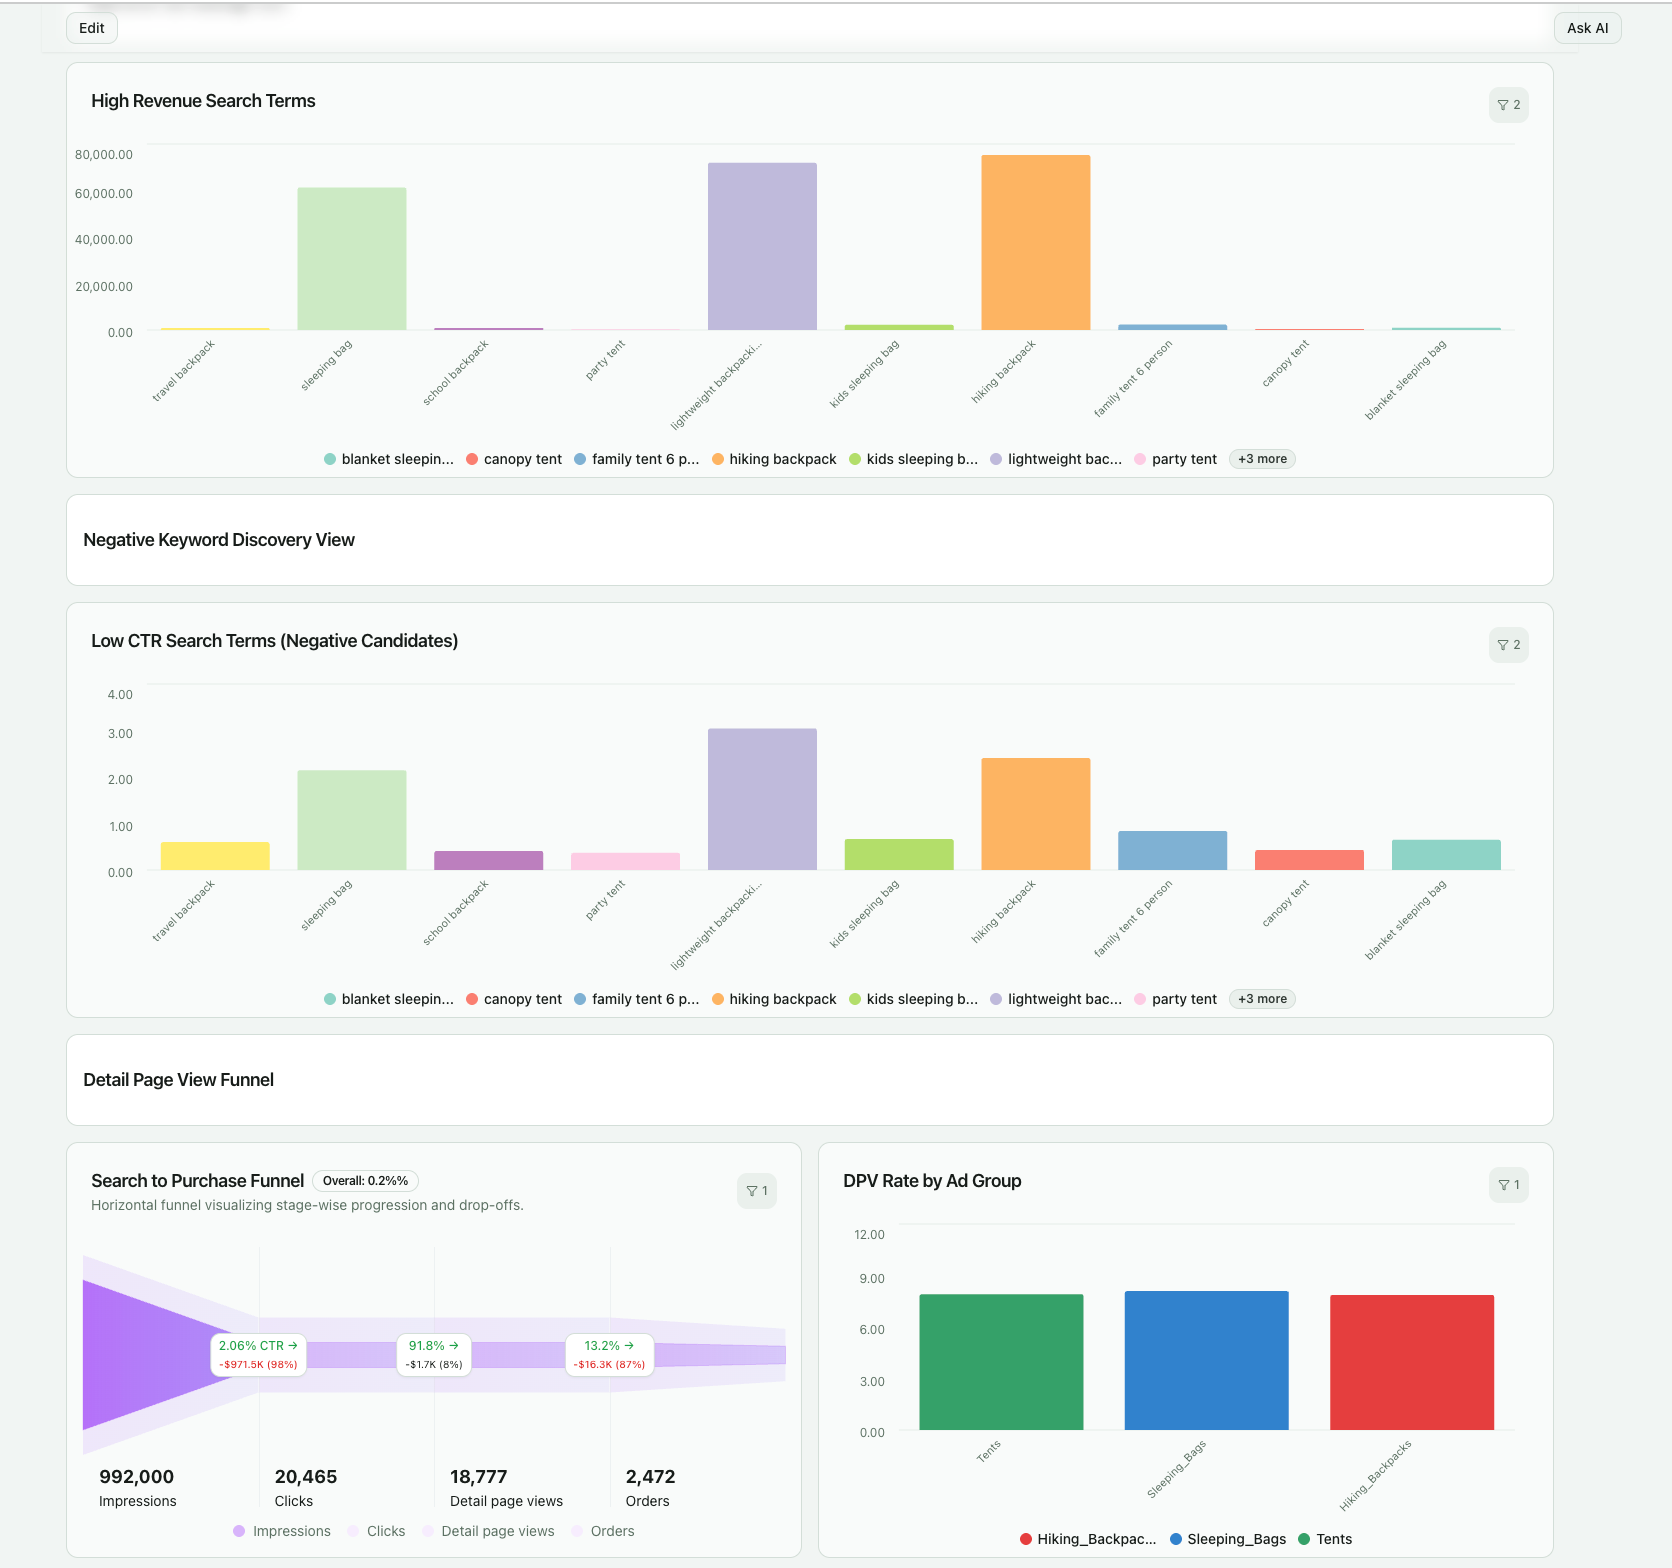
Search term reports reveal the exact shopper queries that triggered ad clicks. This data is essential for closing the loop between targeting strategy and real shopper intent.
Advanced dashboards structure search term data by:
- Conversion and revenue contribution
- New-to-brand acquisition impact
- Branded vs non-branded discovery
- ACoS and margin by query cluster
This enables systematic keyword harvesting, negative keyword automation, and budget reallocation toward high-intent demand.
Attribution Window and Path-to-Purchase Analysis
Amazon attribution assigns conversions within fixed post-click windows. Sponsored Products and Sponsored Brands typically use a 14-day window. Sponsored Display may use view-through attribution.
Advanced dashboards model:
- Conversion lag distribution
- Early vs late attribution impact
- Repeat purchase behavior within windows
- Cross-campaign touchpoint overlap
This clarifies how ads contribute across the purchase journey and prevents misinterpretation of delayed conversions.
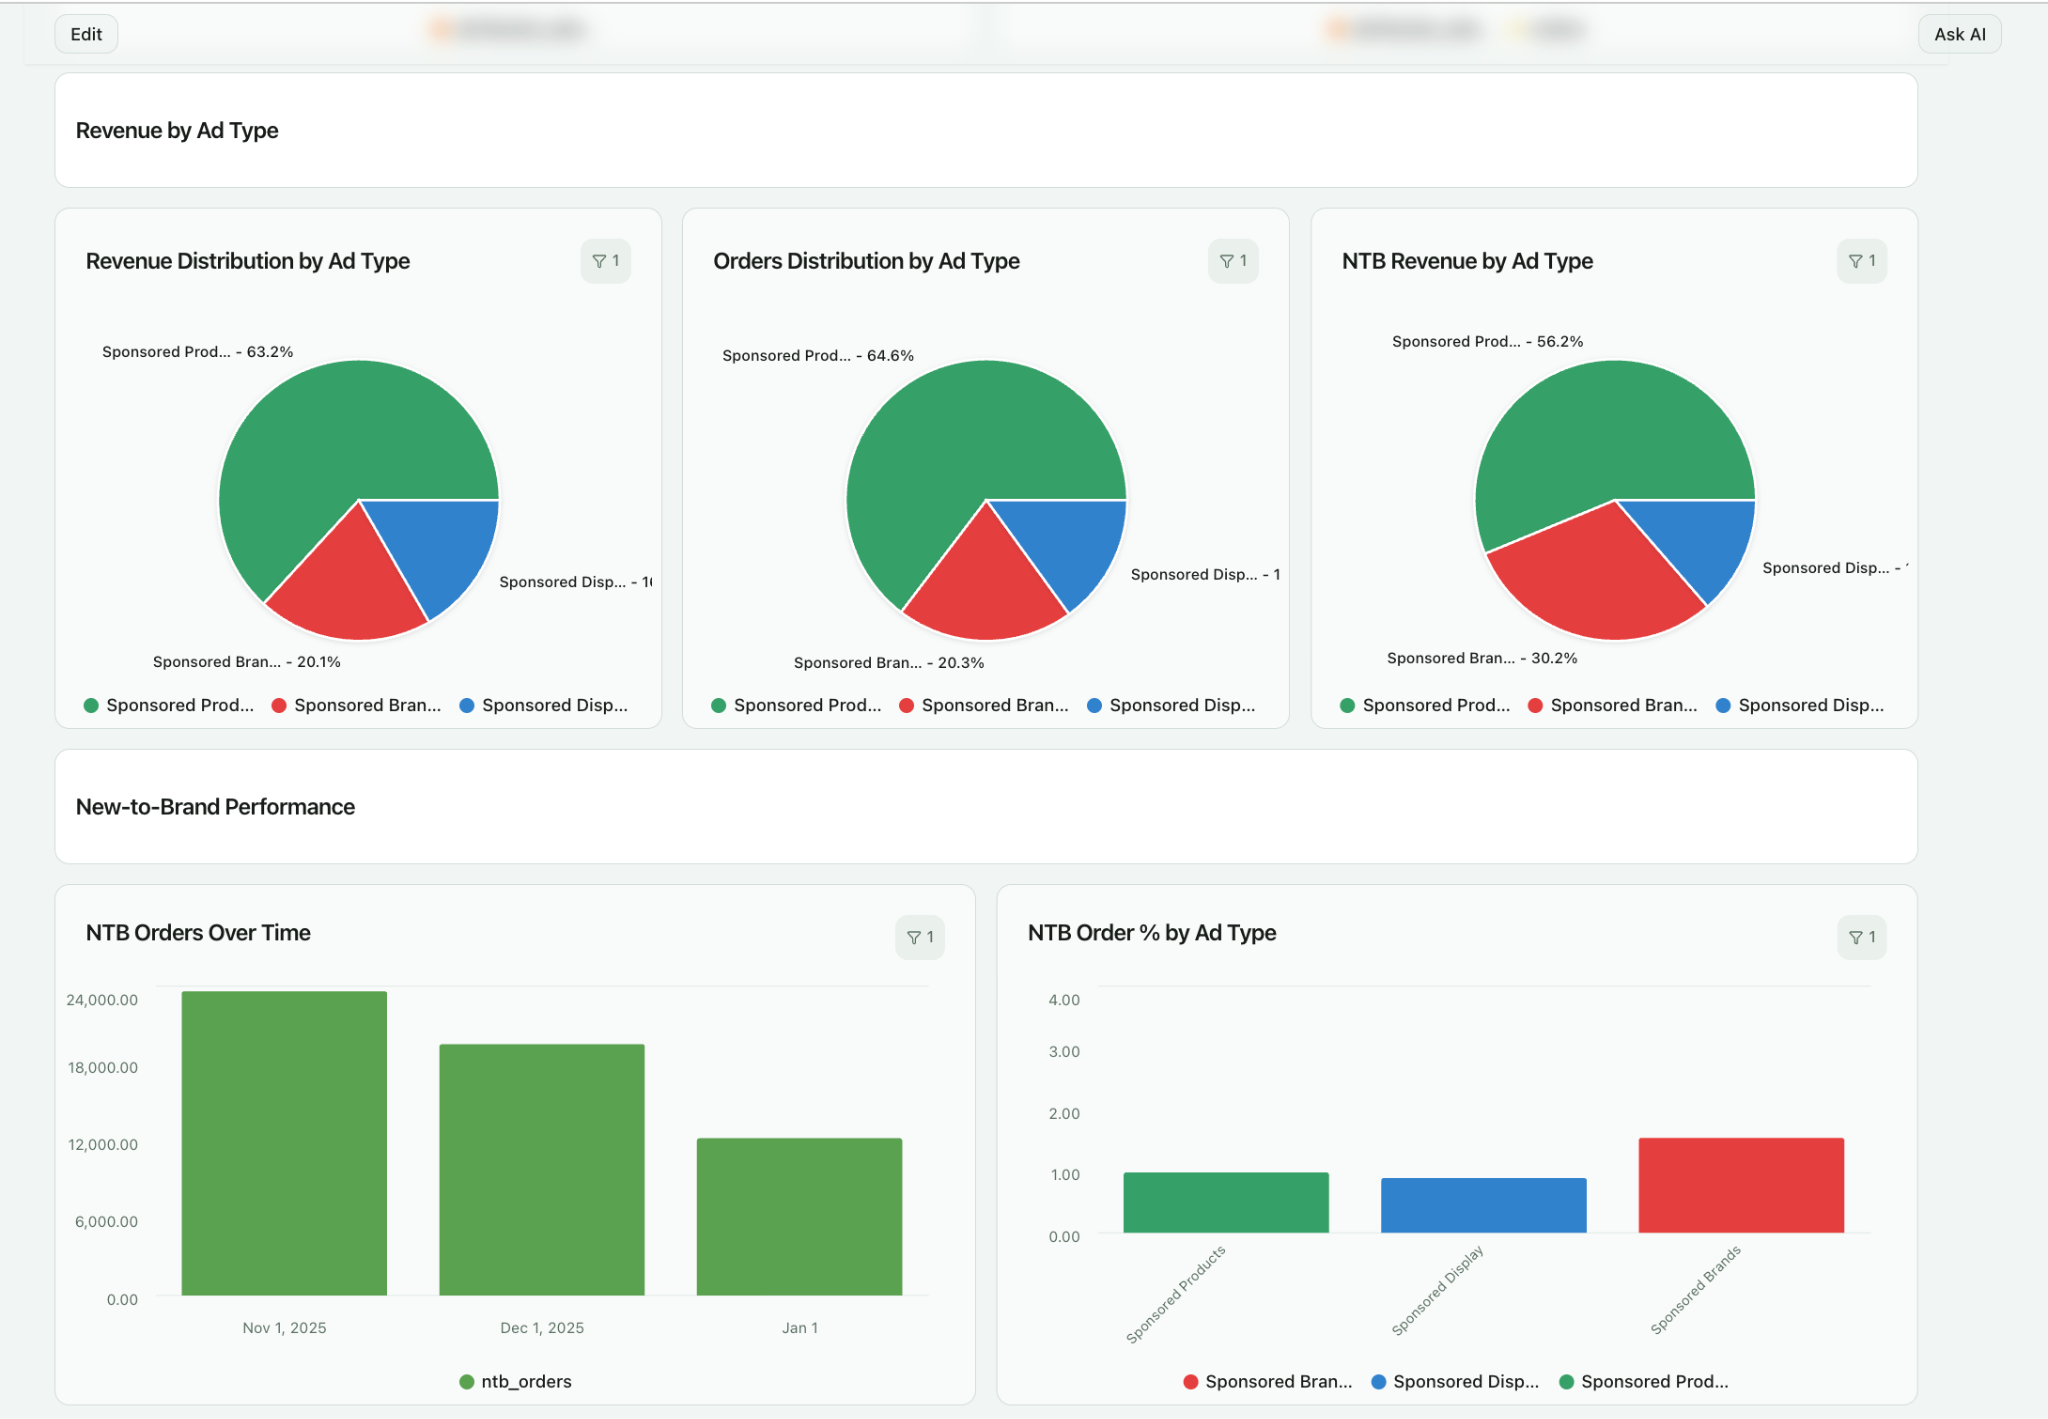
New-to-Brand Acquisition Tracking
New-to-brand metrics identify shoppers who have not purchased from your brand in the past 12 months. This separates true customer acquisition from repeat demand capture.
Dashboards should expose:
- NTB orders and revenue by campaign and keyword
- NTB cost of acquisition
- NTB contribution to total growth
- NTB vs repeat purchase efficiency gaps
This allows teams to balance conquesting, defense, and retention investment.
Share of Voice and Competitive Positioning
Share of Voice measures impression ownership on priority search terms. It reflects auction competitiveness and category visibility.
Advanced reporting calculates:
- Impression share by keyword cluster
- Branded vs generic SOV
- SOV changes over time
- Correlation between SOV and organic rank
This supports category defense strategies, bid escalation decisions, and competitor response planning.
Product-Level and Portfolio Analytics
Retail media performance ultimately depends on product economics. Advanced dashboards link ad performance to product attributes.
Key analyses include:
- Product-level contribution margin after ads
- Price and promotion elasticity
- Review rating impact on CVR
- Inventory risk and ad efficiency correlation
This connects media execution to merchandising and supply chain decisions.
How to Use Your Dashboard to Optimize Ad Campaigns in Real-Time
A dashboard becomes valuable when it changes daily behavior. In mature Amazon advertising programs, optimization is not a periodic review task. It is a continuous control process. The dashboard serves as the system that detects performance drift, highlights opportunity, and validates the impact of every adjustment.
The goal is not to watch metrics. The goal is to shorten the time between signal detection and corrective action.
Identifying Underperforming Keywords and ASINs
Underperformance rarely exists at the campaign level alone. It appears in specific keyword clusters, ASIN targets, placements, or search term patterns. A functional dashboard allows teams to move from high-level anomalies to root cause in seconds.
For example, high ACoS on a campaign may be driven by:
- A small group of non-converting search terms
- ASIN targets losing the Buy Box
- A placement with low conversion lift
- A single product with declining review score
Without structured drill-downs, teams pause entire campaigns or reduce budgets broadly. With proper diagnostics, teams apply surgical fixes. This preserves growth while eliminating waste.
Managing Bids as a Visibility–Efficiency Tradeoff
Bid decisions are not only about cost control. They are about balancing impression share against profitability.
Advanced dashboards expose where profitable keywords are constrained by low visibility. In these cases, increasing bids is not a cost risk. It is a growth lever. Conversely, dashboards reveal where high bids buy visibility that does not convert. Those bids are reduced or restructured into exact, phrase, or negative targeting.
Over time, this creates a bid portfolio where:
- High-intent terms earn higher visibility
- Experimental terms are tightly capped
- Defensive branded terms are protected
- Low-value traffic is excluded
This is portfolio management, not manual bid tweaking.
Using Budget Pacing to Prevent Lost Revenue
Most performance loss in large Amazon accounts comes from budget pacing errors, not bid errors. Campaigns that hit daily caps too early lose high-converting evening traffic. Campaigns that underspend leave demand uncaptured.
A real-time dashboard highlights:
- Spend velocity vs daily caps
- Revenue generated per incremental budget unit
- Opportunity cost of budget constraints
This allows teams to shift budgets intraday, not at month-end. Budget becomes a dynamic allocation tool instead of a static limit.
Booyah Advertising switched from a legacy ETL provider to Improvado because their previous setup delivered inconsistent data, delayed refreshes, and major bottlenecks. After migrating more than 600 reports into Improvado, they achieved 99.9% data accuracy and cut their daily budget-pacing update time by 50%.
With the automated pipelines and unified data models provided by Improvado, the team no longer needs manual reconciliation. Instead of spending hours manually aggregating and comparing platform reports, they now get reliable, up-to-date spend and performance data in 10–30 minutes, enabling faster, data-driven budget decisions across 100+ clients.
“If we don't trust the data, the agency won’t trust the reports and won't give them to the client. They’ll start pulling data manually to Excel and spend a lot of time comparing platform numbers to reports. With Improvado, we now trust the data. If anything is wrong, it’s how someone on the team is viewing it, not the data itself. It’s 99.9% accurate.”

Connecting Creative Performance to Shopper Intent
Creative testing is often reduced to comparing CTRs. Mature teams go further. They link creative variants to search intent, landing page alignment, and new-to-brand acquisition.
A dashboard that separates:
- CTR lift
- CVR impact
- NTB rate
- Average order value
reveals which creative attracts the right shoppers, not just more clicks. This prevents scaling attention-grabbing ads that drive low-quality traffic.
Preventing Performance Degradation Before It Shows in Revenue
Amazon environments shift daily. Competitors change bids. Inventory fluctuates. Reviews update. Buy Box ownership changes. Waiting for revenue loss is too late.
Advanced dashboards act as early-warning systems. Sudden CTR drops signal creative fatigue. CVR drops signal listing or pricing issues. Impression share loss signals competitive pressure. Each signal triggers investigation before material revenue impact occurs.
This is the difference between reactive reporting and operational control.
Validating Every Optimization Action
Optimization without measurement is guesswork. After bid changes, creative swaps, or listing updates, dashboards track performance deltas over defined comparison windows. This confirms which actions delivered real lift and which did not.
Over time, teams build internal benchmarks:
- Expected CVR by category
- Target ACoS by product margin
- Typical NTB rate by campaign type
This institutional knowledge becomes a durable competitive advantage.
The Power of a Unified Dashboard: Integrating Amazon Ads with Other Channels
Amazon Ads rarely operates in isolation. Shoppers discover products through search engines, social platforms, influencers, review sites, and email before they purchase on Amazon. Treating Amazon as a standalone channel hides the real demand creation engine behind conversions.
A unified dashboard connects media exposure, shopper intent, and purchase behavior across platforms. It turns Amazon from a black-box conversion endpoint into a measurable part of a broader growth system.
Why an Amazon-Only View Distorts Decision-Making
A siloed Amazon dashboard optimizes for local efficiency, not global outcomes.
A keyword with high ACoS may look inefficient in isolation. In reality, it may capture demand created by upper-funnel social or video campaigns. Pausing it improves Amazon metrics but reduces total revenue.
Without cross-channel visibility, teams unintentionally shift budgets away from demand-harvesting activities. This leads to underinvestment in awareness, unstable acquisition costs, and volatile revenue.
Unified reporting prevents false efficiency signals.
Connecting Amazon Ads with Search and Paid Social
Search and social platforms generate intent. Amazon converts that intent at the point of purchase. When these datasets are connected, teams see how demand flows across channels.
A unified dashboard reveals:
- Which social campaigns drive branded Amazon searches
- How Google Search spend influences Amazon conversion volume
- Where TikTok or YouTube lift new-to-brand purchases on Amazon
- How retargeting sequences shorten purchase cycles
This allows budget allocation based on total funnel contribution, not last-click performance.
Integrating CRM and First-Party Sales Data
Many brands sell both on Amazon and through direct channels. CRM and DTC data complete the customer journey.
When CRM data is connected:
- Teams see repeat purchase behavior across channels
- Customer lifetime value can be tied to acquisition source
- Amazon becomes part of retention and upsell strategy
- Media investment is aligned to long-term customer value, not single transactions
This shifts media planning from campaign ROI to customer economics.
Moving from Attribution to Business Intelligence
Cross-channel integration is not only about attribution models. It is about building a consistent commercial view of performance.
A unified dashboard standardizes:
- Metric definitions across platforms
- Currency, timezone, and attribution logic
- Campaign and product hierarchies
- Revenue and margin mapping
This creates a single source of truth that finance, marketing, and leadership trust.
Building an Operating Model Around Unified Analytics
When every team works from the same data layer, decision-making accelerates. Marketing teams optimize execution. Growth teams plan expansion. Finance teams forecast revenue. Leadership monitors performance without manual reporting.
This is how marketing analytics evolves from reporting support to operational infrastructure.
Best Practices for Managing Your Amazon Ads Dashboard
A dashboard creates value only when it becomes part of the operating rhythm.
The objective is to institutionalize data-driven decision-making, not produce periodic reports.
Establish Structured Review Cadences
Different decisions require different time horizons. Daily monitoring focuses on spend pacing, conversion stability, and system health. Weekly reviews examine bid efficiency, keyword expansion, creative performance, and budget allocation. Monthly reviews assess growth, new-to-brand acquisition, margin performance, and category positioning.
A defined cadence prevents reactive decision-making and ensures strategic changes are grounded in trend data, not single-day volatility.
Align Dashboard Views to Decision Ownership
Dashboards should mirror organizational responsibility. Executives need revenue contribution, profitability, and growth indicators. Retail media managers need campaign and budget controls. PPC specialists need keyword, placement, and search term diagnostics. Finance teams need margin and forecast alignment.
When each role sees only the data required for their decisions, dashboards accelerate action rather than overwhelm teams with noise.
Implement Automated Monitoring and Alerts
Manual monitoring does not scale. Advanced dashboards provide automated detection of abnormal performance patterns. Sudden ACoS spikes, CTR drops, CVR declines, budget exhaustion, or Buy Box loss trigger immediate notifications.
This shifts operations from periodic checking to exception-based management. Teams intervene only when signals require action.
Use Historical Data for Planning and Forecasting
Amazon performance is seasonal, promotional, and competitive. Historical dashboards expose demand curves, auction inflation patterns, and conversion shifts around key retail events.
Teams use this data to:
- Set budget and revenue forecasts
- Anticipate CPC and impression share pressure
- Plan inventory ahead of demand spikes
- Model expected ROI for event-based spend increases
This replaces guesswork with evidence-based planning.
Enforce Metric Governance and Consistency
As teams scale, inconsistent metric definitions become a hidden risk. Dashboards must enforce standardized calculations for ACoS, ROAS, NTB, and margin across regions, brands, and agencies.
Governance ensures that every stakeholder makes decisions from the same version of truth, preventing internal reporting disputes and misaligned strategies.
Continuously Refine Dashboard Design
Retail media strategies evolve. Dashboards and dashboard design should evolve with them. New campaign types, creative formats, attribution rules, and category strategies introduce new analytical needs.
Periodic dashboard audits ensure:
- Redundant views are removed
- New decision metrics are added
- Alert thresholds remain relevant
- Executive summaries reflect current priorities
Dashboards remain operational tools, not static reporting layouts.
Conclusion
Amazon Ads is now a critical revenue channel. The native Advertising Console is necessary for campaign execution, but it is not built for scalable analytics. Its reporting is limited to in-platform data, delayed attribution, and rigid views.
As accounts grow, teams face manual exports, inconsistent metrics, and blind spots across products and channels. This slows optimization and increases the risk of inefficient spend.
Improvado provides a complete alternative. It centralizes Amazon Ads and commerce data, standardizes metrics, and applies governance across campaigns, products, and teams. It delivers BI-ready datasets, native dashboards, and an AI Agent for instant analysis and reporting. Teams gain faster diagnostics, reliable budget control, and clear visibility into profitability and growth drivers.
Request a demo to see how Improvado builds an end-to-end analytics foundation for scalable retail media performance.