

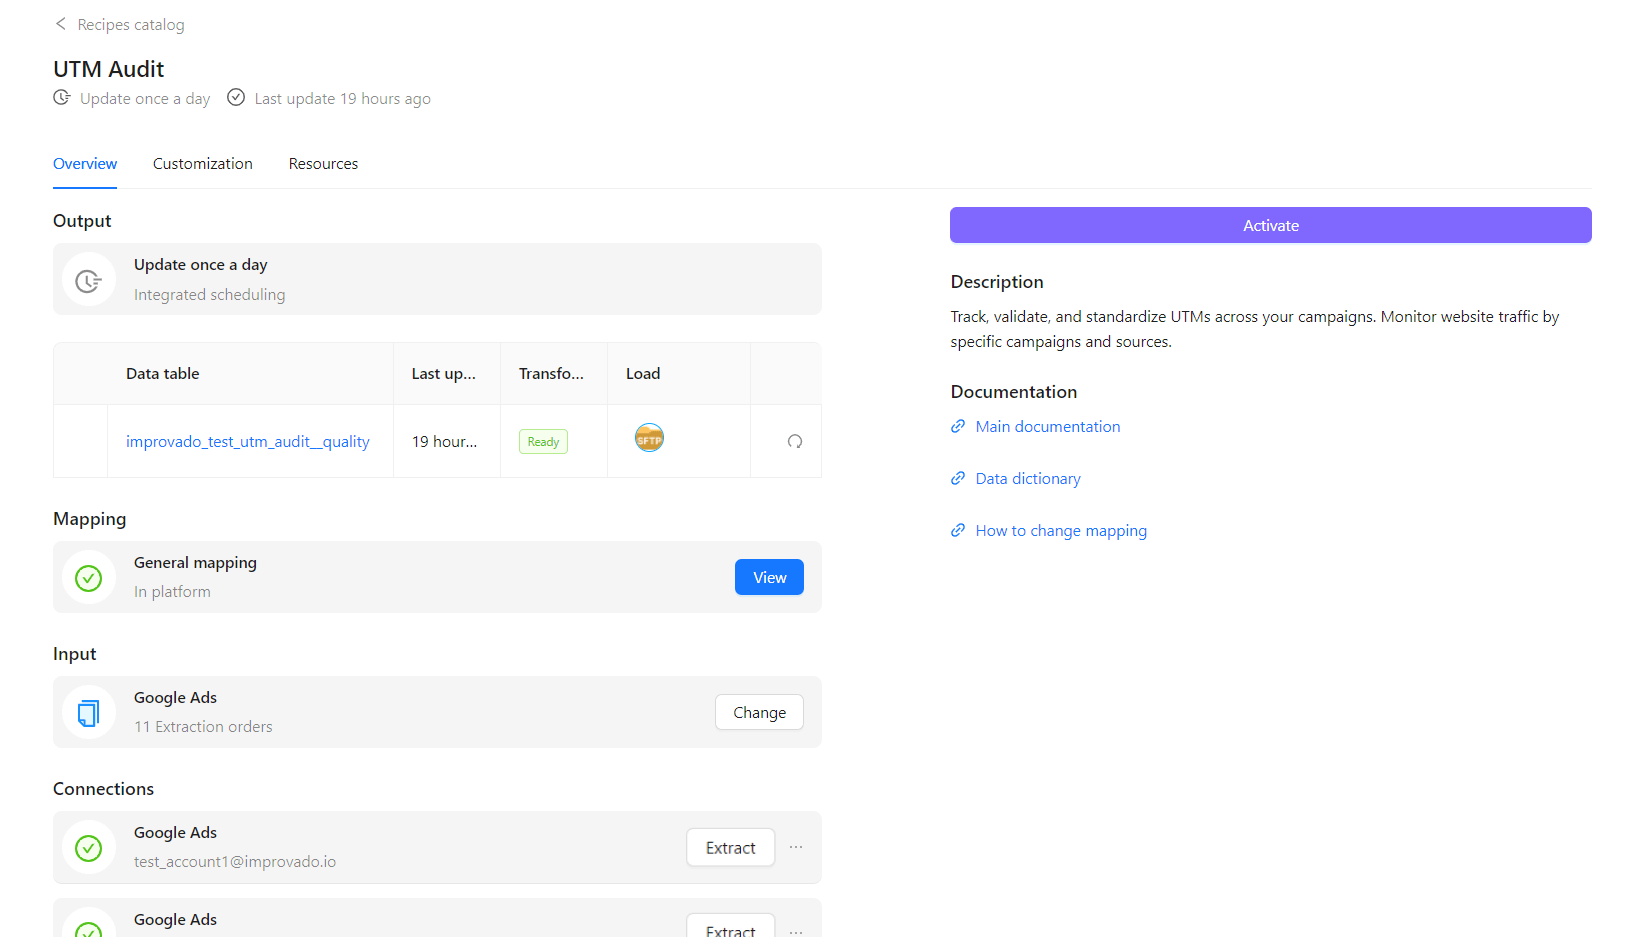
Recipe Observability
The following elements on the Overview tab provide observability of your ETL flow:
- Production Dashboards
- Data tables generated with the Recipe run
- Mapping information
- Connections - a list of your data source connections
- Input - a list of your Extraction orders
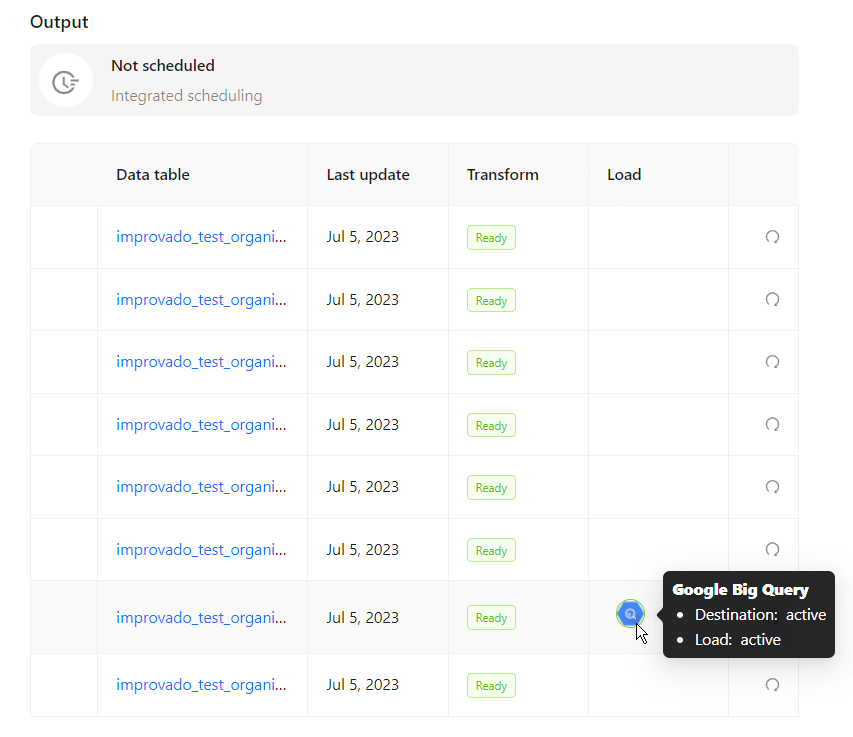
Data tables
Data table
You can dive into each Data table's details by clicking on its name.
Last update
The time of the previous successful table build.
Transform
Indicates the specific Data table transform status.
Load
Indicates the specific Data table load status.
You can view a more detailed status for your destination by hovering over it.
Action
By using the sync icon, you can rebuild a separate table after you've changed the mapping.
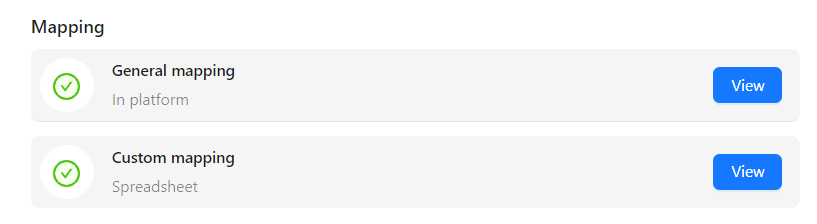
Mapping
This section displays the following links:
- General mapping with a link to the documentation (original state of mapping)
- Custom mapping if a custom mapping spreadsheet is provided for your agency
You can learn more about General and Custom mappings for a specific Recipe by clicking the View button.
Connections
A list of data sources that need to be authorized for data extraction.
If a data source was successfully connected, then your data source account name will be displayed, along with the green checkmark.
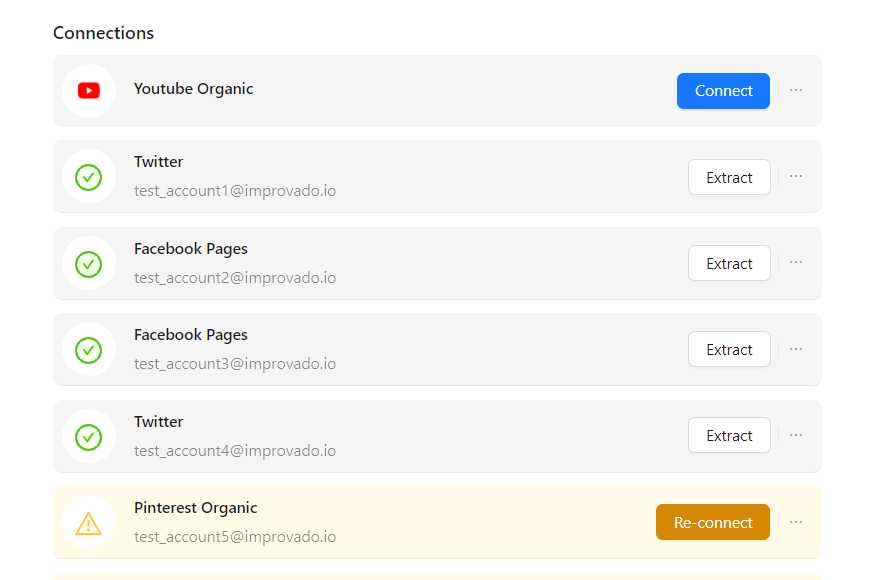
To add another account for the specific data source you’ve already connected, click on the options button with three dots and click on Connect another account.
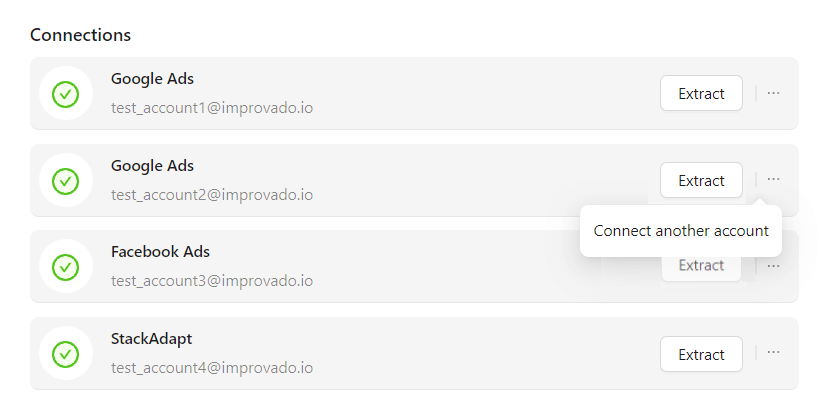
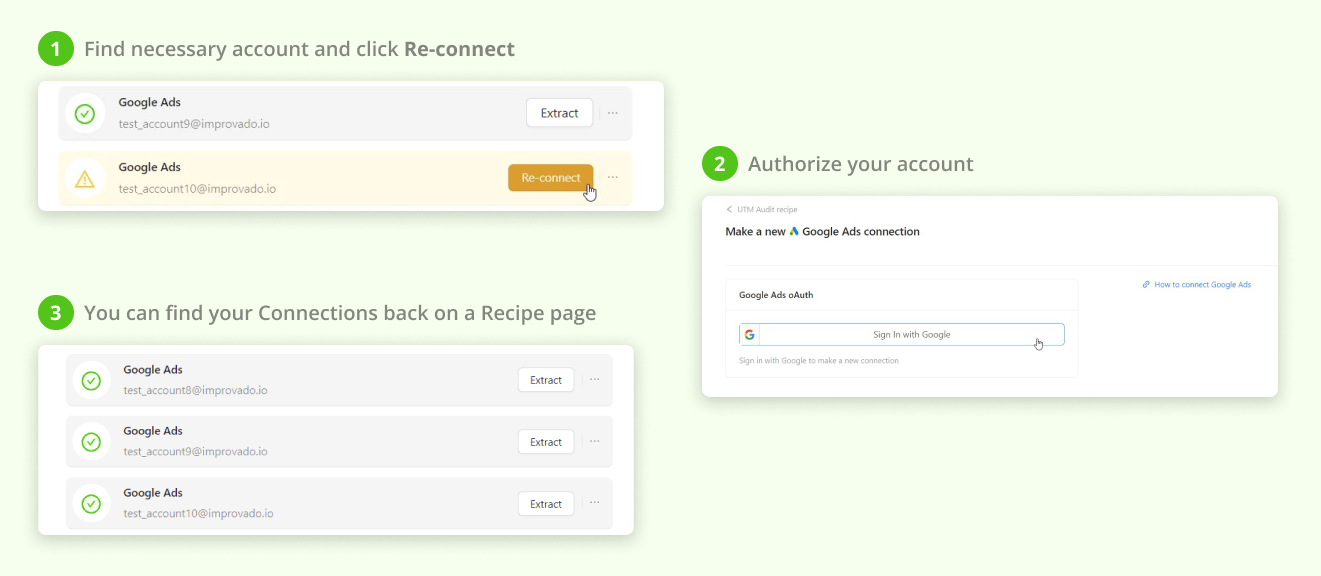
If there are any problems with your data source connection, the Re-connect button will be displayed.
How to re-connect data source connection
Input
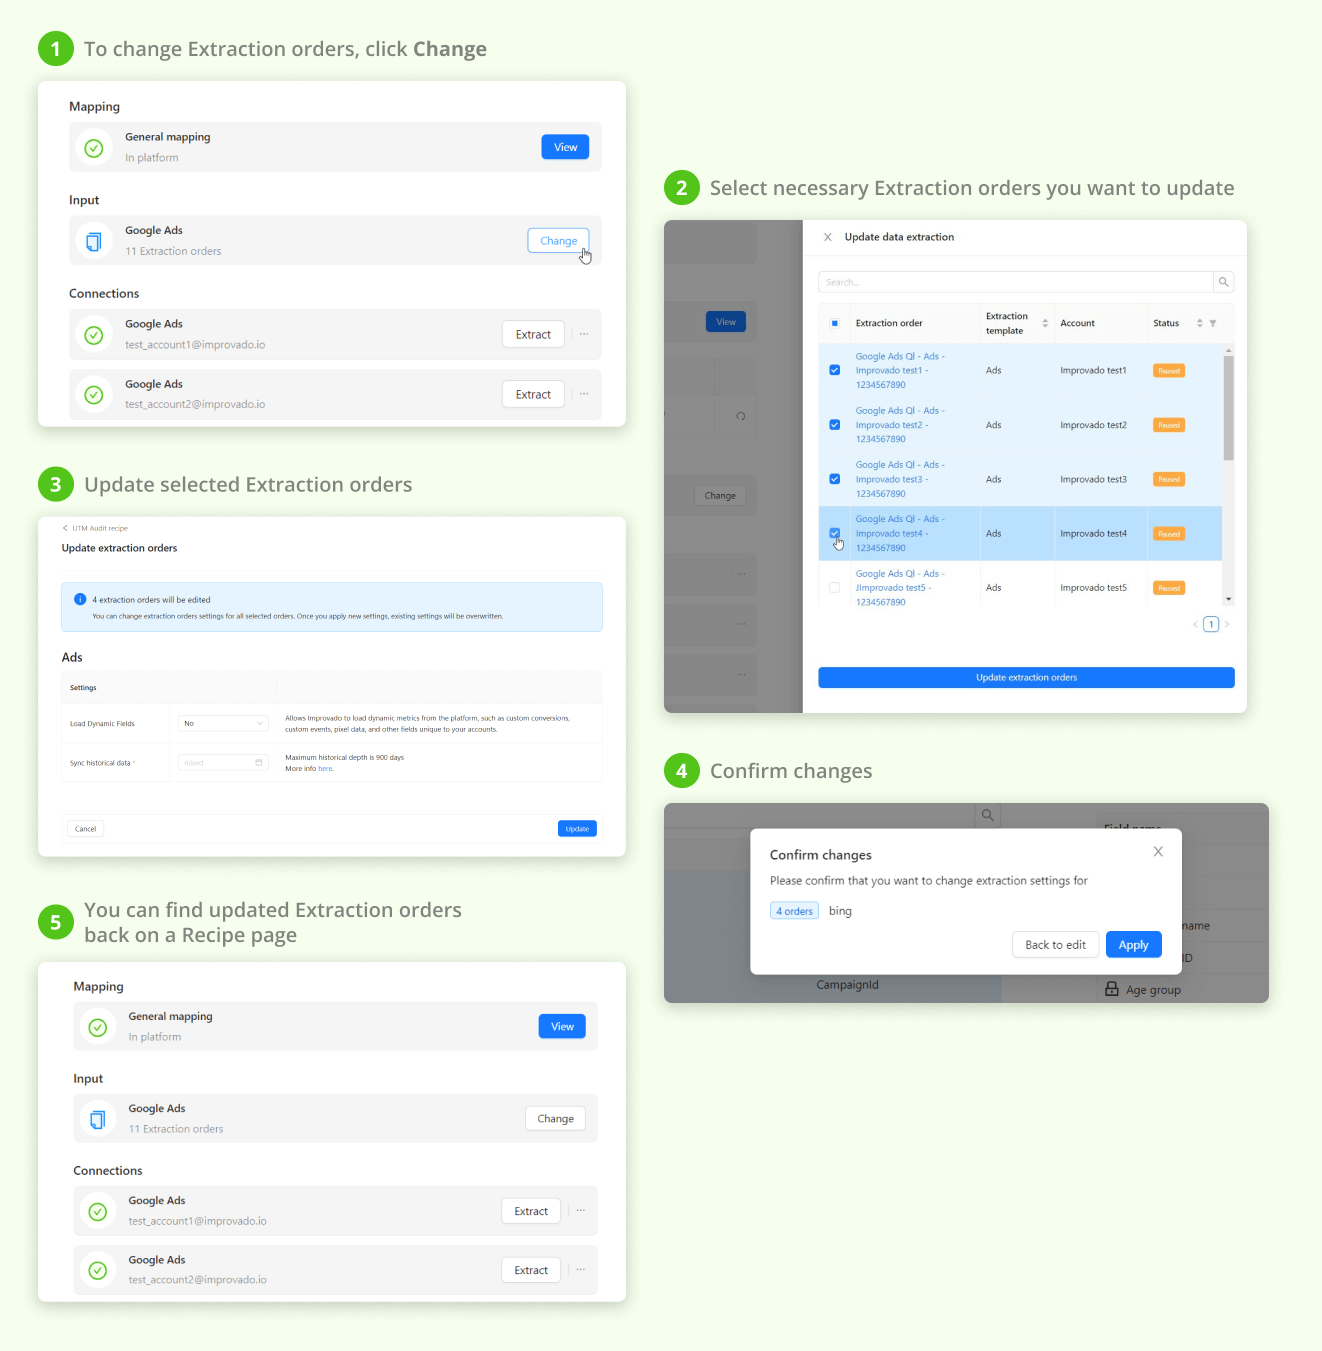
A list of Extraction orders grouped by data source. You can easily update any number of Extraction orders simultaneously by clicking the Change button.
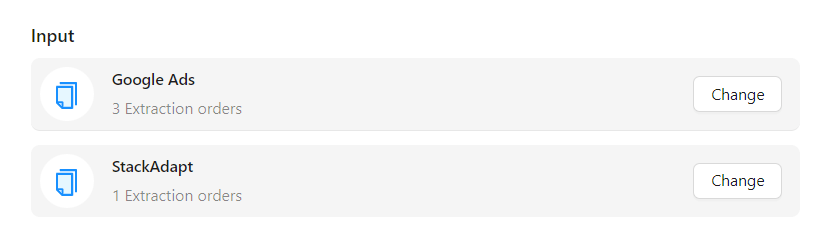
If any of the Extraction orders fail, then the element will look like this:

How to change Extraction orders
Was this article helpful?
Thanks for the feedback!
Questions? The Improvado team is always happy to help. Send us an email, contact your Customer Success Manager, or raise a request in the Improvado Service Desk.