Excel Visualization tool
What is Excel?
Microsoft Excel is a spreadsheet editor developed by Microsoft.
Credentials and Connection Details
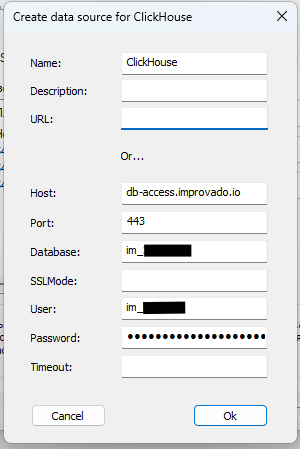
You need the following information for connection:
| Connection parameter | Credentials |
|---|---|
| user | improvado_{customer_id}_db |
| port | 443 |
| host | db-access.improvado.io |
| database | improvado_{customer_id}_{db_id} |
Connection Guide
- Download and install the latest version of ODBC driver for Clickhouse from Clickhouse GitHub (you can find latest version of ClickHouse ODBC driver here).
- Run ODBC Data Sources tool and configure connection with ClickHouse. If you downloaded the 64-bit Clickhouse driver previously, then you need to open ODBC Data Sources (64-bit).
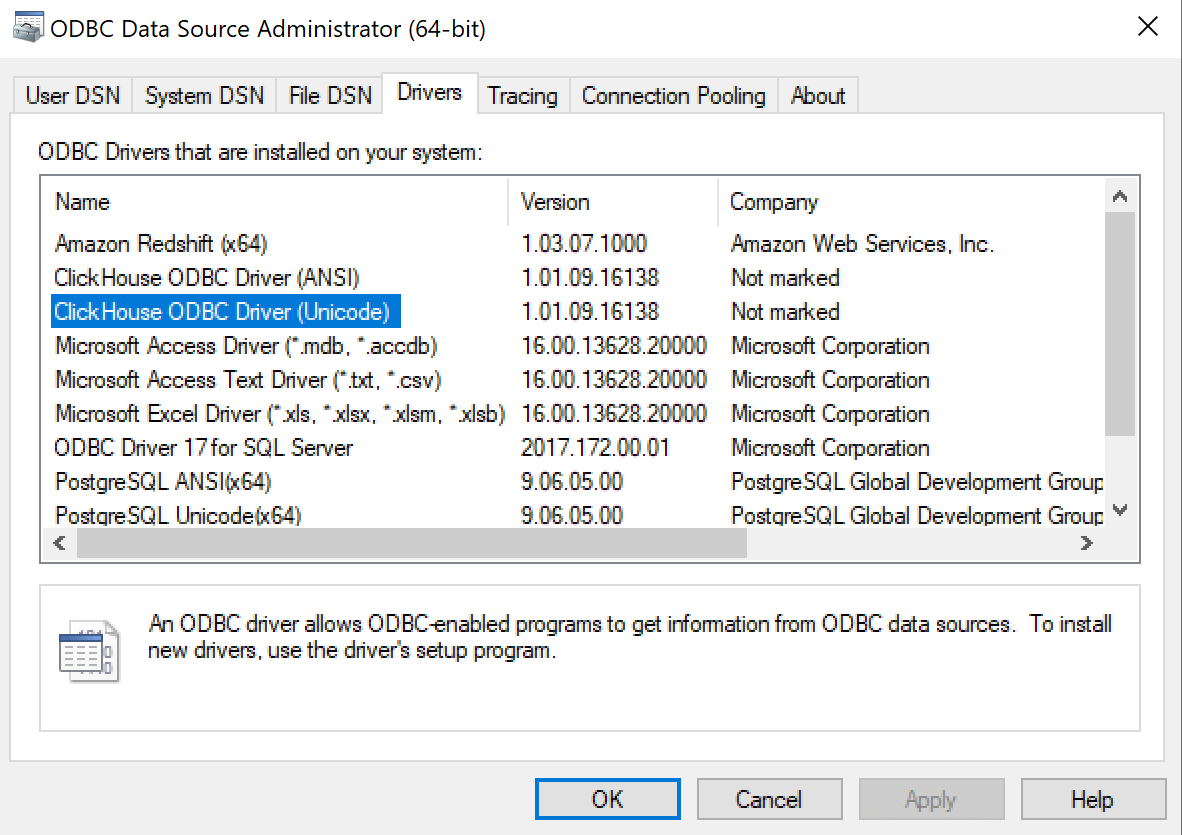
IMPORTANT: Make sure that Clickhouse drivers are available (use the Unicode one).
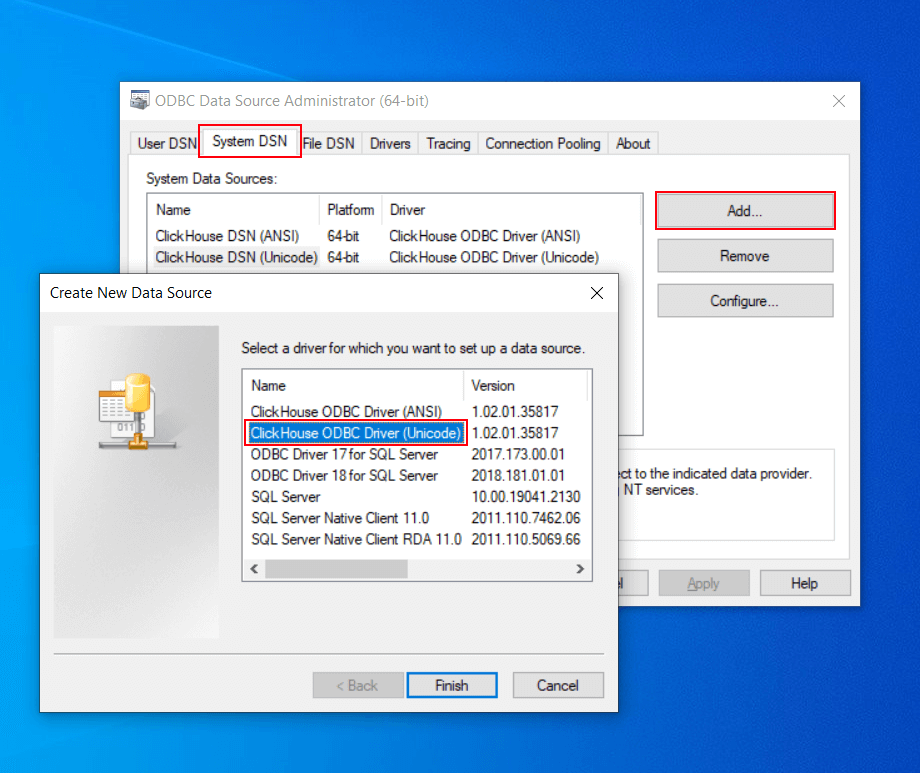
- Create a new System DSN, using the ClickHouse ODBC Driver (Unicode)
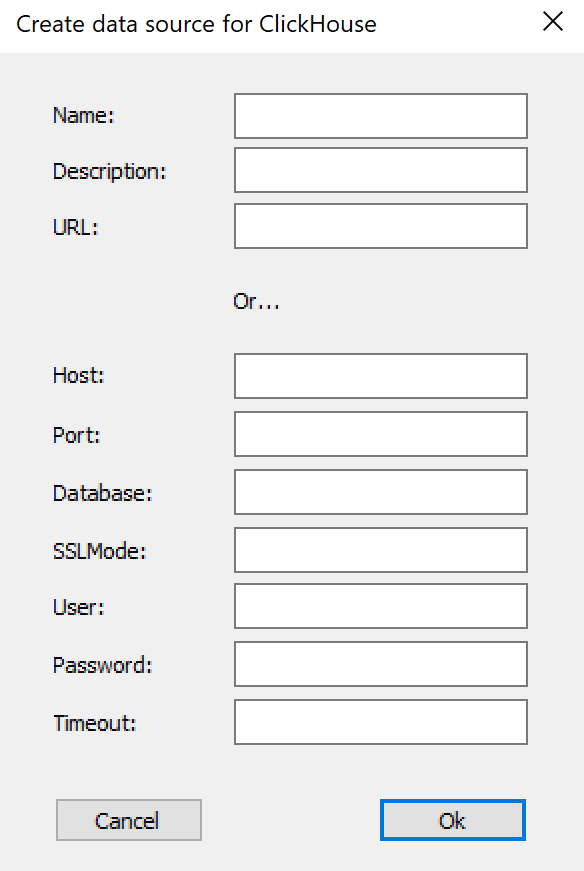
- Fill in your credentials (if you work with large tables you might need to increase the default Timeout from 30s to 60-300s depending on the size of your table) and click Ok to save the new System DSN connection.
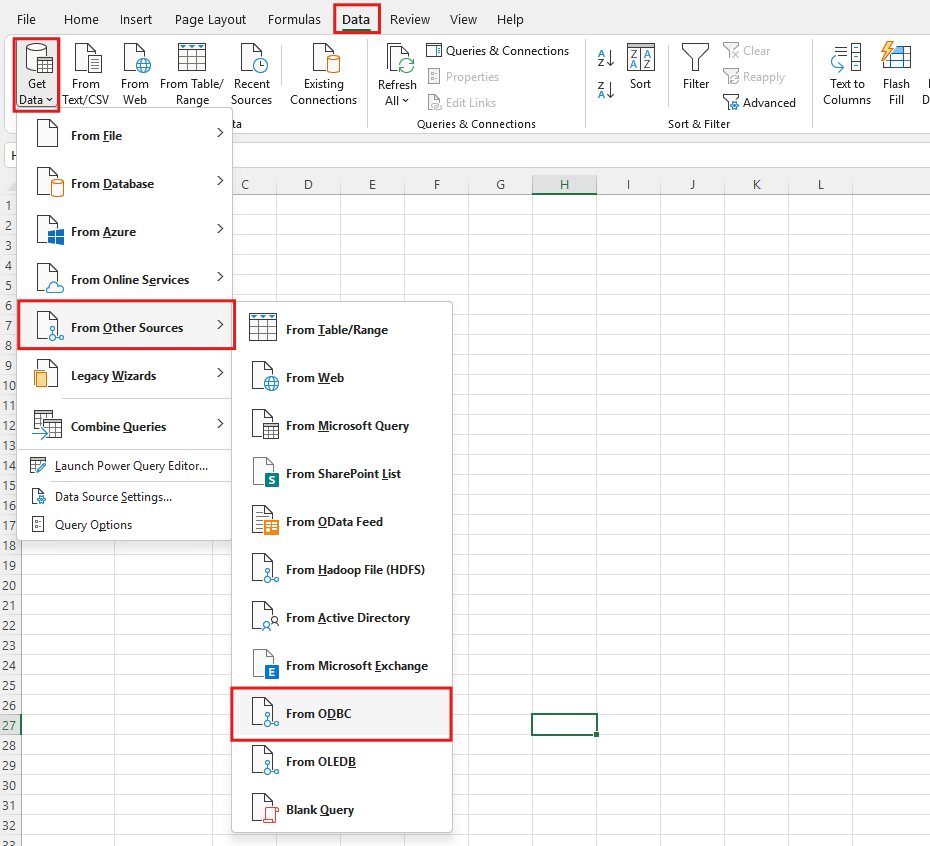
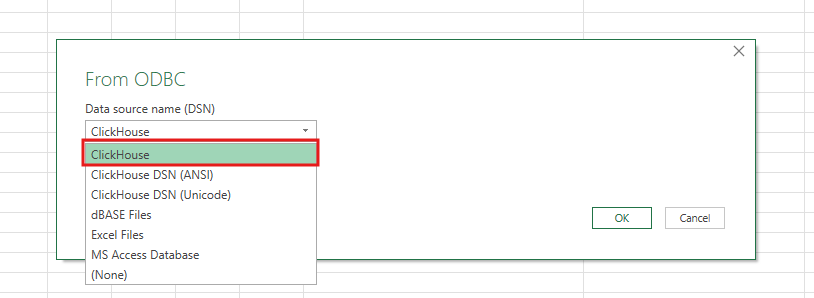
- Run Excel → Data tab → Get Data → From Other Sources → select From ODBC → Select the Data Source Name created on the previous step.
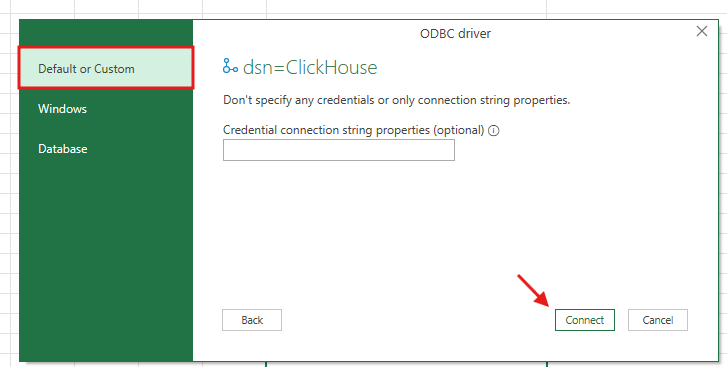
- Select Default or Custom option and click Connect.
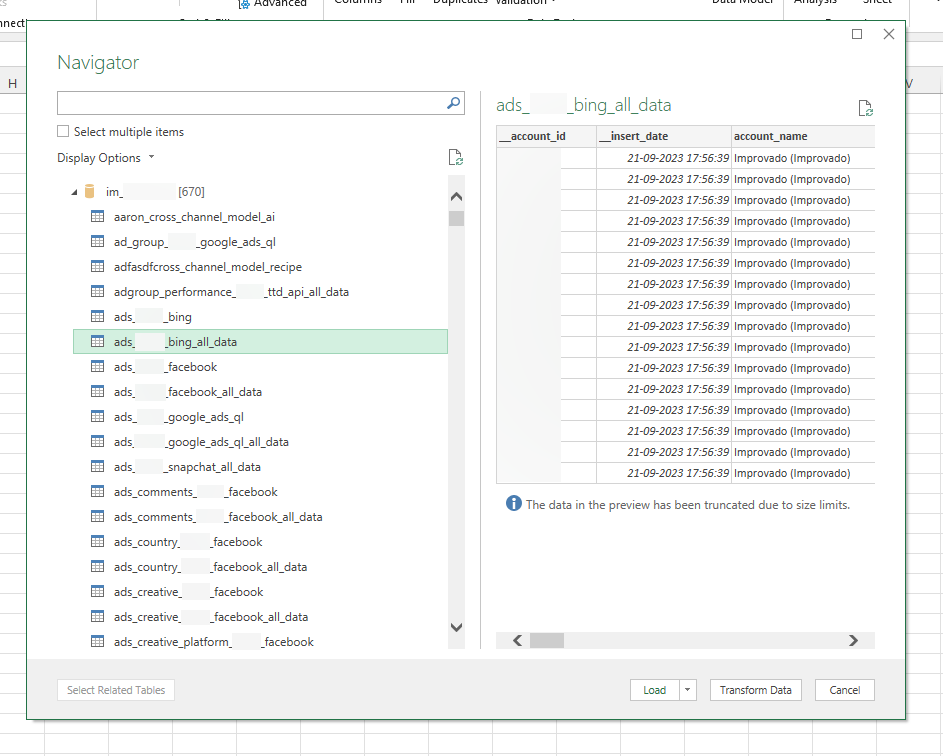
You will see the list of available databases and tables associated with them.
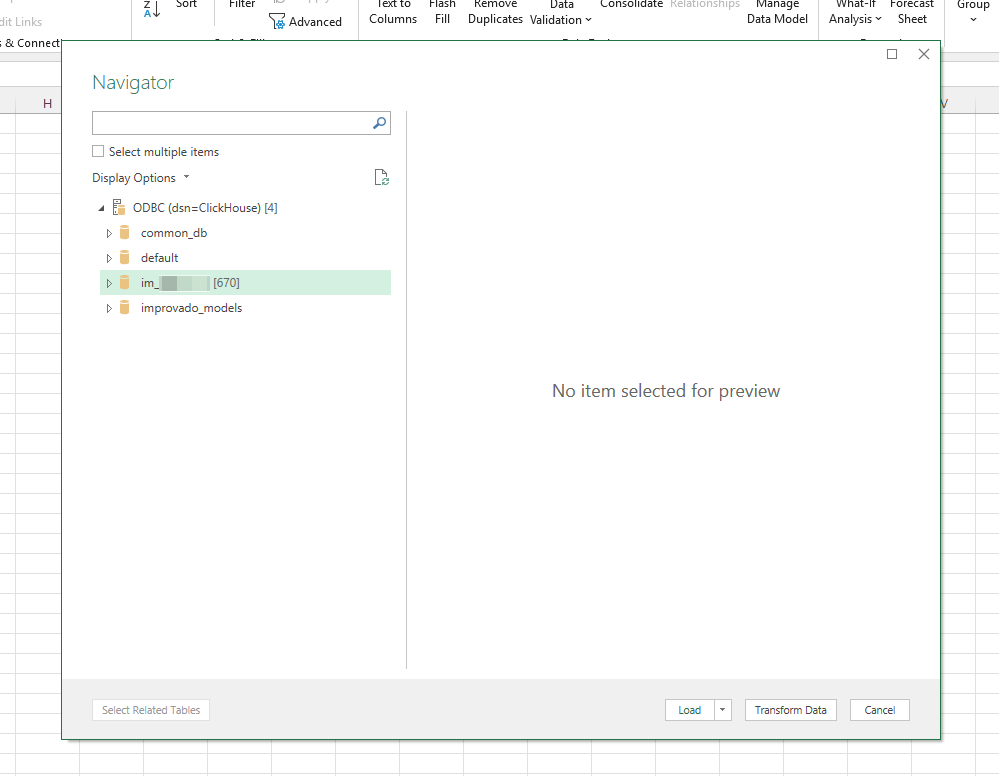
IMPORTANT: be sure to use tables with the _all_data suffix in your reports.
How to query ODBC data in Excel
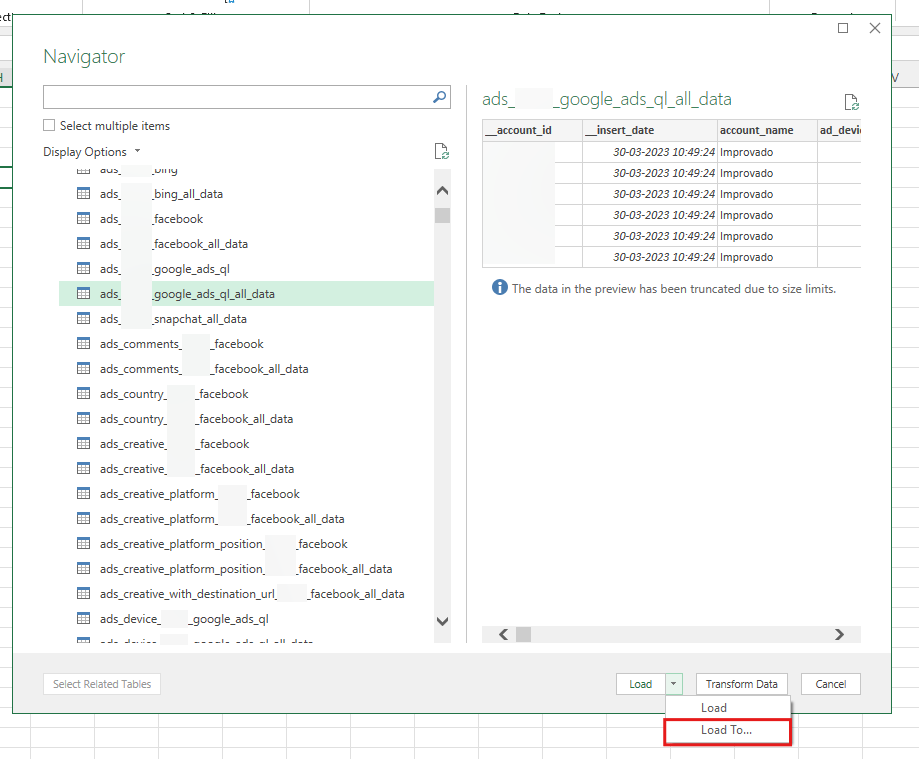
- To query data in Excel, select any table in the Navigator after connecting ODBC and click Load to:
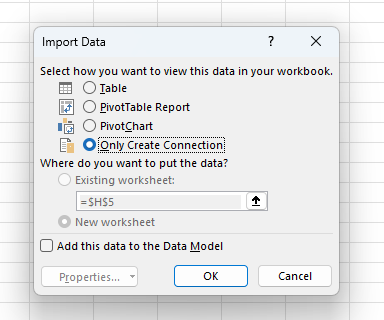
- In the next dialog window, let's for now just create a connection to the selected table by clicking Only Create Connection:
- This will create a new Query for selected table:
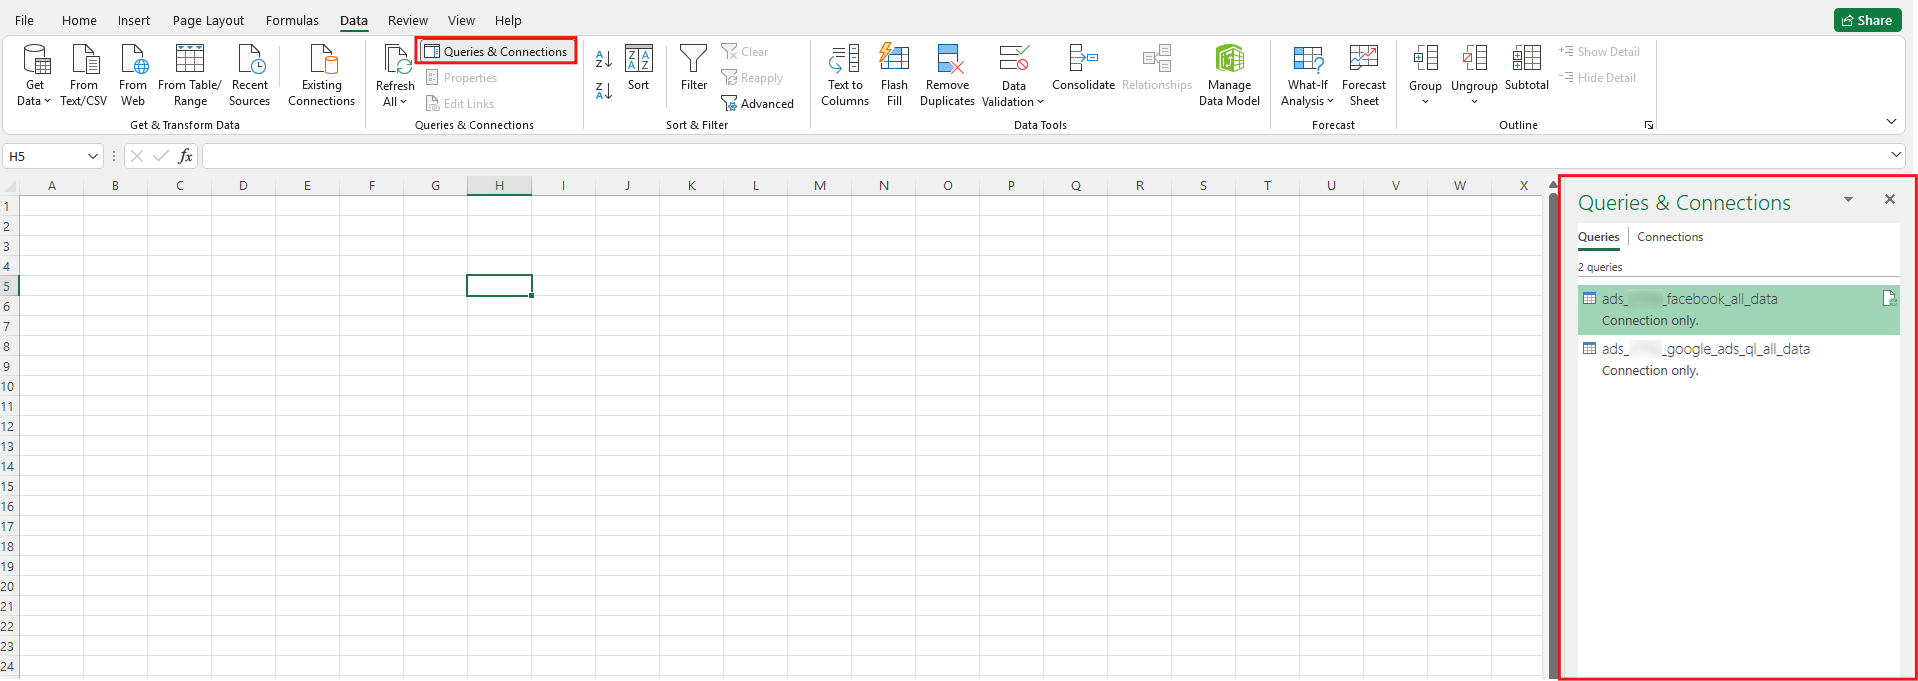
- To edit a query, double-click on necessary item in Queries & Connections. This will open Power Query Editor for selected query:
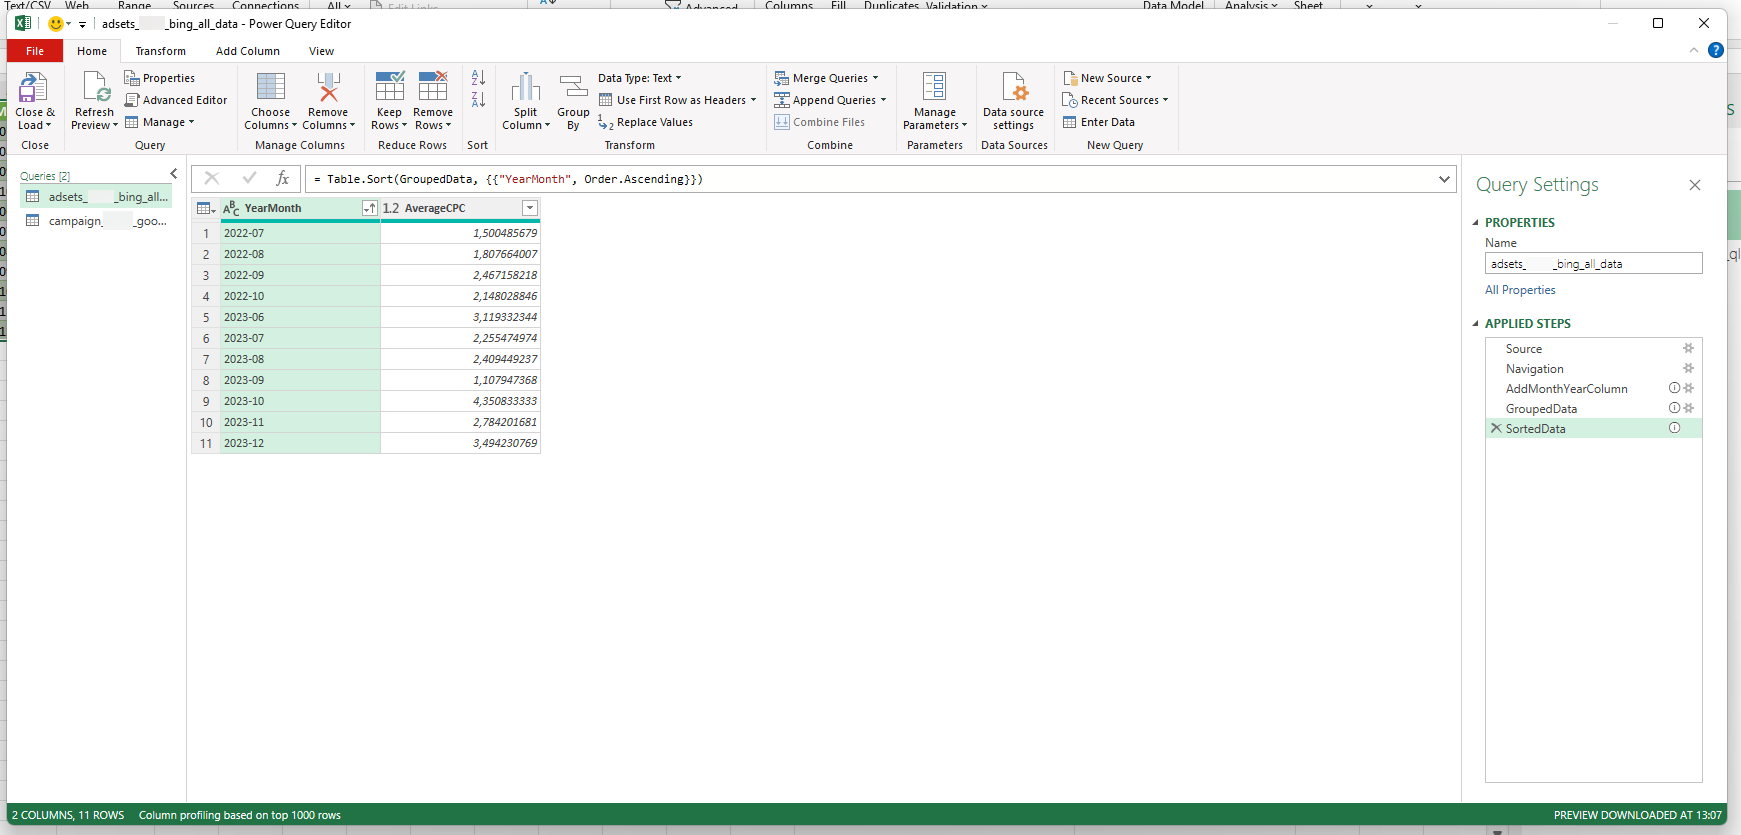
- Here, you can click on Advanced Editor to write a custom query using Excel's PowerQuery syntax:
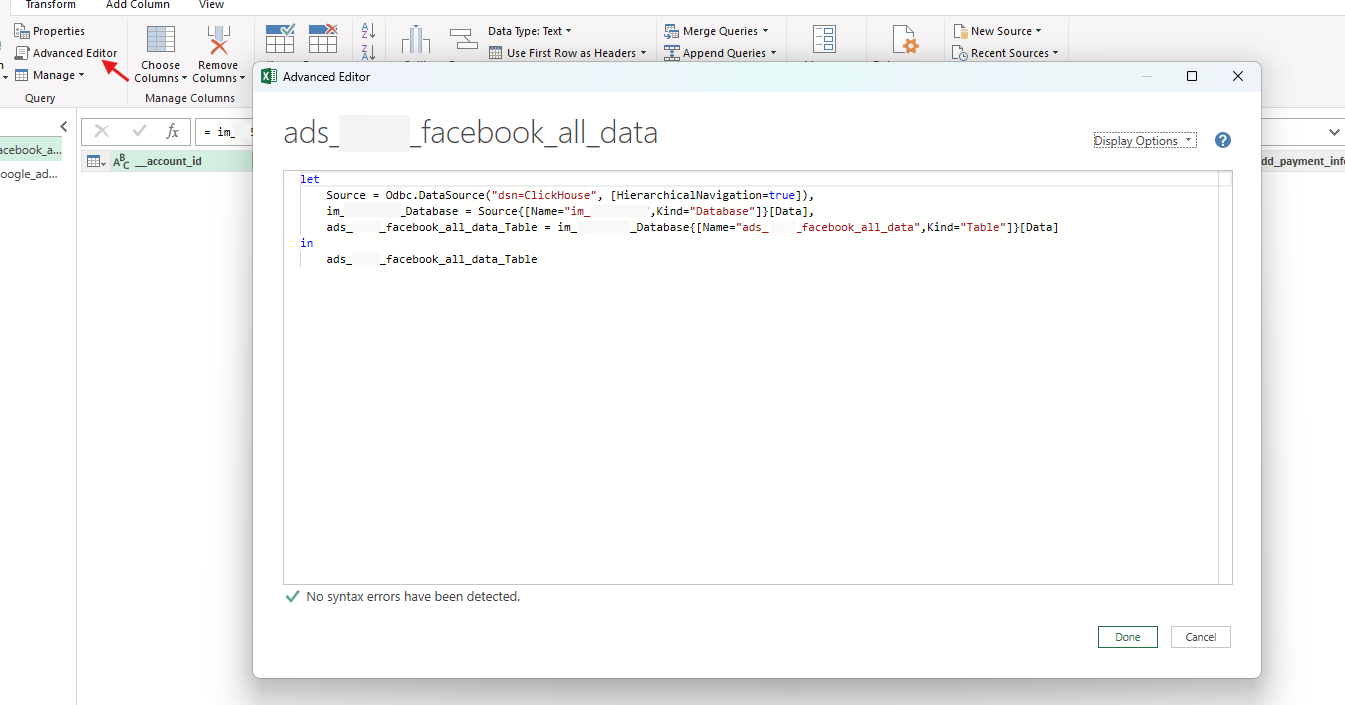
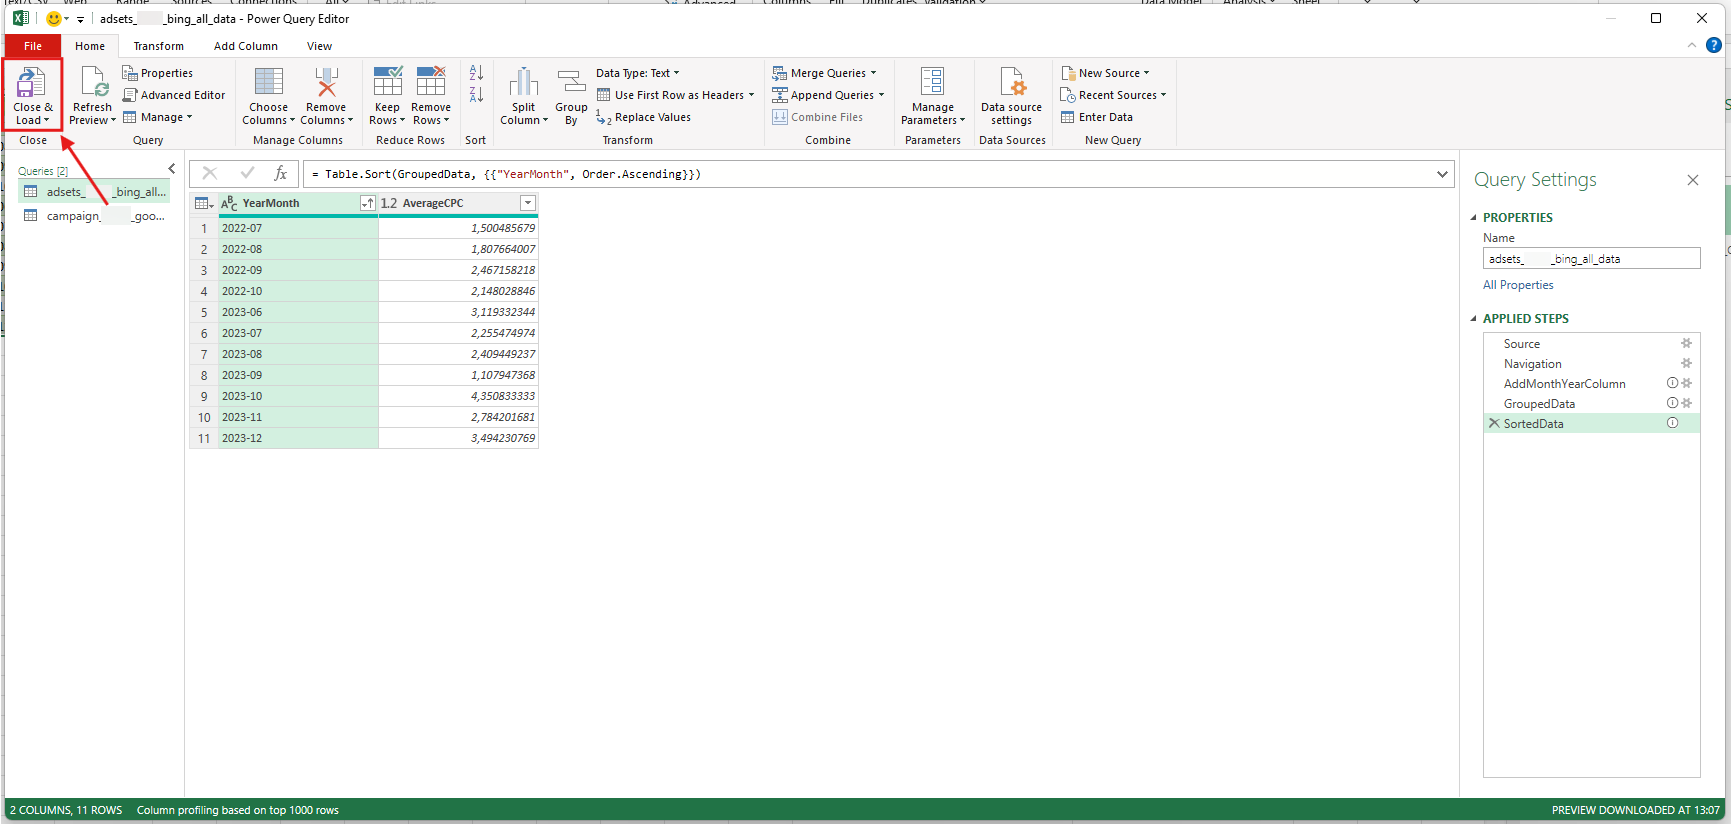
- Write a query to get necessary data for analysis and then click Done and Close & Load to save a query:
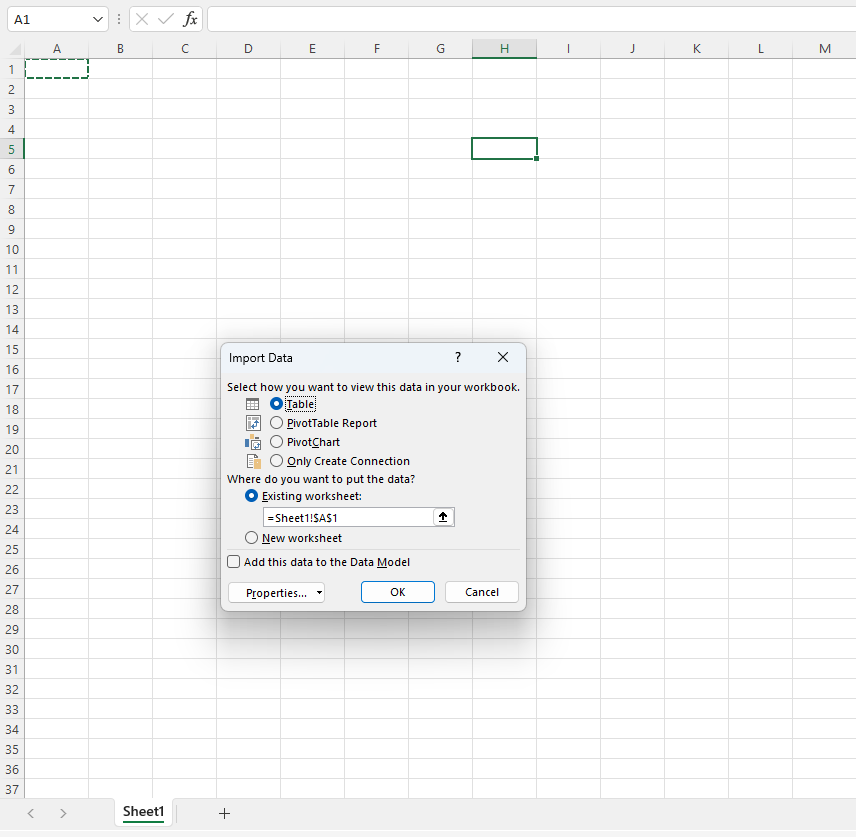
- The only thing left to do here is to actually add the data from the query to the spreadsheet. Right-click on the query and select Load to:
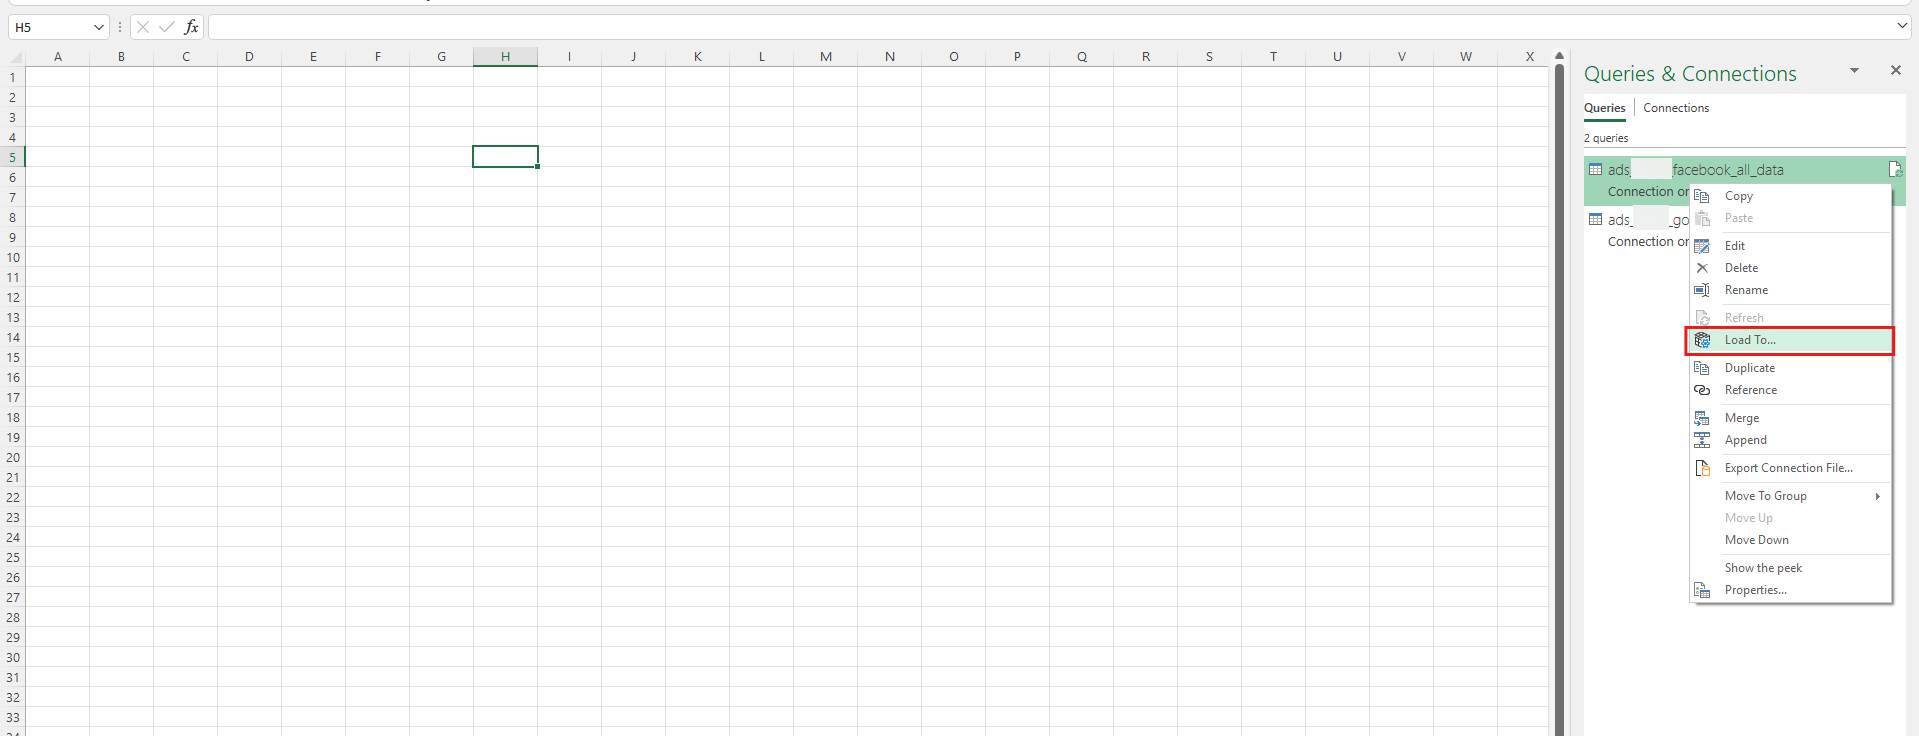
- Select Table option and select a cell where the result data will be located. Then click OK.
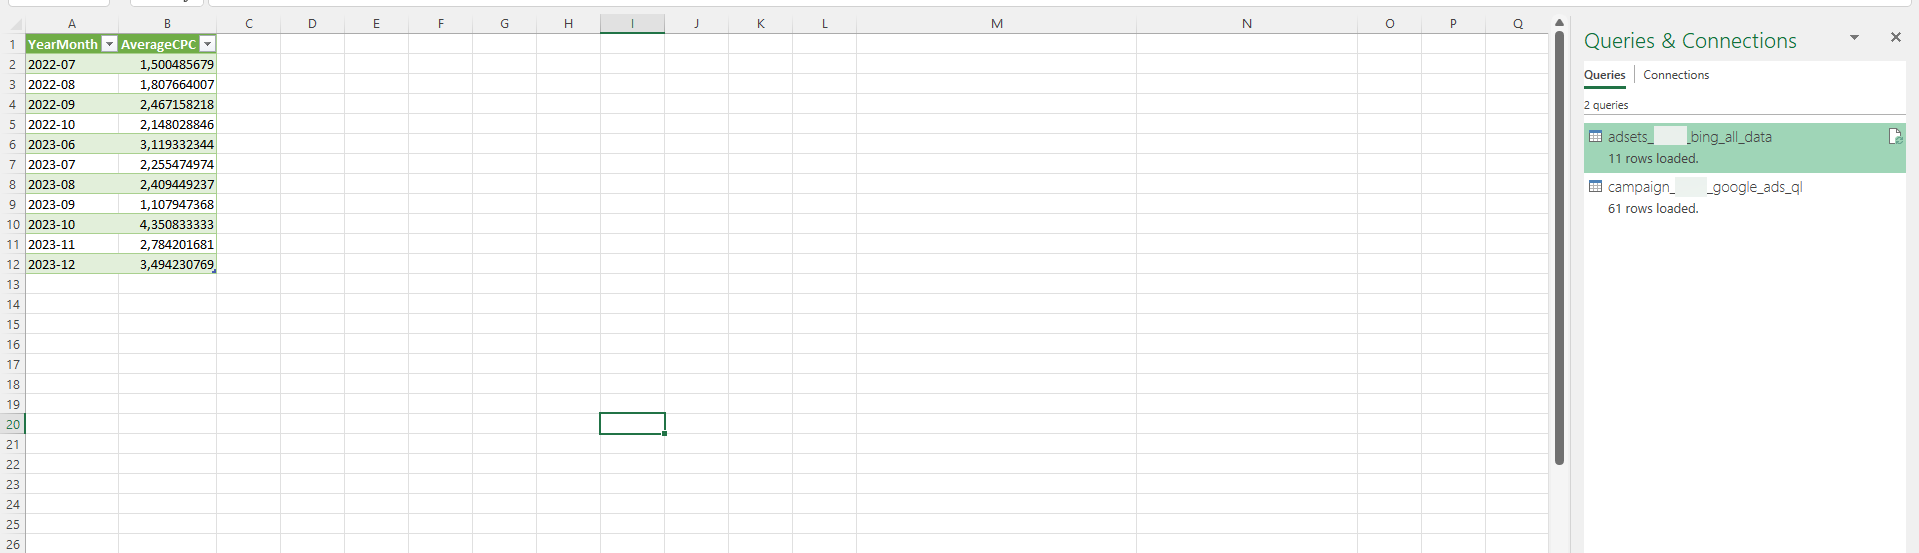
- Now you should see the result of your query directly in the spreadsheet:
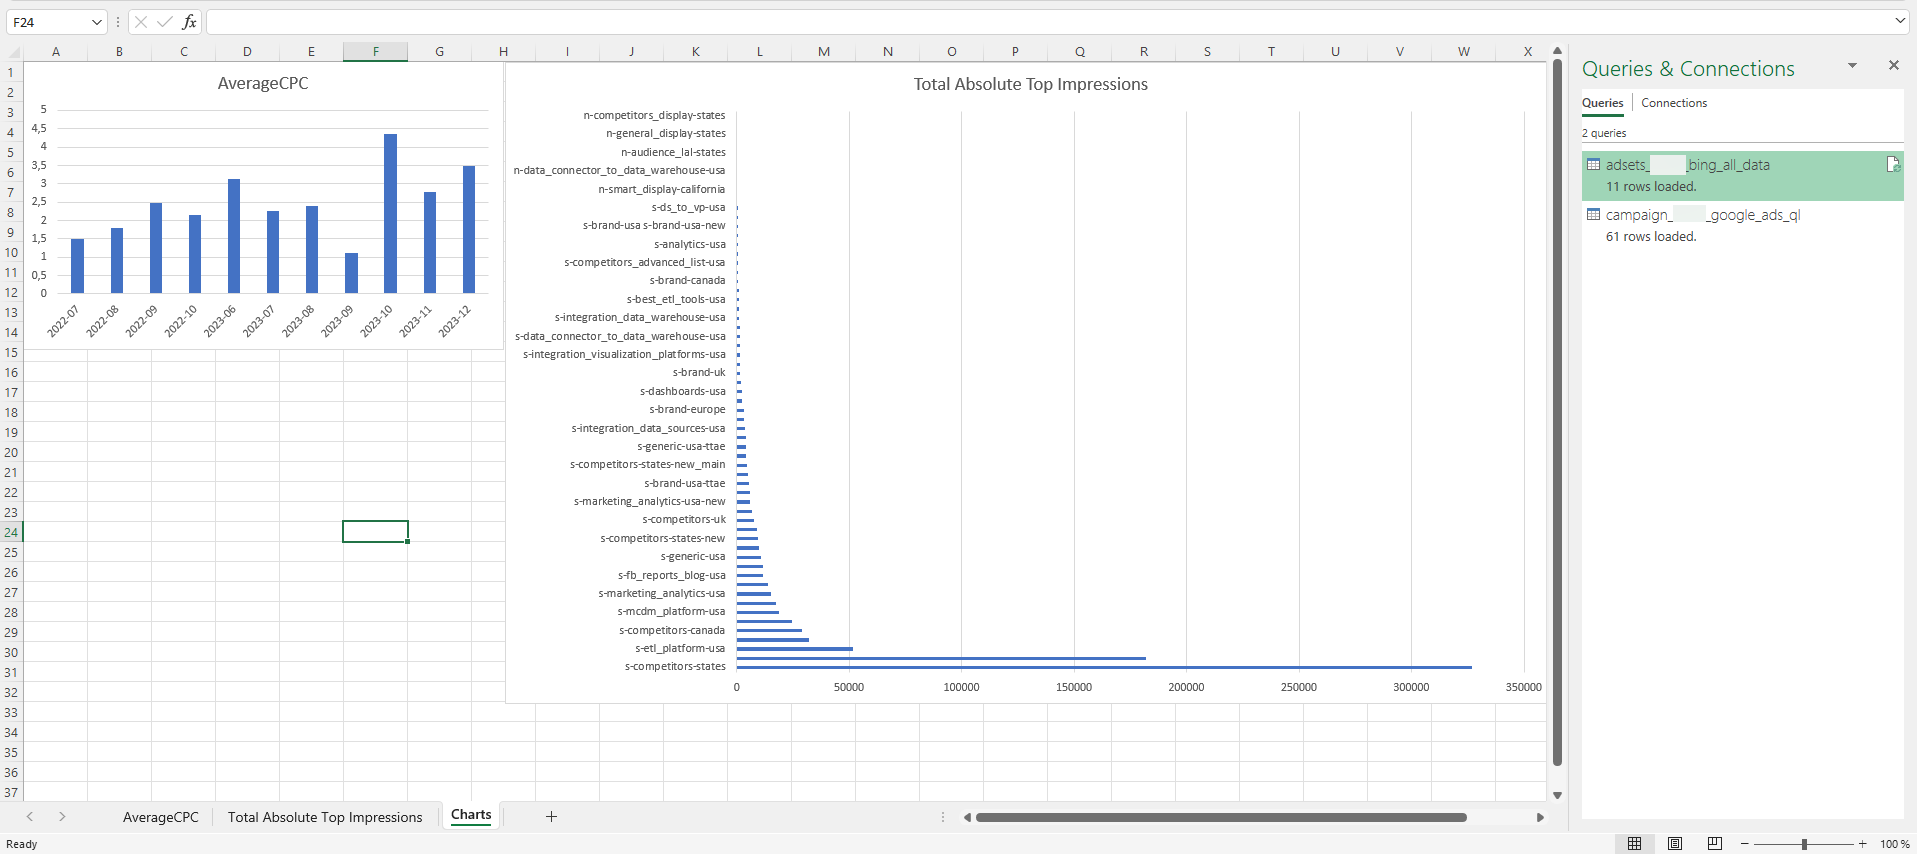
- And like with any spreadsheet data, you now can create charts to visualize your data:
Was this article helpful?
Thanks for the feedback!