Discover how the Data Preview feature within the AI Wizard empowers you to manipulate your data by applying filters, working with fields, and grouping data. This functionality allows you to hide or show columns, group data based on selected dimensions and metrics, and apply filters to explore your data in convenient way.
How to Use Data Preview?
Group Data
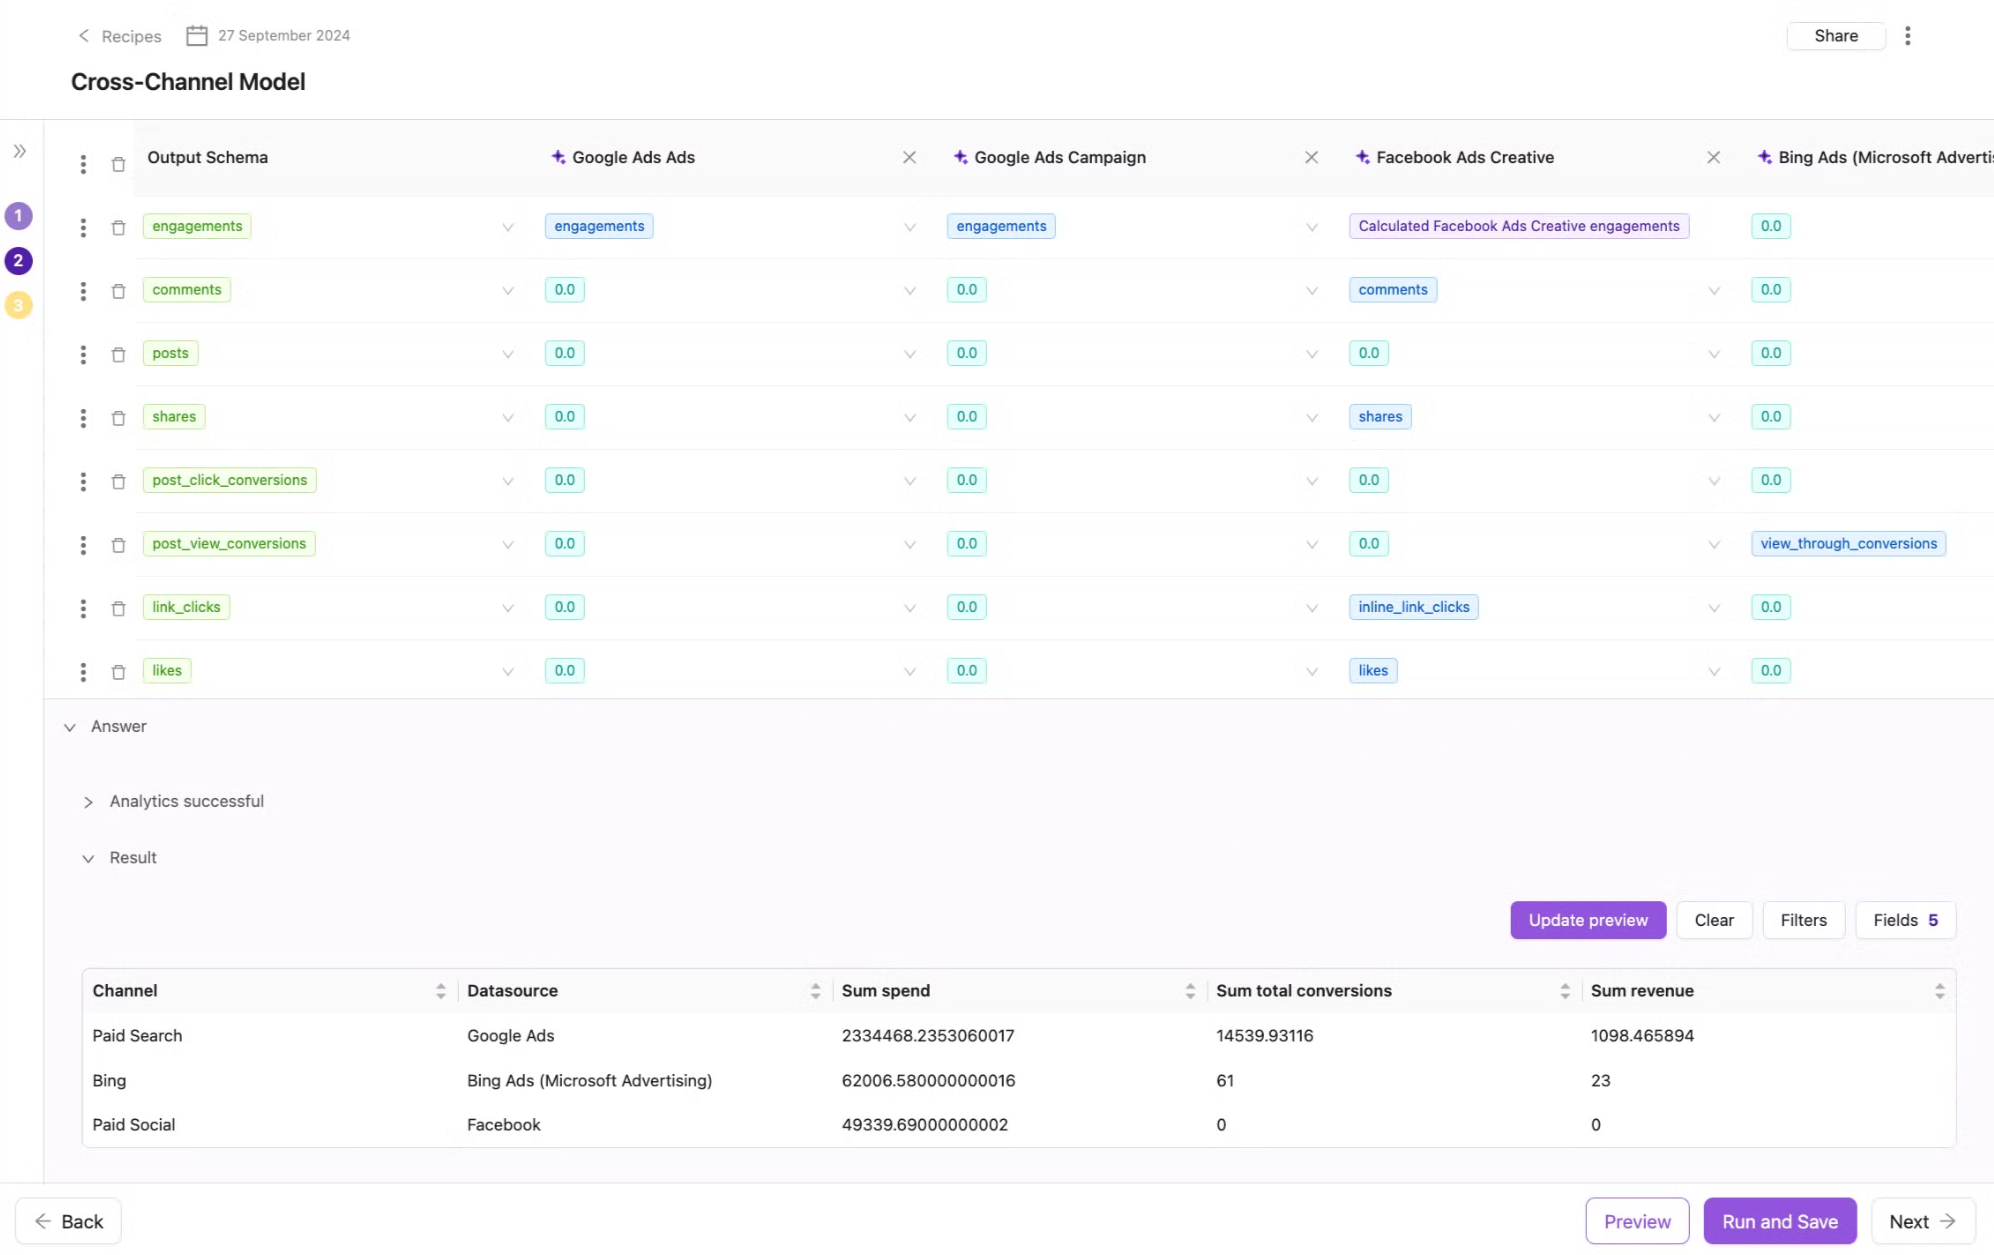
Grouping allows you to aggregate your data based on selected dimensions and metrics. By default, the aggregation function used for all metrics is Sum.
To group data:
In the Fields tab, select the fields you want to use:
~Dimensions: Choose the categorical fields you want to group by (e.g., Date, Data Source, Channel).
~Metrics: Choose the numerical fields you want to aggregate (e.g., Spend, Revenue, Total Conversions).
Check the Group By option to enable grouping.
Click Update Preview to apply the grouping to your data.
To hide or show columns:
Open the Data Preview within the AI Wizard.
Navigate to the Fields tab.
Use the checkboxes next to each field to select or deselect the columns you want to display.
Filter Data
Filters allow you to narrow down your dataset based on specific criteria.
To apply filters:
Navigate to the Filters tab in the Data Preview.
Click Add Filter to create a new filter condition.
Select the field you want to filter by (e.g., Date, Campaign Type).
Define the filter criteria (e.g., Channel = ‘Google Ads’).
Click Update Preview to apply the filters to your dataset.
Combining Grouping and Filters
You can also combine grouping and filtering to enhance your understanding of data.
Let’s take a look at a specific use case:
Apply grouping
In the Fields tab, under Dimensions, select Data Source and Channel.
Under Metrics, select numerical fields like Spend, Revenue, and Total Conversions.
Check the Group By option.
Click Update Preview to see the intermediate result.
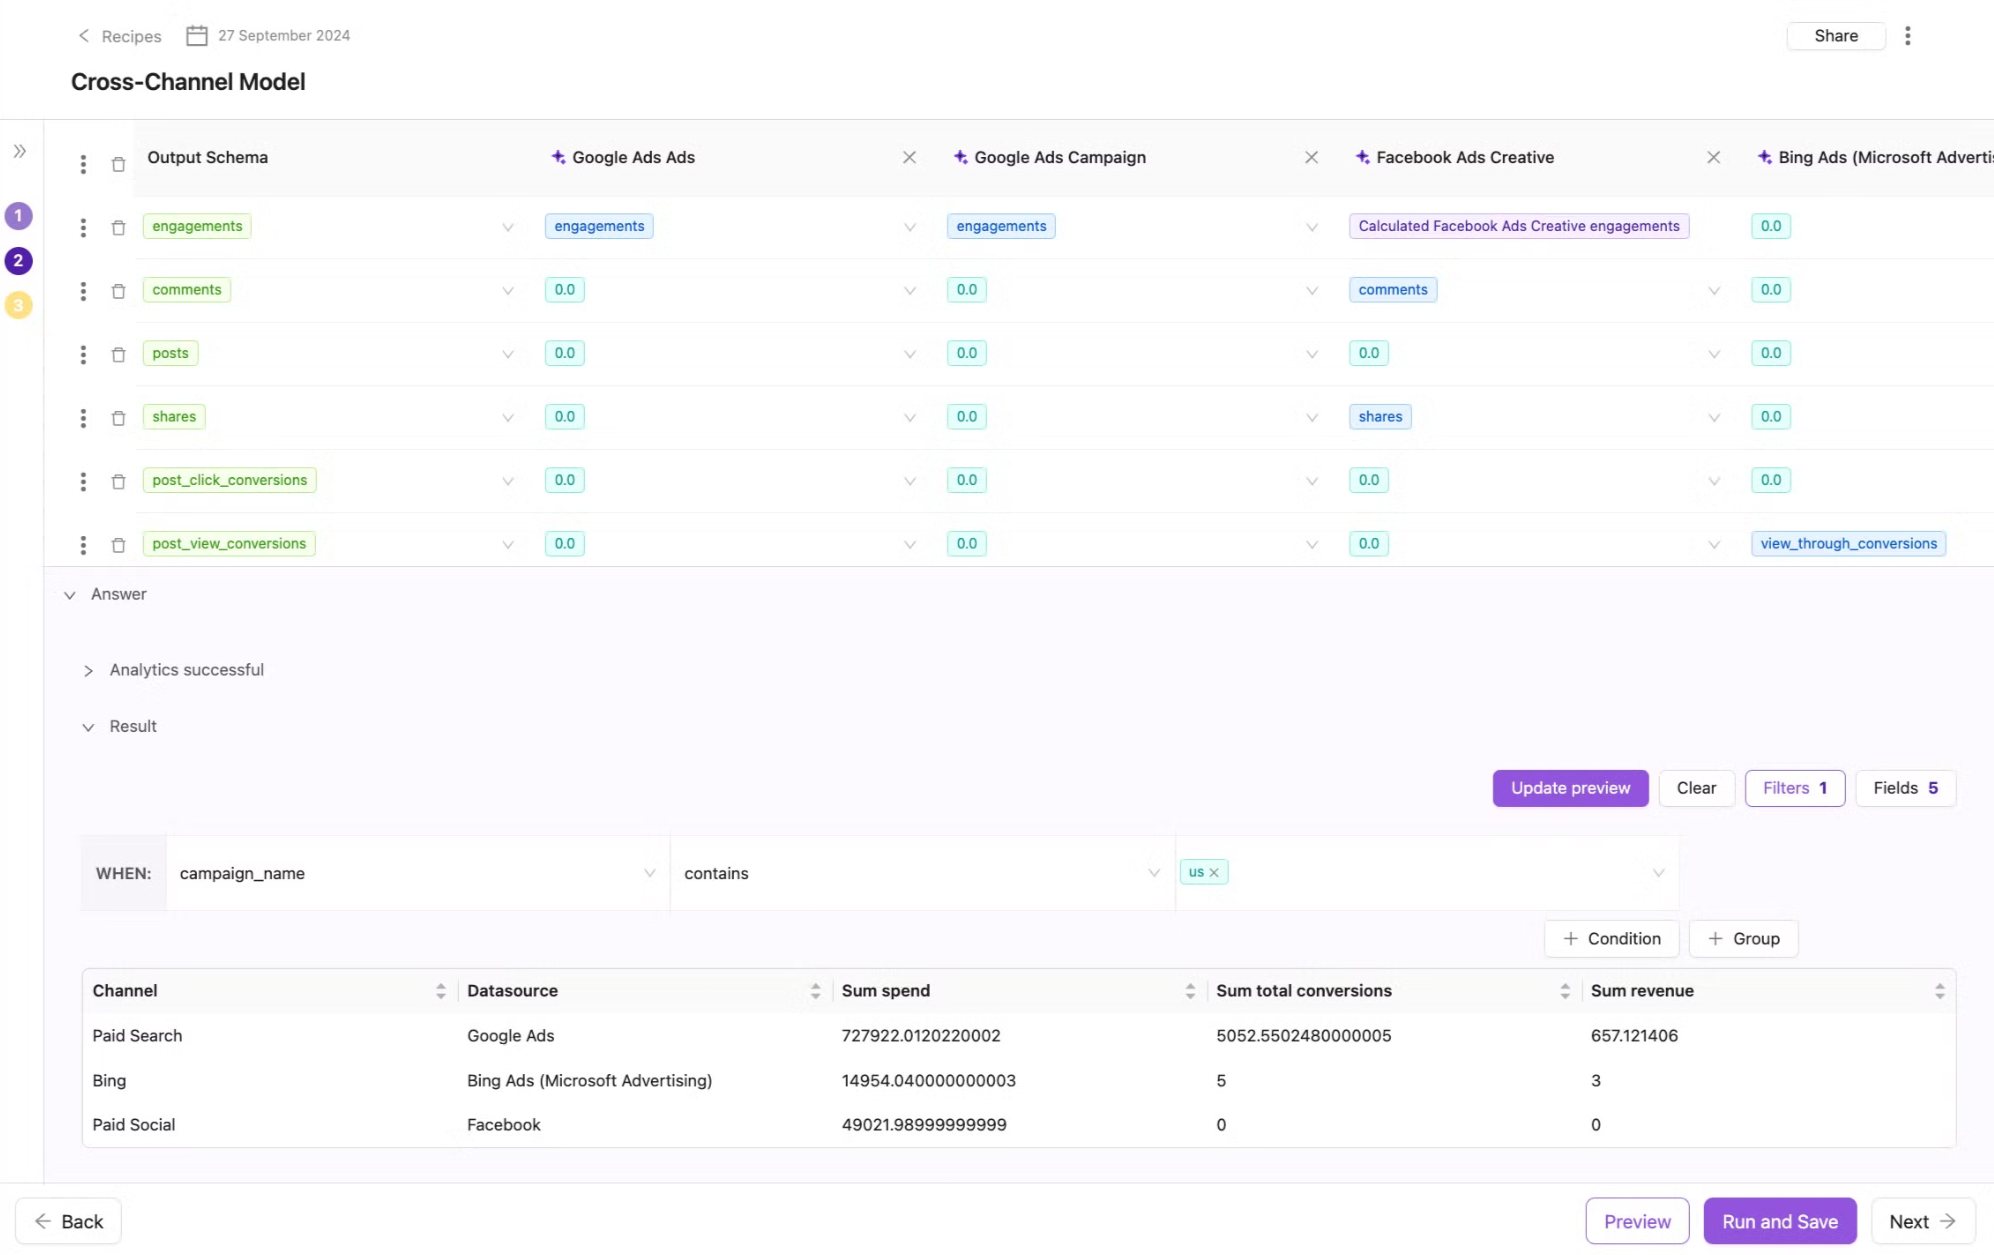
Apply a filter
Navigate to the Filters tab.
Click Add Filter.
Select Campaign Name as the field to filter.
Set the condition to contains and enter “usa”.
Click Update Preview to apply a new filter.
Click Update Preview to apply both the grouping and the filter.
Conclusion
The Data Preview feature in the AI Wizard simplifies the data analysis process by allowing you to easily customize your dataset. Understanding how to work with fields, apply grouping, set up filters, and combine these functionalities enables you to efficiently analyze and compare your marketing data and understand it better.
Setup guide
Schema information
Settings
No items found.
Troubleshooting
Troubleshooting guides
Check out troubleshooting guides for
Preview Data
here:
Limits
Preview Data API changes
Frequently asked questions
No items found.
Thank you for your feedback!
Oops! Something went wrong while submitting the form.


.png)