Data Governance Dashboard
Data Governance Dashboard provides a unified view of your marketing compliance metrics and performance in real time.
It helps you monitor adherence to rules, identify recurring issues, and improve campaign data quality across all connected data sources.
General
The General section displays overall compliance trends and summarizes key governance metrics across all rules and data sources.
Charts and metrics:
- Total Compliance Rate — overall adherence across all active rules.
- Performance Compliance Rate — compliance with performance-related rules.
- Taxonomy Compliance Rate — structure and naming consistency across campaigns.
- Total Number of Active Rules — number of currently enforced rules.
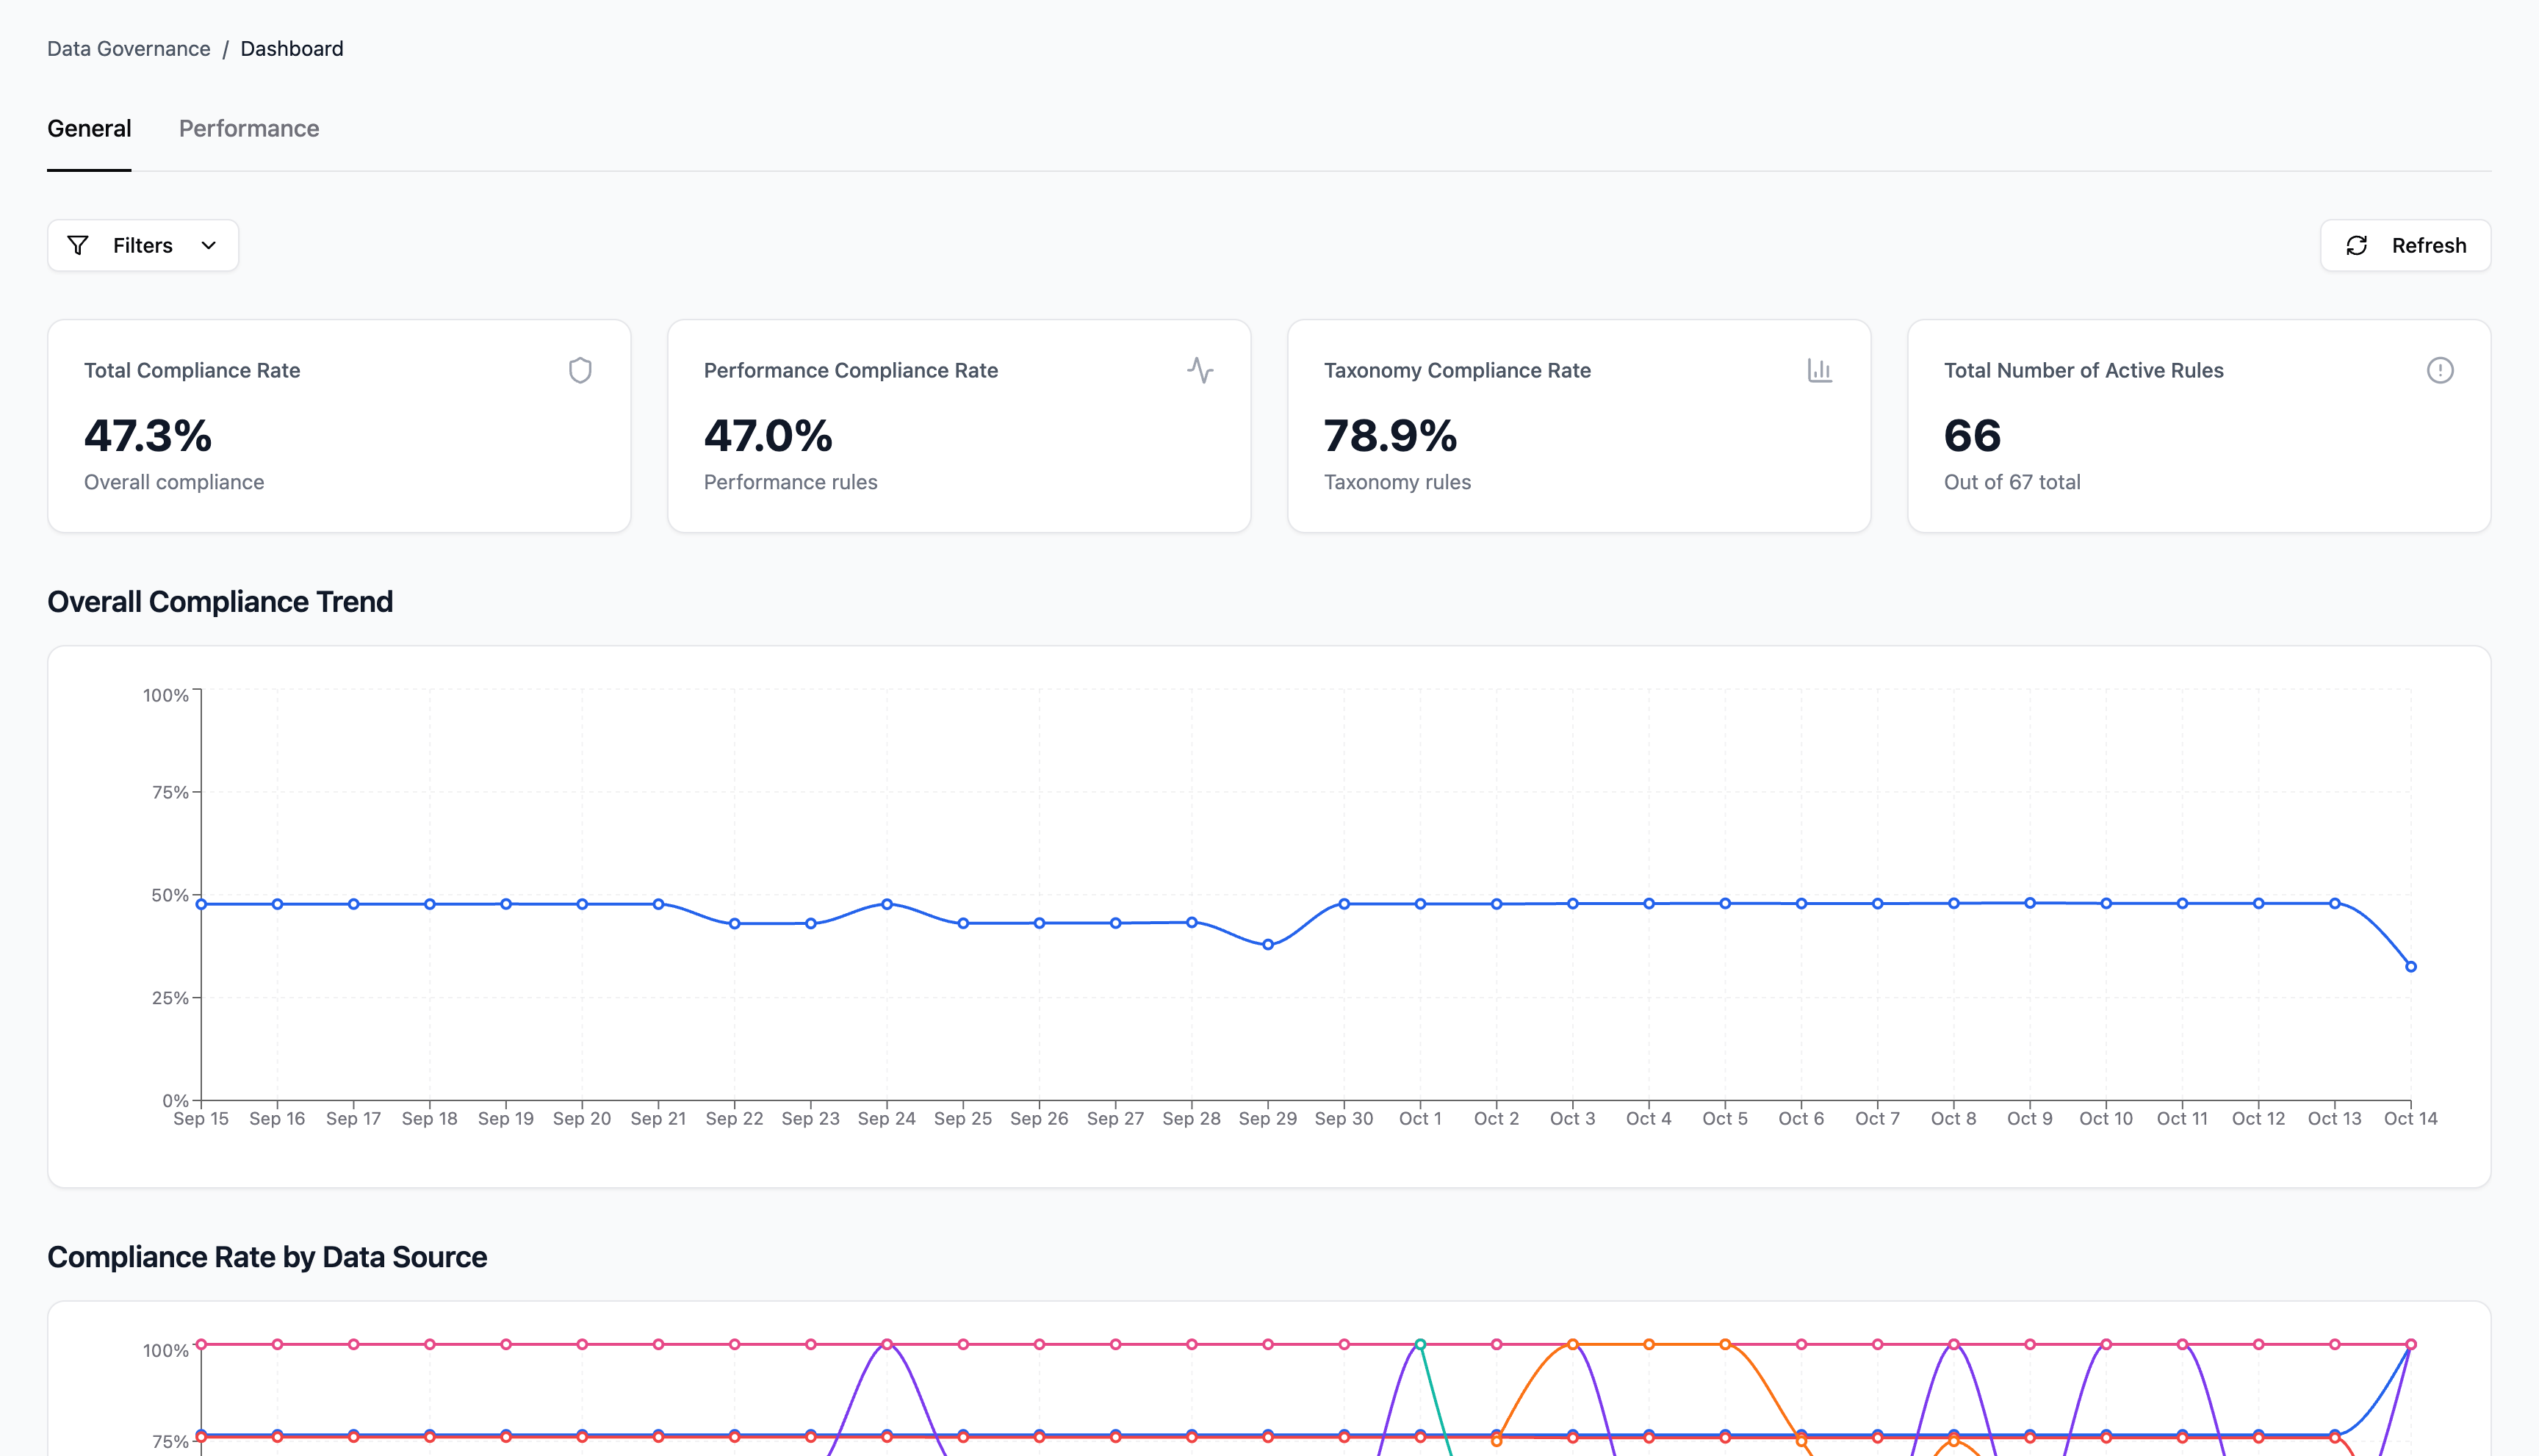
The Overall Compliance Trend line chart shows changes in total compliance over time, helping you track progress and detect unusual drops.
The Compliance Rate by Data Source chart breaks down compliance across connected platforms such as Google Ads, Facebook, Bing Ads, GA4, Semrush, and Improvado Platform, enabling quick comparison between channels.
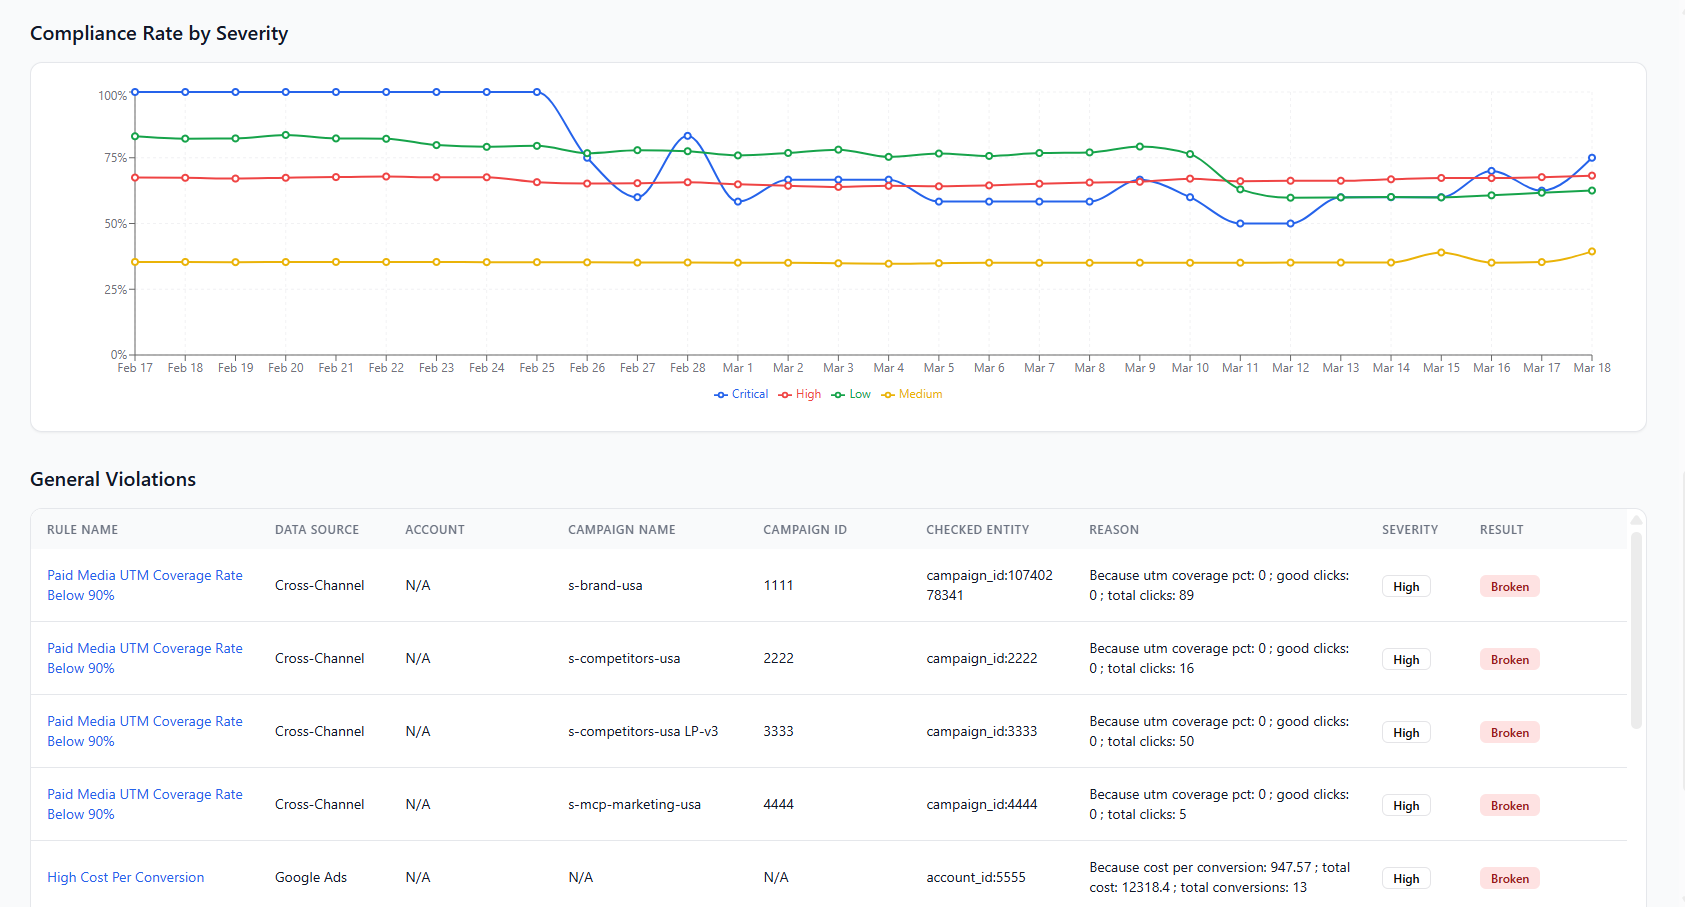
Finally, the Compliance Rate by Severity chart highlights how compliance varies by rule importance (High, Medium, Low, Custom), helping teams focus on the most critical issues first.
Performance
The Performance section focuses on rules directly impacting campaign efficiency, spend, and results quality.
Key metrics:
- Performance Compliance Rate — percentage of campaigns meeting defined performance criteria.
- Active Performance Rules — total active rules monitoring campaign metrics.
- Total Violations — number of rule breaches detected.
- Total Checks — total rule evaluations executed.
Below, two bar charts visualize performance compliance by Data Source and Severity, allowing you to identify where most violations occur and which channels may need optimization.
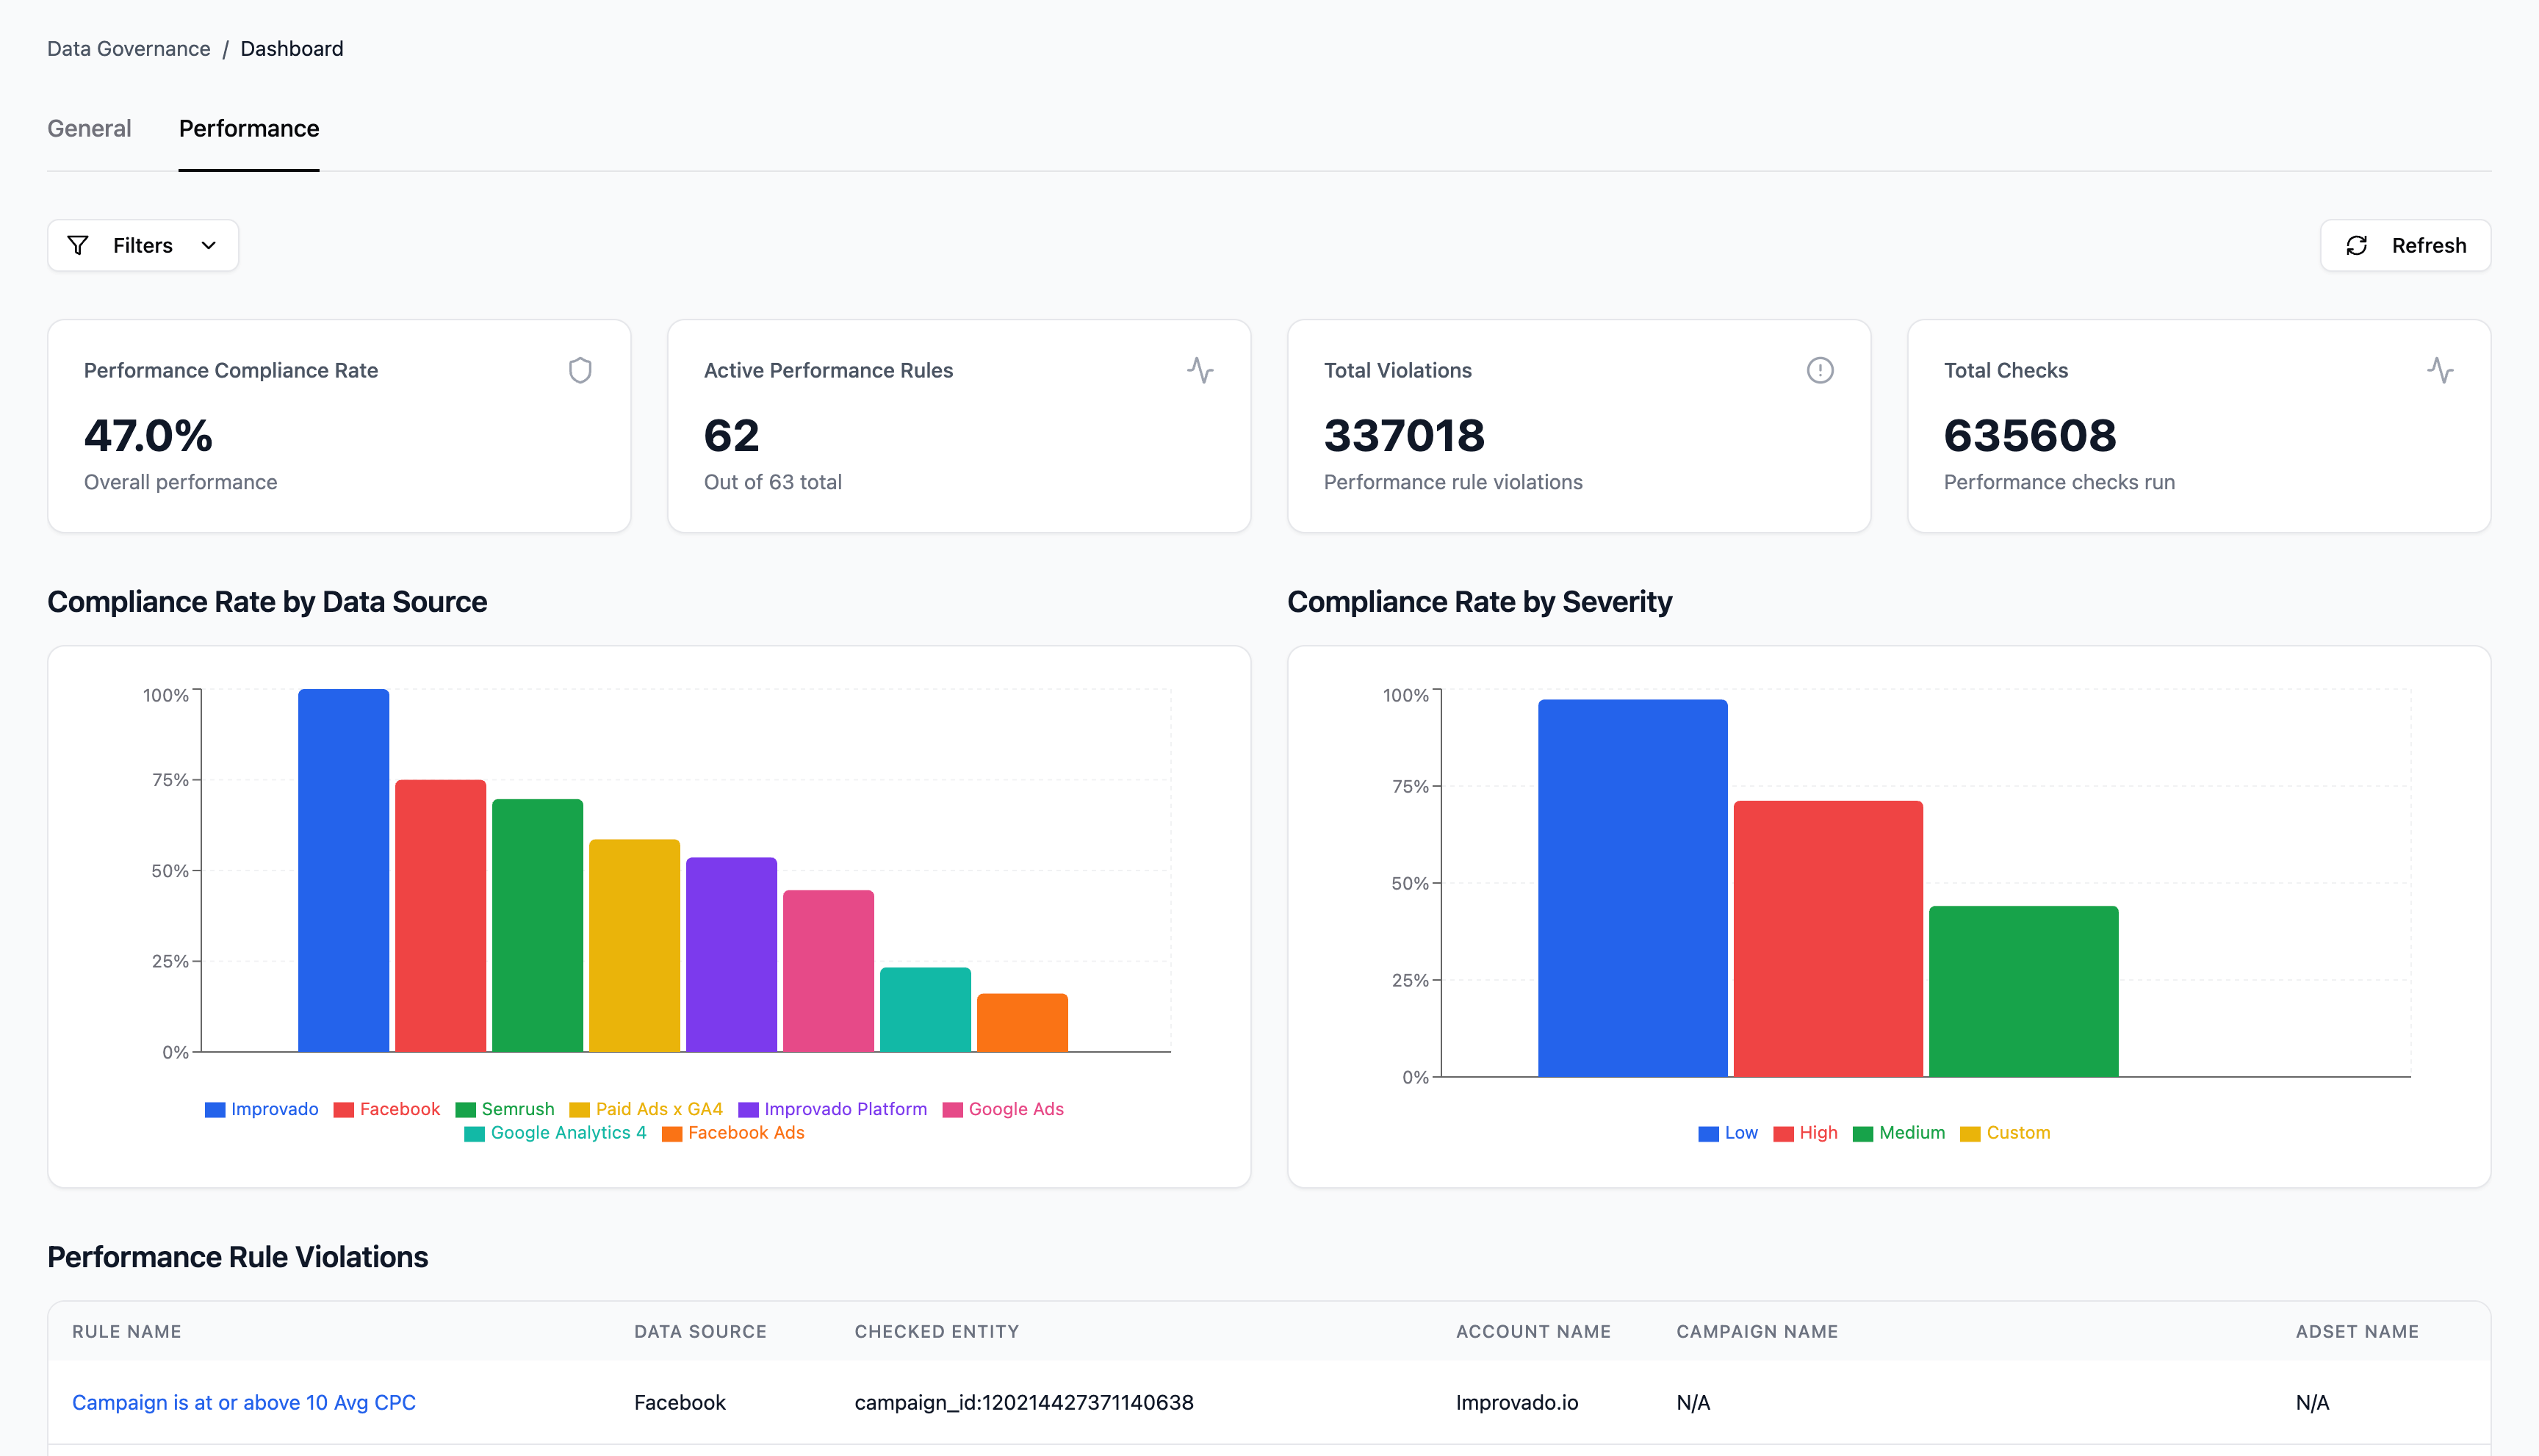
The Performance Rule Violations table lists detailed records of broken rules — including rule names, affected data sources, campaign entities, and severity levels.
This provides transparency into which campaigns or ad sets caused compliance issues and why (e.g., CPC Spike Alert, CTR Drop Alert, Zero Conversions Alert).
This view allows you to quickly pinpoint recurring performance problems, compare cross-platform consistency, and take action directly from the dashboard to maintain quality standards.
Conclusions
The Data Governance Dashboard gives teams a clear, actionable view of marketing data quality.
By combining compliance trends, rule performance, and detailed violation tracking, users can identify issues early, improve accuracy across all data sources, and maintain trust in reporting.
Was this article helpful?
Thanks for the feedback!