%20(1).png)
.png)
.png)
11 Must-Have Metrics to Include in Your Digital Marketing Report
Monthly marketing reports are crucial for any business's success. While it is typically a very tedious monthly task, reports serve as a source of actionable insights into performance and team alignment. It's vital information that you'll later use to optimize strategy to get higher ROI.
To cut time prepping the report and get straight to the insights, use this article as a hint on what to include in your marketing report each month.
For those who may not have time to read through the entire article, we've compiled a quick rundown of the must-have metrics for digital marketing reports in the table below. This concise summary will help you understand the key metrics and their significance in creating an effective marketing report.
What is a digital marketing report?
Why is it important? Well, these reports help marketers make better decisions in the future. They show what's working and what's not so that you can adjust your strategy accordingly. Plus, they show the value of your marketing efforts, which is always a good thing.
In a nutshell, digital marketing reporting helps you learn from your past campaigns, improve your future strategies, and demonstrate the impact of marketing efforts on the company’s bottom line. It's like having a secret weapon for marketing success!

What to include in a marketing report?
A good digital marketing report should include a few key elements to help you track progress, make data-driven decisions, and showcase your achievements. Here's what you should consider including:
Goals
Start by outlining the objectives of your marketing campaigns. This helps you and your team stay focused and aligned on what you're trying to achieve. For example, you might set goals like increasing website traffic, boosting social media engagement, or improving conversion rates.
Key Performance Indicators
These are the specific metrics you'll use to measure the success of your campaigns in relation to your goals. Examples include click-through rates, cost per acquisition, or email open rates. Identifying the right KPIs helps you track progress and see where you need to make adjustments.
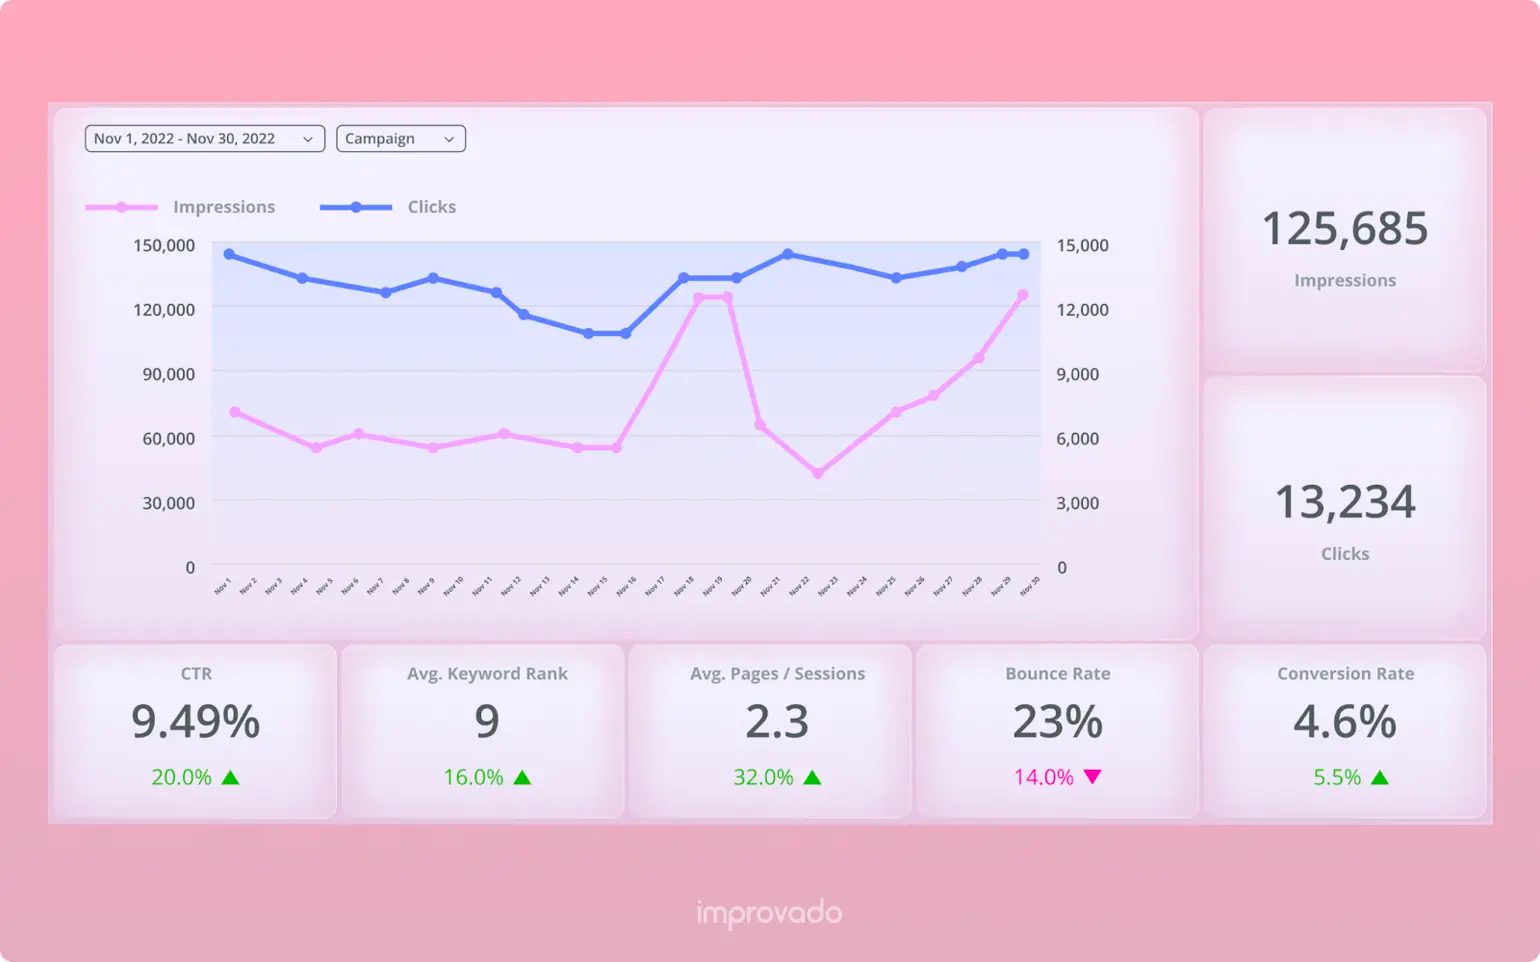
Well-structured Data
Present the data you've collected in a clear and concise manner using charts, graphs, or tables. This makes it easy for others to understand the impact of marketing efforts. For instance, you could use a line chart to show month-over-month growth in website traffic or a bar graph to compare engagement across different social media platforms.
The means of presenting your data depend on your business objectives and the type of data you’re tracking. You can find the most effective visualization tools and tips on using them in this article.
Insights and Recommendations
As well as the data itself, your report should include the insights you and trends you found inside your data. They demonstrate the marketing’s team ability strategic thinking and allow you to tweak your campaigns based on acquired insights. For example, if you notice that blog posts with videos get more engagement, you might recommend creating more video content in the future.
Progress Updates
Show how your marketing efforts have evolved over time and highlight any significant achievements or milestones. This helps demonstrate the value of your work and showcases continuous improvement. You could highlight a successful campaign that led to a significant increase in newsletter subscribers or a social media campaign that went viral.
By including these elements in your digital marketing report, you create a comprehensive overview of your marketing efforts, making it easier to assess progress, celebrate successes, and identify areas for improvement. The best digital marketing reports not only present data but also tell a story that inspires action and drives results.
Digital Marketing Reporting Complexities in Large Enterprises
While digital marketing reporting is essential, large organizations often face unique challenges in managing and consolidating their marketing data.
The sheer volume of data, the need to integrate data from multiple sources, and the complexities of custom reporting for various stakeholders can make the process daunting and resource-intensive. Let’s dive into the specific challenges large enterprises encounter and explore how an advanced marketing analytics platform can help tackle these issues effectively.
Need for scalability, or “I can’t navigate my marketing data with confidence”
As large enterprises expand their marketing efforts across various markets and regions, they often encounter scalability issues. These challenges can make marketers feel like they're drowning in data, struggling to maintain a consistent approach to analyzing their marketing metrics. Let's discuss some of the most common scalability challenges:
Faced with these scalability challenges, marketers need a solution that allows them to efficiently manage their marketing data and derive meaningful insights from it. There are two main approaches to addressing these issues:
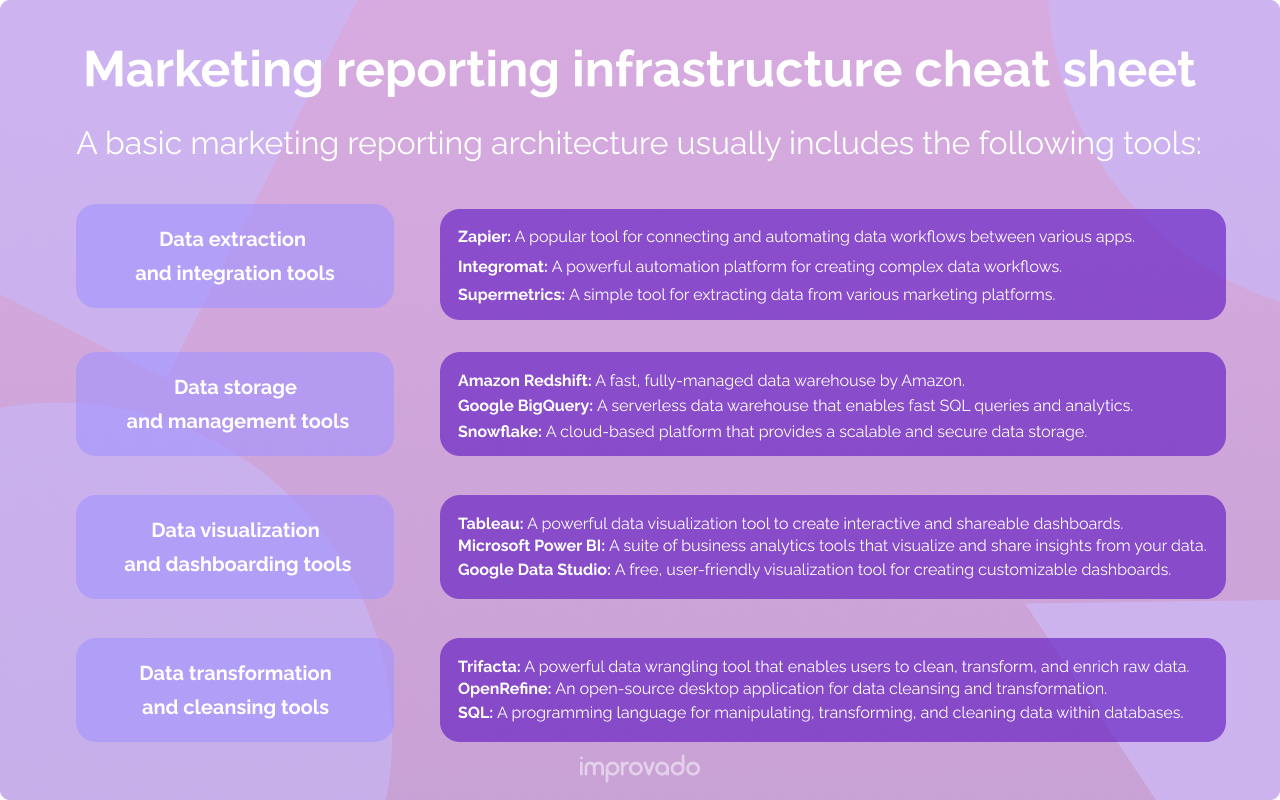
Solution 1: DIY Marketing Reporting Infrastructure
Creating a custom marketing reporting infrastructure involves duct-tape programming, as marketers often lack the expertise of data scientists or programmers. This approach requires using a variety of data tools (e.g., extraction, data governance, and normalization tools) and APIs to accelerate the delivery of data to the team's storage and dashboards.
Solution 2: Marketing Analytics Platform
If you’re looking for resource-effective option that provides an all-round support while granting a similar level of customizability, a marketing analytics platform would be the best option.
The current market is full of platforms for different analytics needs marketing teams of different sizes. Let’s take a look at Improvado, a marketing analytics platform for enterprise-level companies.
Improvado is designed to fit the most sophisticated needs of large marketing teams. The platform works best for companies with ad budgets over $500k per year running campaigns across multiple markets, channels, and platforms.
With Improvado’s help, teams can get a comprehensive picture of marketing performance across 500+ marketing and sales platforms in just a few clicks. The platform connects to all data sources to extract marketing metrics and transform them into analysis-ready insights.
Then, Improvado streamlines your data into pre-built dashboard templates designed for different use cases. From e-commerce analytics to a marketing cockpit, showing you the total impact of your cross-channel efforts, Improvado got everything data-driven teams might need.
What used to take months to achieve is now readily available with Improvado. Simply connect your desired data sources, choose the templates you need, and track changes in your marketing performance in real time.
Improvado’s clients also get 24/7 support and a dedicated customer success manager. Additionally, if your team doesn’t have the required talents or resources, you can benefit from Improvado’s Professional Services package. Improvado’s team of marketing analysts and data experts can create custom dashboards, create advanced queries for your marketing data, and fulfill any other request to get you closer to your business goals.
The cross-functional collaboration gap
In large organizations, cross-functional collaboration is essential for marketing success. However, marketers often face challenges that hinder effective communication and alignment with other departments. There are three main roadblocks to cross-functional collaboration. Let’s take a look at them and see how a robust digital marketing reporting system can help overcome them.
A marketing analytics platform bridges the communication gap between departments by centralizing data and providing real-time insights accessible to all relevant teams. This fosters a shared understanding of marketing performance and goals. With customizable dashboards and easy-to-understand visuals, teams can collaborate more effectively, aligning their strategies and ensuring a consistent approach to achieving business objectives.

Bridge the gap between marketing, sales, and finance data with Improvado.
Learn how to measure the impact of marketing efforts on sales growth and uncover the true value of each marketing touchpoint with this guide.
DOWNLOADThe real-time data struggle in complex enterprise settings
Having access to real-time insights is crucial for optimization of your campaigns and smart budget management. However, large organizations often face significant challenges in obtaining up-to-date marketing data and maintaining visibility into their marketing efforts.
Besides, teams that update data manually spend numerous hours collecting data instead of analyzing it and implementing changes based on the derived insights. By the time they finish the report, the data gets outdated again.
So, what’s the solution?
A proper marketing analytics platform that complies with today’s data regulations can help you automate your marketing reporting in a secure and efficient manner. For example, Improvado complies with all of today’s critical data regulations (HIPAA, GDPR, CCPA) while collecting and visualizing your data with zero code and minimum time expenses.
Top 11 Metrics and Elements for your Digital Marketing Report
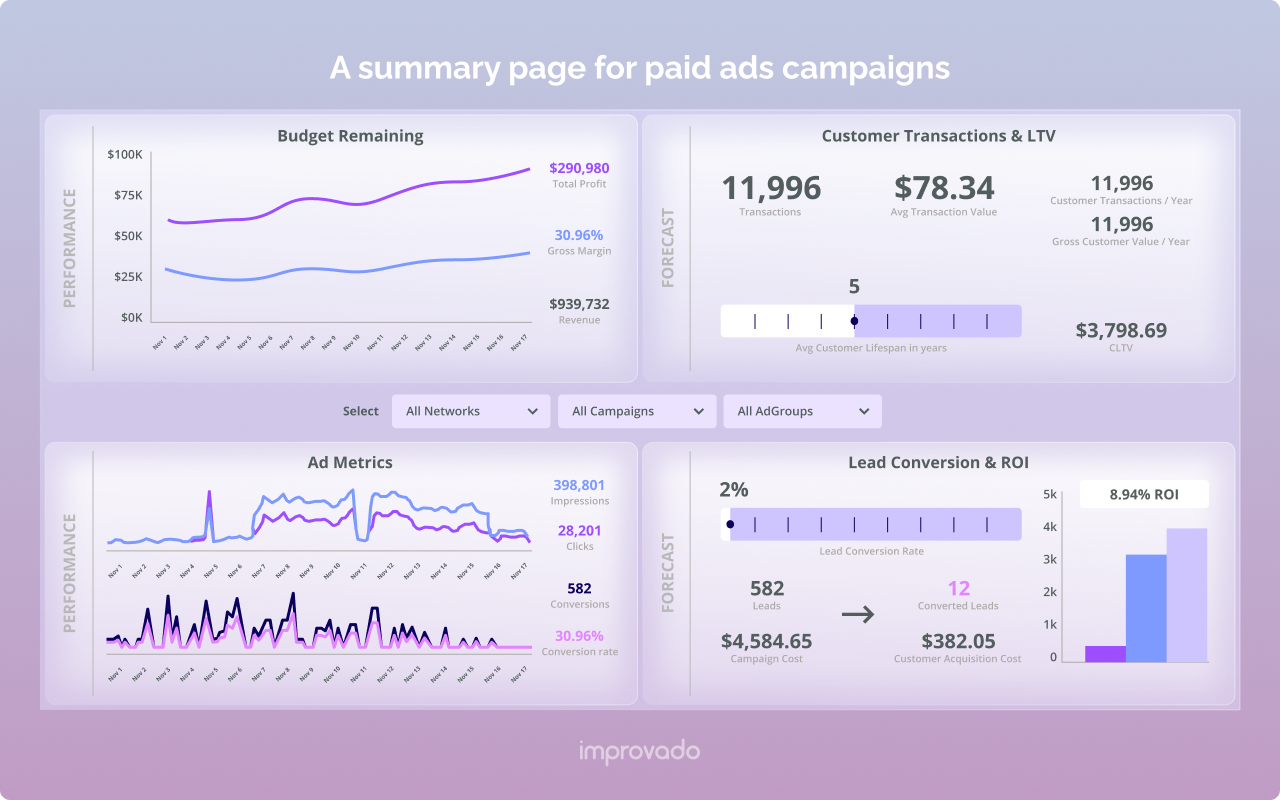
1. Summary Page
A summary page should be the first part of your monthly marketing report and should include a project overview and highlight the metrics that are the most important. The summary should be easy to read and concise. Use data visualisation tools to make it easier. This part of the report should give the client a general understanding of where marketing efforts stand for the month. Everything after the summary page should be more detail information of what has been highlighted in this section.
2. Current Marketing Strategy
Those reading your monthly marketing report may not be as well versed in your marketing strategy as you. This is where a section that explains your current marketing strategy can be incredibly helpful. This section of the report should answer a few questions, such as:
- Who is the target audience?
- What are the primary channels for marketing?
- What opportunities for growth are you currently pursuing?
- What is the current scope of the project?
You should make sure that the project scope is clear and reinforce confidence with this section that your marketing strategy is well-thought-out. If part of your marketing offerings is SEO, this area of the report is where you would provide a brief overview of SEO efforts. The marketing strategy section is also where you can discuss target audience, as well as on how customers are being reached.
3. What You Have Done
This section is where you can provide some historical context while showcasing how brilliant your team has been during the month. Show comparisons of this month’s work against the last month, the past six months, or year.
Provide a short overview of what you have accomplished during the month in relation with your client’s overall marketing strategy. For example, did you launch a new campaign, work on website development, design new collateral? You can list tasks accomplished during the month.
Example:
Tasks completed this month:
- Reviewed strategy and analytics
- Complete site audit
- Launched 7-day Facebook campaign around blog
- Published four blog posts
- Published daily content on social media channels
- Gained 10 new backlinks.
More detailed information can be included later in the various metric sections. Any changes in the audience or market should also be discussed in this section, along with any relevant information about the competition. This section is important because it lays the groundwork for how well clients understand the rest of your marketing report.
4. SEO Overview
The SEO Overview section includes any information about the SEO services you provide to clients, such as keyword research, link building, or site optimization. In this section, you can explain how your client’s rankings have increased and elaborate on what has been done to achieve the results. The SEO section should include tables that display information like new backlinks or a site audit that shows the progress on the website.
Part of the SEO section should be dedicated to search rankings for various keywords. To keep things simple, consider choosing a short list of keywords that your clients ranks well for and any relevant keywords they should try to improve their ranking for.
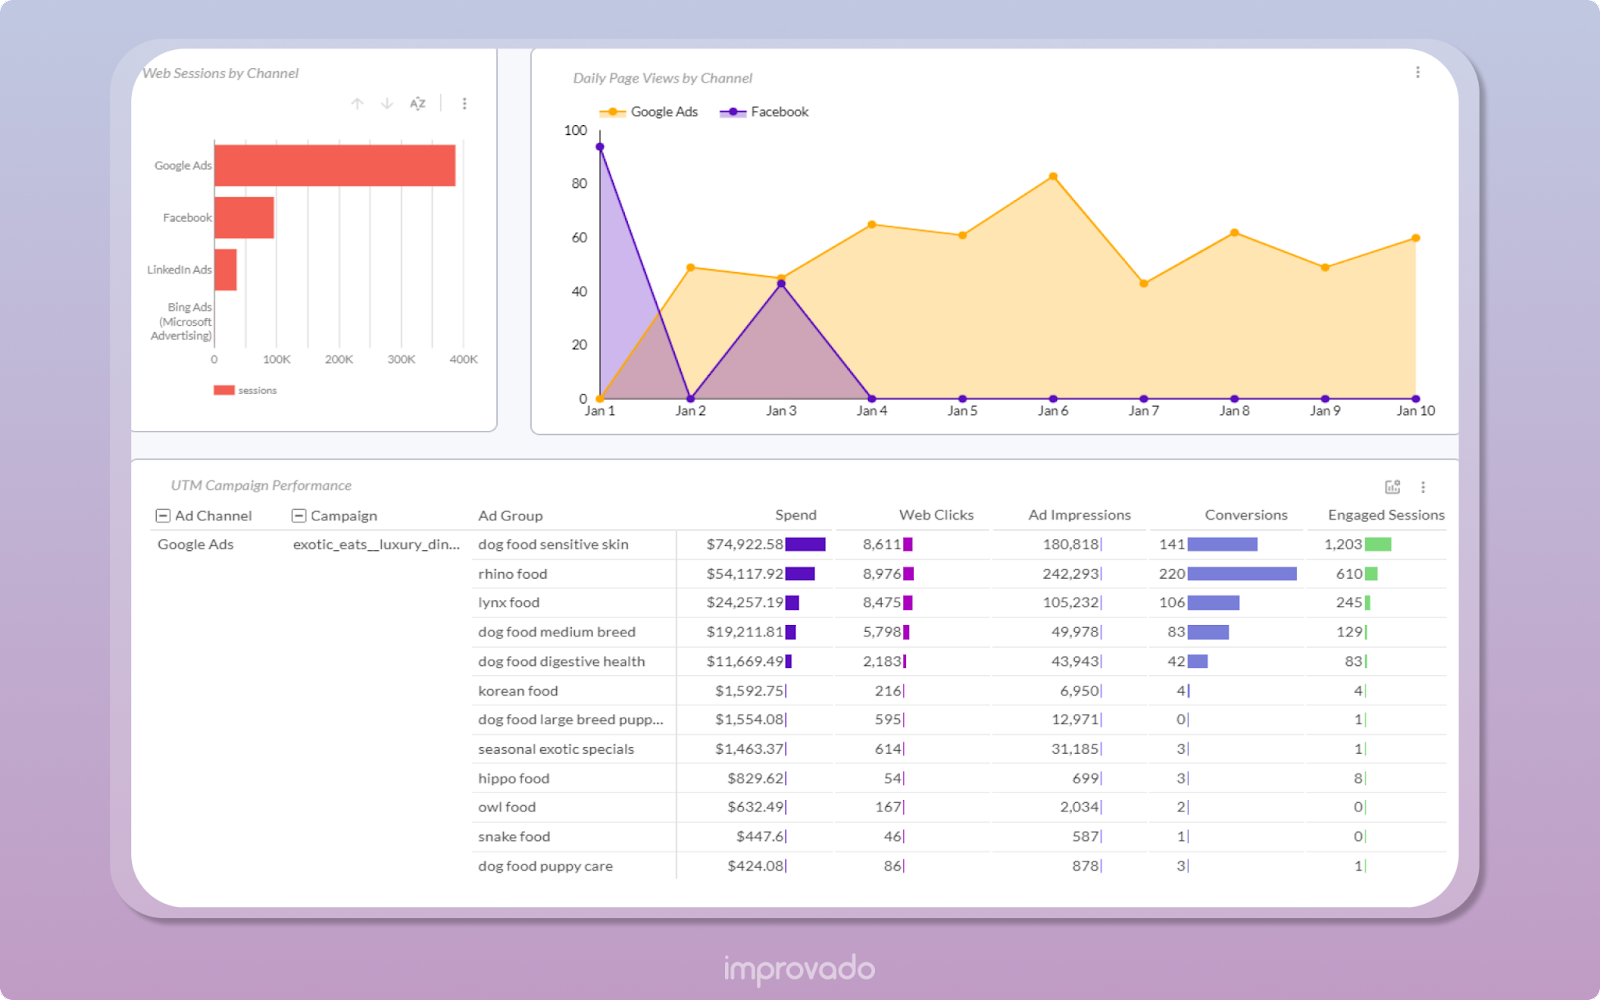
5. Traffic Metrics
It’s crucial to understand where web traffic is coming from, as well as how it performs, in order to not waste any money or time on developing marketing efforts on unsuccessful channels. Are visitors coming from referrals, organic search, paid search, emails? Metrics to highlight in this section of the monthly marketing report include:
- Top Landing Pages
- Sessions
- % New Users
- Top Referrals
- Bounce Rate
- Pages/Session
- Email Campaign Performance.
These traffic metrics can be used as a foundation for other sections in the report where you can dive deeper into channels and make any relevant recommendations. Use these metrics to improve your marketing strategy for the next month.
6. Conversion Metrics
Your clients will likely be most interested in any metrics that impact their bottom-line. The conversion metrics section should be the core of your marketing report and feature several charts displaying the important data your clients care most about.
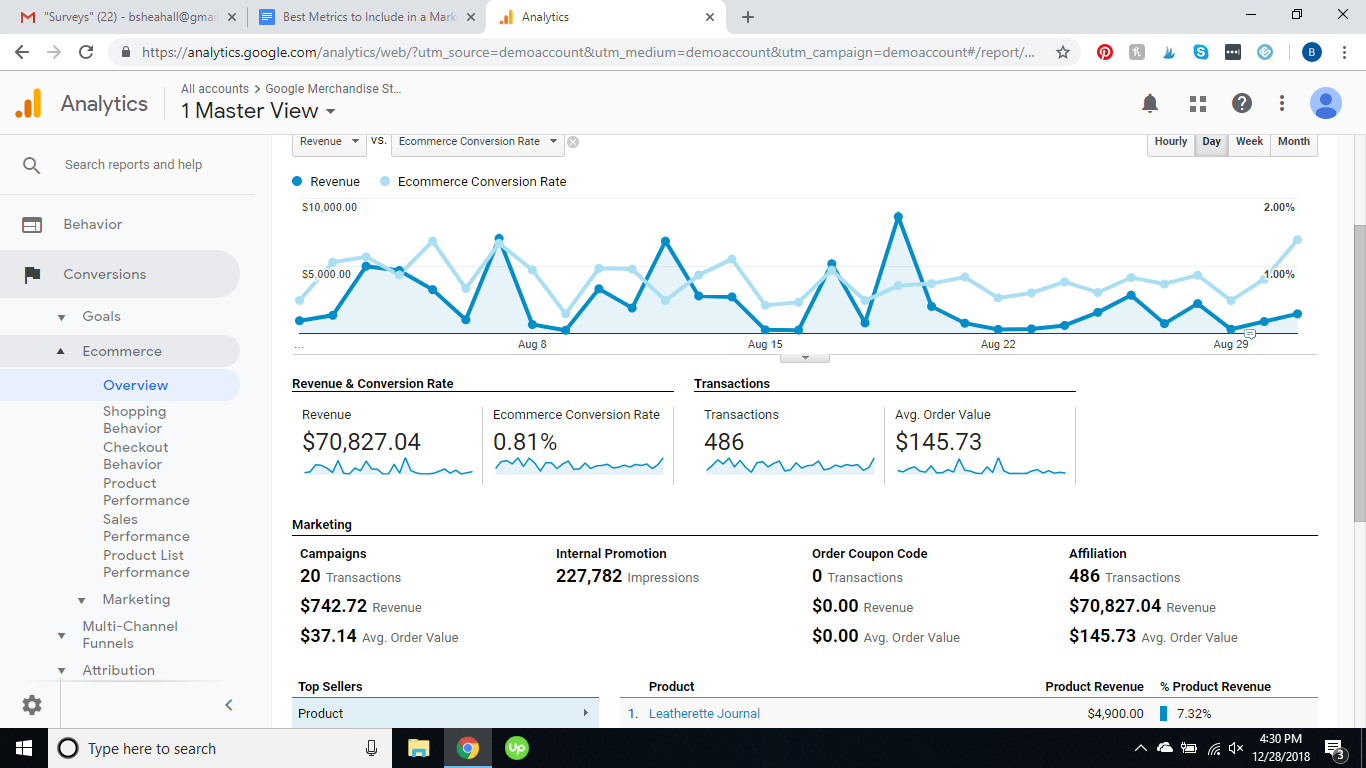
These statistics and graphs should backup your progress and goals. Keep in mind, however, that the report should still be easy for your client to understand, so try not to overwhelm with information. Make it easy to read. Include reports on various conversion metrics, such as:
- Organic vs. Paid Leads
- Cost per Conversion for Paid Channels (Facebook Ads, Google Ads, etc.)
- Leads by Channel (Paid Search, Organic Search, Referral, Email, Social, etc.)
Compare these metrics from one month to another to determine where there is success and which areas need improvement.
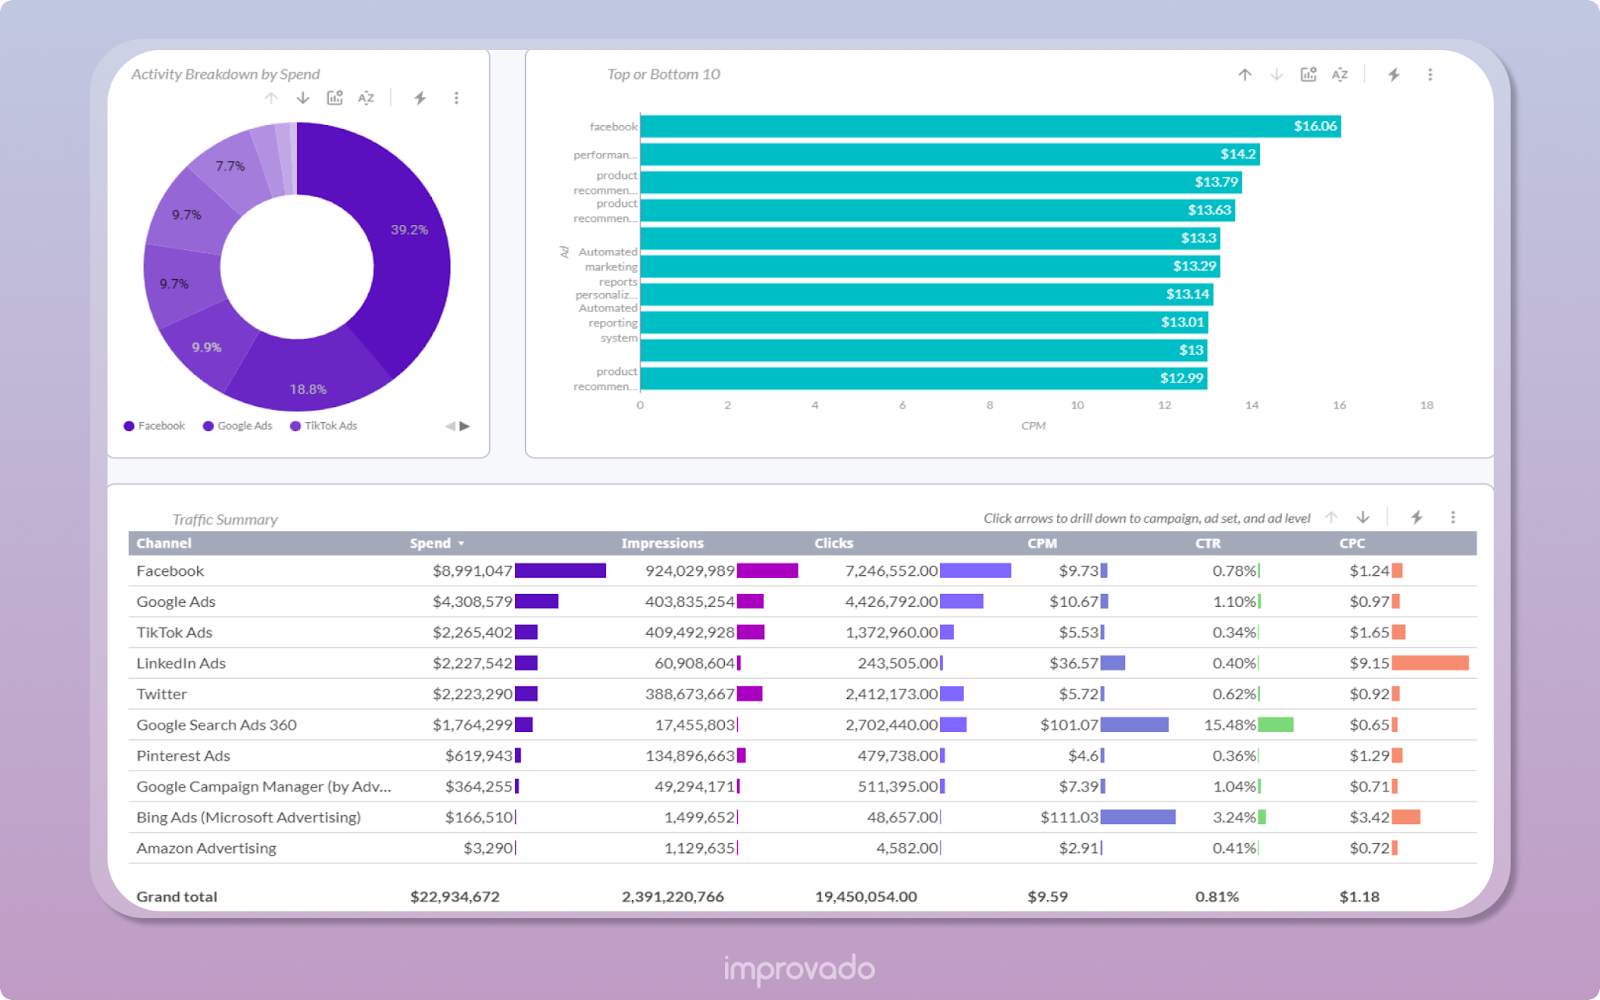
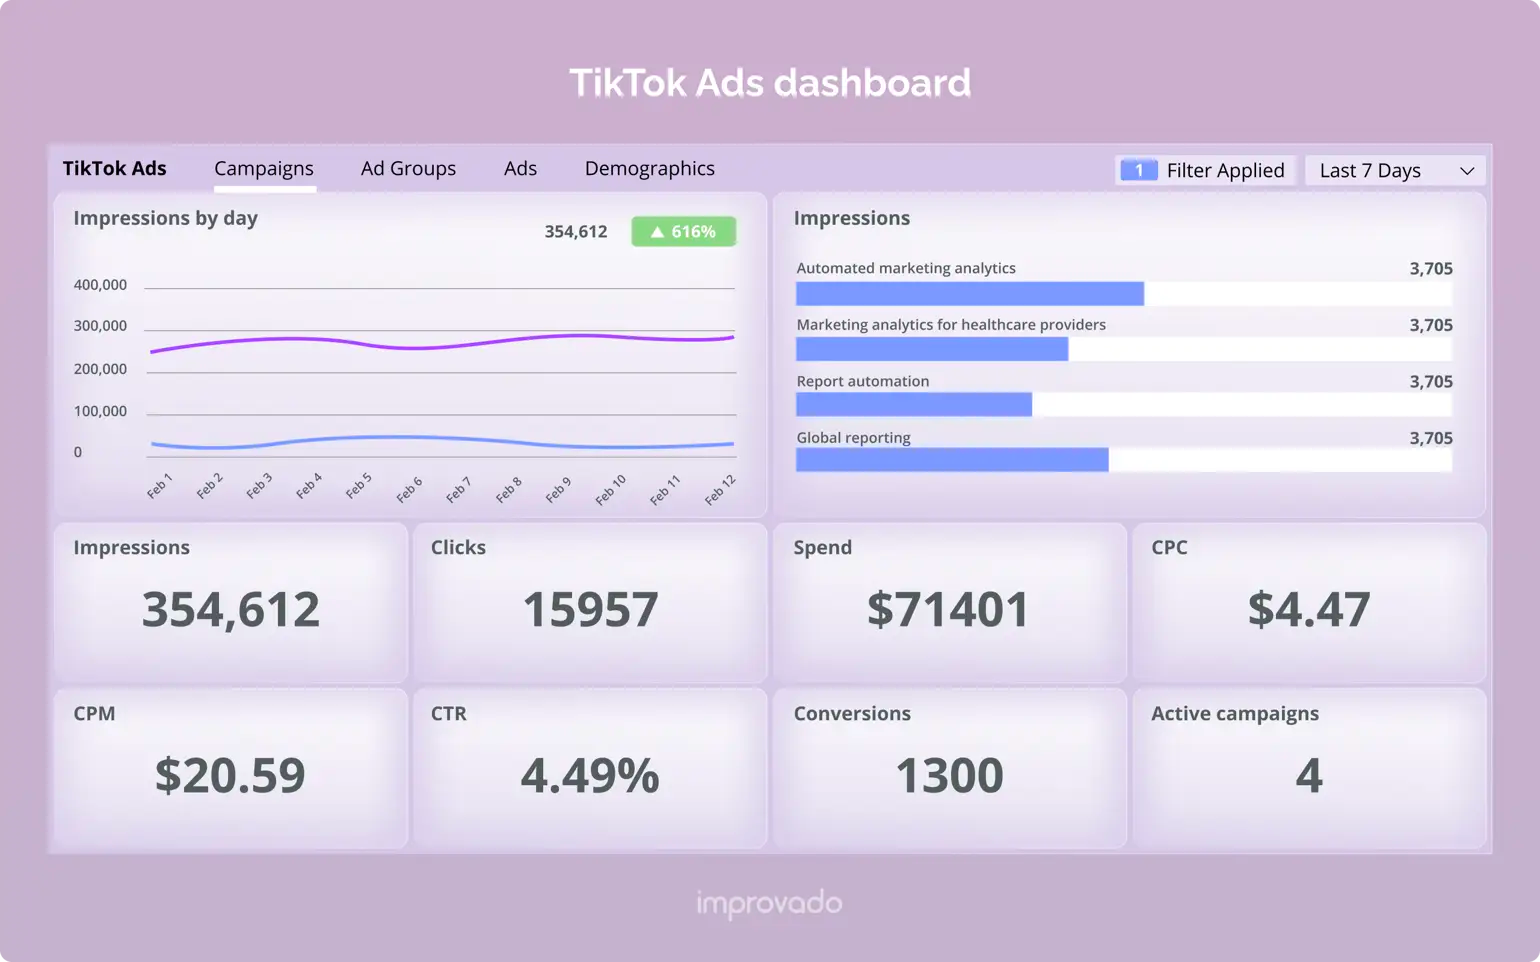
7. PPC Campaigns
You should also include a section for PPC campaigns in the marketing report each month if you manage campaigns for clients. This section should include metrics related to paid channels, such as:
- Ad Spend
- Impressions
- CTR (click-through rate)
- ROI (return on ad spend)
- Cost per Conversion.
Be sure to compare these metrics to each marketing channel. Recommendations can be made to clients based on these metrics, especially if your client has a limited budget.
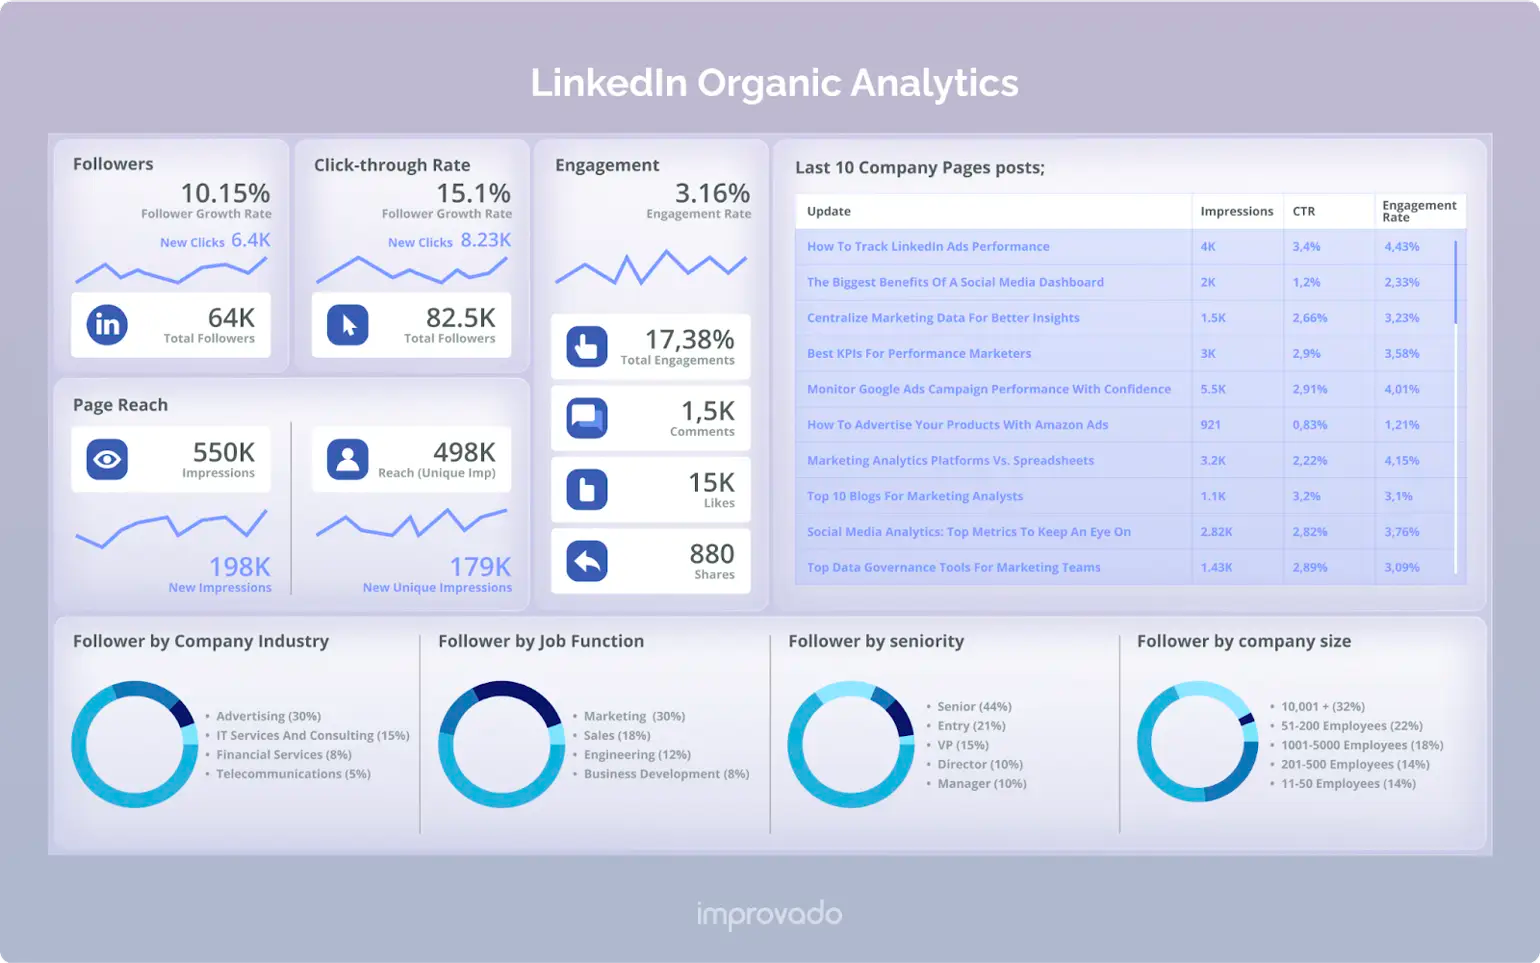
8. Social Overview
Social Media is an important component to any digital marketing strategy with its own KPIs that should be included in a monthly marketing report. Provide your clients with a performance overview for each of their social media channels, such as Instagram, Facebook, YouTube, Twitter, etc. Be sure to focus particularly on engagement metrics to show more of a deeper look at the success of each channel. Include a web traffic report showing traffic from social channels to highlight how social media can generate new leads.
9. Blog Traffic and Leads
If you manage the content marketing strategy or a blog for a client, there should also be a section in your report about blog traffics and leads. This information should be documented every month to ensure the blog has optimal performance. Take a look at how visitors are finding the content you publish on the blog and analyze which marketing channels are the most successful and which could use some improvement. This can help optimize your content strategy by highlighting what type of content draws visitors.
10. Goals and Ideas
Setting goals and achieving them is what keeps brands and businesses growing, so you will want to include a goals and ideas section in your monthly report. Revisit goals you set each month to check on progress. It’s a good idea to highlight plans for future marketing campaigns. This provides a way to involve clients and offer them a chance to follow your progress and ask questions.
11. Financial Projections
While this section of the report won’t ever be completely accurate, it should feature all information present in the marketing plan. Discuss any future expenses for promotions that you anticipate spending in the next month or so, along with the estimated ROI. The financial projections section should include the projected costs of achieving the goals you mentioned in the previous section of the marketing report.
Seamless marketing reporting on large volumes of data with Improvado
That was a lot of metrics to cover, right? Of course, digital marketing reporting isn't limited to the metrics we've discussed in this article; there's a lot more to track, and everything depends on your specific use case.
Marketing reporting can be a real hurdle. Especially in large organizations with a variety of internal stakeholders, complicated data infrastructures, and the rest of the intricacies. Large players should take analytics seriously due to the sheer number of campaigns being launched, significant marketing budgets, and other factors.
Frequently Asked Questions
Our recommendations:
Read more about Best Facebook Ads Report Templates
The Best Marketing Analytics Tools & Software for 2023

500+ data sources under one roof to drive business growth. 👇
Streamline ad reporting for efficiency with Improvado 👇


%20(1).png)
.png)


