%20(1).png)
.png)
.png)
The Best Facebook Ads Report Templates to Try
Facebook advertising remains a dominant force, estimating over 23 percent of the total digital advertising revenue generated in the United States. Are you leveraging the full potential of your Facebook ad campaigns?
This article delves into the ins and outs of Facebook ad reporting and reviews the best Facebook ad report templates that can streamline your campaign assessment process, drive insightful data interpretation, and ultimately optimize your return on investment.
Whether you are looking to simplify your reporting processes, identify new growth opportunities, or understand why a campaign fell short of projections, this article is set to be an invaluable guide.

ChatGPT in Marketing: Prompts to Build Dashboards in Minutes
Unlock ChatGPT's potential in building marketing dashboards with this comprehensive guide. 5 steps to build your next Facebook Ads Performance Report.
DOWNLOADFacebook Ads Performance Report
.png)
One of the most essential Facebook Ads report templates is a Facebook Ads performance dashboard that provides a high-level overview of your campaigns.
The Facebook Ads Performance Report tracks critical metrics such as impressions, reach, engagement rate, click-through rates, cost-per-click, conversion rate, cost per conversion, and return on ad spend. Each of these metrics holds the key to a different aspect of campaign performance, equipping companies with the data necessary to pinpoint both successes and potential areas for improvement.
Facebook Ads Performance Report Use Cases
Analyzing the dashboard involves assessing each of these metrics within the context of overall business objectives. For instance, a low click-through rate might prompt a reassessment of ad creative or target audience, while a high cost per conversion could lead to refining ad placement or bidding strategies.
The report also helps delve into granular details like a demographic breakdown of engagement, ad frequency, and even the positive and negative feedback received. This allows for fine-tuning of campaign parameters for better alignment with the audience's preferences and behavior.
The comparative feature of the report, which enables performance benchmarking against historical data, also aids in strategic decision-making. Recognizing trends over time assists in shaping an adaptive marketing strategy and responding to changing audience behavior and market dynamics.
Additionally, you can elaborate on the initial Facebook Ads reporting template and merge Facebook Ads data with data from other advertising channels, such as Google Ads, LinkedIn Ads, and more. This way, you get a comprehensive picture of your paid ads performance that enables you to optimize campaigns better and allocate marketing dollars more reasonably.

Facebook Ads ROI Dashboard
The dashboard tracks and displays pivotal metrics such as Return on Ad Spend (ROAS), Cost Per Action (CPA), and the total revenue generated by each ad campaign. By juxtaposing these metrics, it offers a clear picture of the profit generated versus the total ad spend, providing a straightforward measurement of the return on investment (ROI).
Further refining its functionality, the dashboard allows segmentation of ROI data by different parameters, such as individual ad sets, specific campaigns, or even particular ad creatives. This granularity allows marketers to pinpoint precisely which elements of their Facebook Ads strategy are driving the highest returns.
To assist with future planning, the dashboard can also present data across various timeframes. This allows for trend identification, comparative analysis of different periods, and forecasting of future ROI based on past performance.
The ability to determine the financial efficiency of different campaigns supports data-driven budget allocation, ensuring resources are directed towards the most lucrative strategies.
Facebook Ads Creatives Report Template
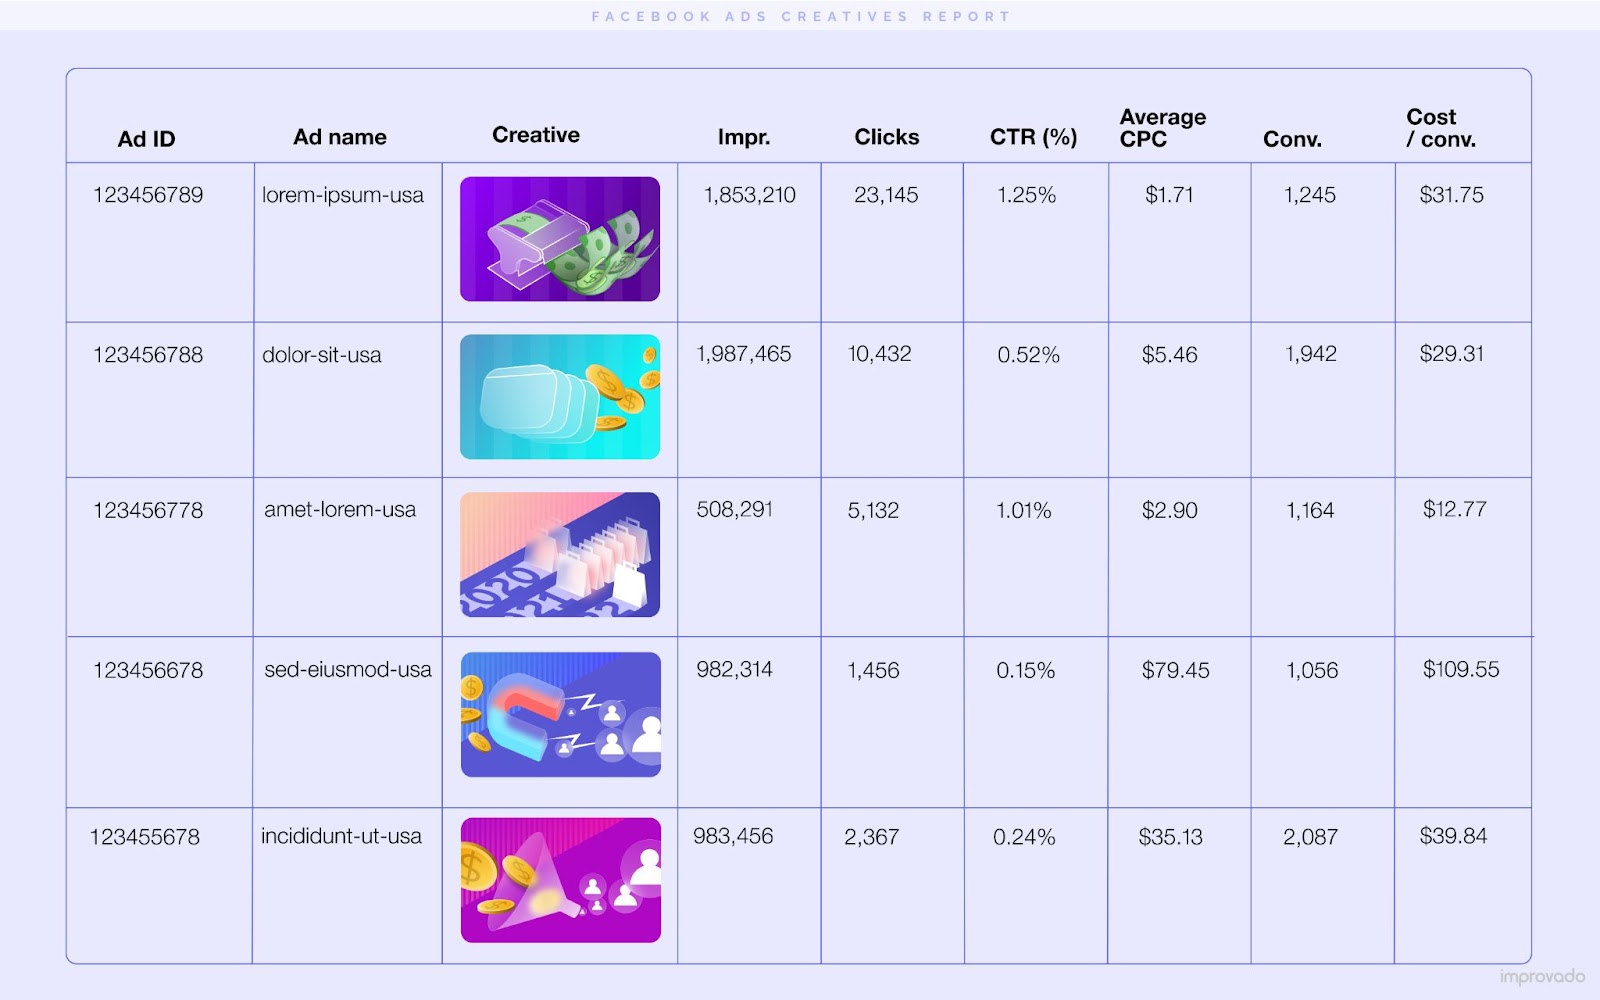
The Facebook Ads Creatives Report is a strategic tool designed to gauge the impact of the creative elements within your ad campaigns. A firm understanding of which creatives yield the highest performance is instrumental in driving engagement, conversions, and profitability.
The report provides an in-depth analysis of diverse ad components including visuals, headlines, and descriptions. It measures performance based on key metrics such as click-through rate (CTR), engagement rate, conversion rate, and more, helping businesses determine which creative elements resonate best with their audience.
By dissecting data by ad types, campaign objectives, or target demographics, this Facebook Ads reporting template offers a nuanced understanding of the specific creative strategies that deliver optimal results within different contexts.
Another powerful feature is the ability to track the performance of creatives over different time periods. This temporal analysis helps identify trends, compare performance during specific marketing periods, and predict future ad performance
UTM Quality Tracker for Facebook Ads
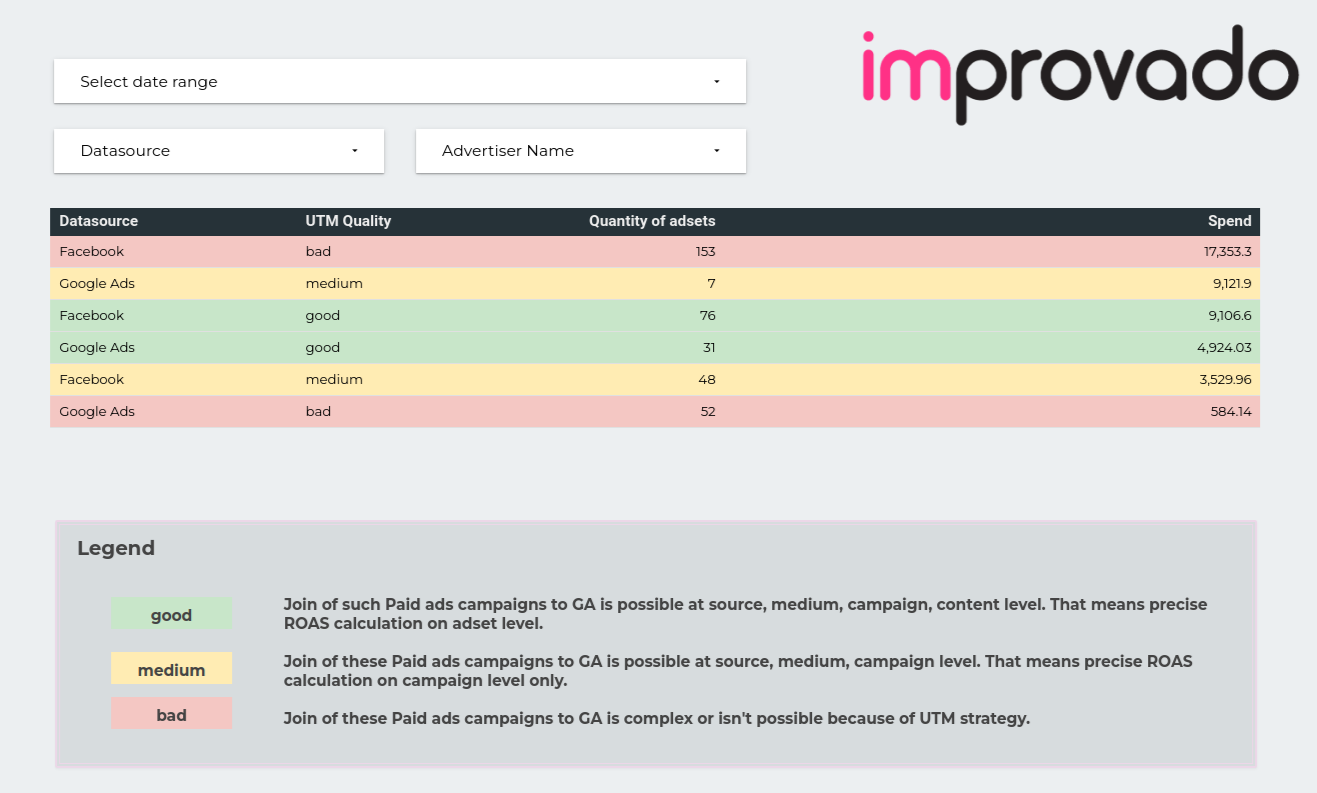
Tracking the performance of Facebook ad campaigns in isolation is not enough. UTM parameters, when appended to the URLs of ads, facilitate granular tracking of source, medium, and campaign name, among other variables. These insights allow businesses to trace back each website visit, conversion, or other key actions to its originating ad.
UTM quality is a common problem for marketers running paid ads across different channels. With different accounts, campaigns, or even marketing agencies that run your ads, it’s almost impossible to maintain a consistent UTM naming convention across all paid activities.
UTM Quality Tracker for Facebook Ads empowers businesses to maintain a high degree of accuracy and consistency in their attribution data, which is fundamental for optimizing marketing efforts and maximizing Facebook Ads ROI.
Improvado’s UTM Quality Tracker helps to monitor and validate the UTM parameters used in Facebook ad campaigns, ensuring they adhere to a predefined naming convention and structure. The dashboard shows the share of the ad spend that goes unattributed to any conversions due to UTM tags missing in the campaign.
For instance, an incorrectly set UTM parameter might misattribute traffic or conversions, leading to skewed performance data. With UTM Quality Tracker, such errors can be identified and rectified promptly, preserving the integrity of campaign data. The tool further allows for consistency checks across all campaigns, reducing the risk of misinterpretations and promoting clearer insights.
Facebook Ads Conversion Funnel Dashboard
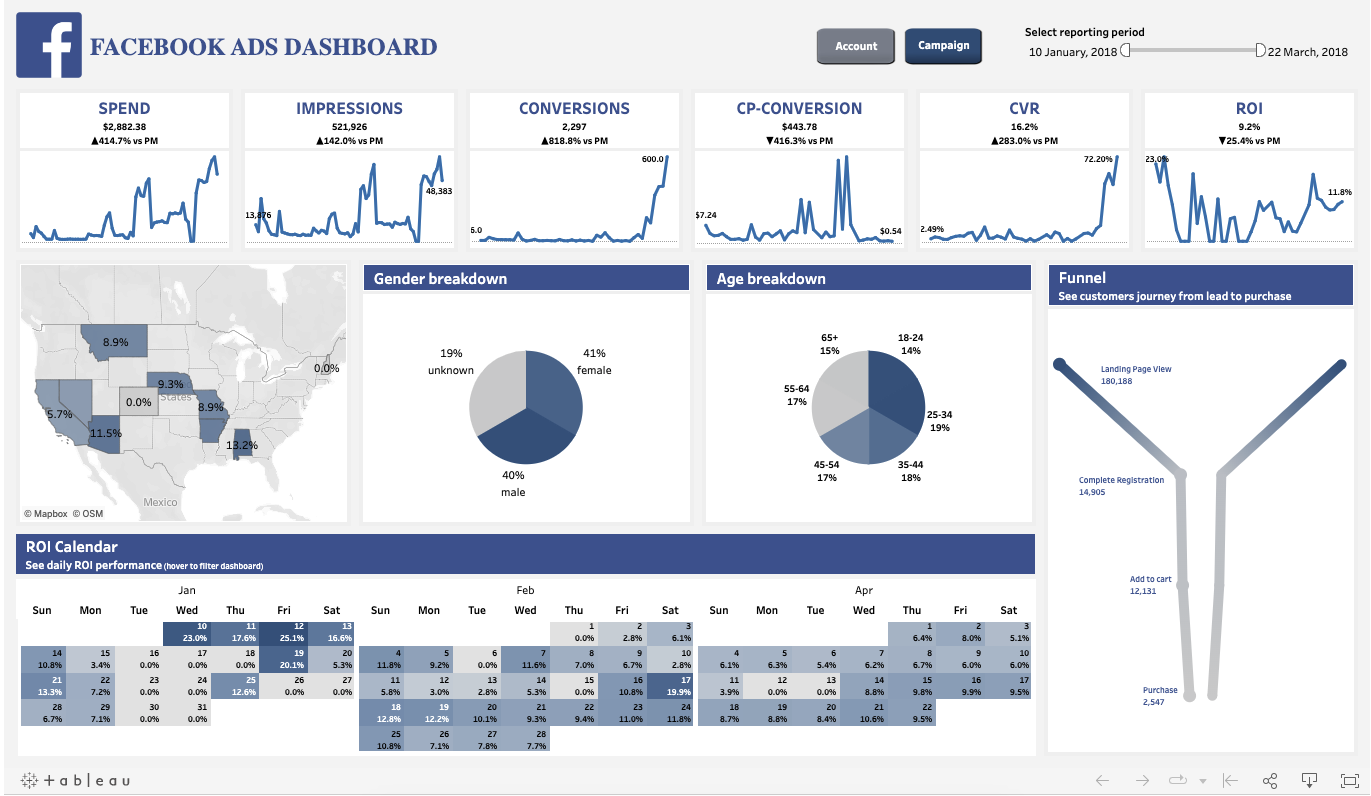
The Facebook Ads conversion funnel dashboard enables marketers to gain a nuanced understanding of their conversion journey.
The Conversion Funnel Dashboard captures a variety of crucial performance metrics at each stage of the customer journey — from awareness and interest to desire and action. Metrics such as click-through rates (CTR), conversion rates, and average cost per action (CPA) offer an in-depth view of the performance and effectiveness of Facebook advertising initiatives.
Facebook Ads Conversion Funnel Dashboard Use Cases
By highlighting bottlenecks at each stage of the funnel, the dashboard enables marketers to make strategic adjustments to their Facebook Ads campaigns.
For example, a significant drop in engagement between the interest and desire stages might suggest the need for more compelling content or a more enticing call to action.
One of the primary advantages of the dashboard is its ability to pinpoint bottlenecks or points in the funnel where potential customers drop off. By identifying these sticking points, marketers can devise targeted strategies to reduce drop-off rates, such as reworking ad copy, tweaking design elements, or reassessing audience targeting parameters.
Leveraging the granular data provided by the dashboard, marketing teams can conduct detailed A/B tests to determine which variables yield the best outcomes at each stage of the funnel. This could involve testing different ad formats, creatives, targeting options, or even landing pages.
Facebook Ads Summary Dashboard
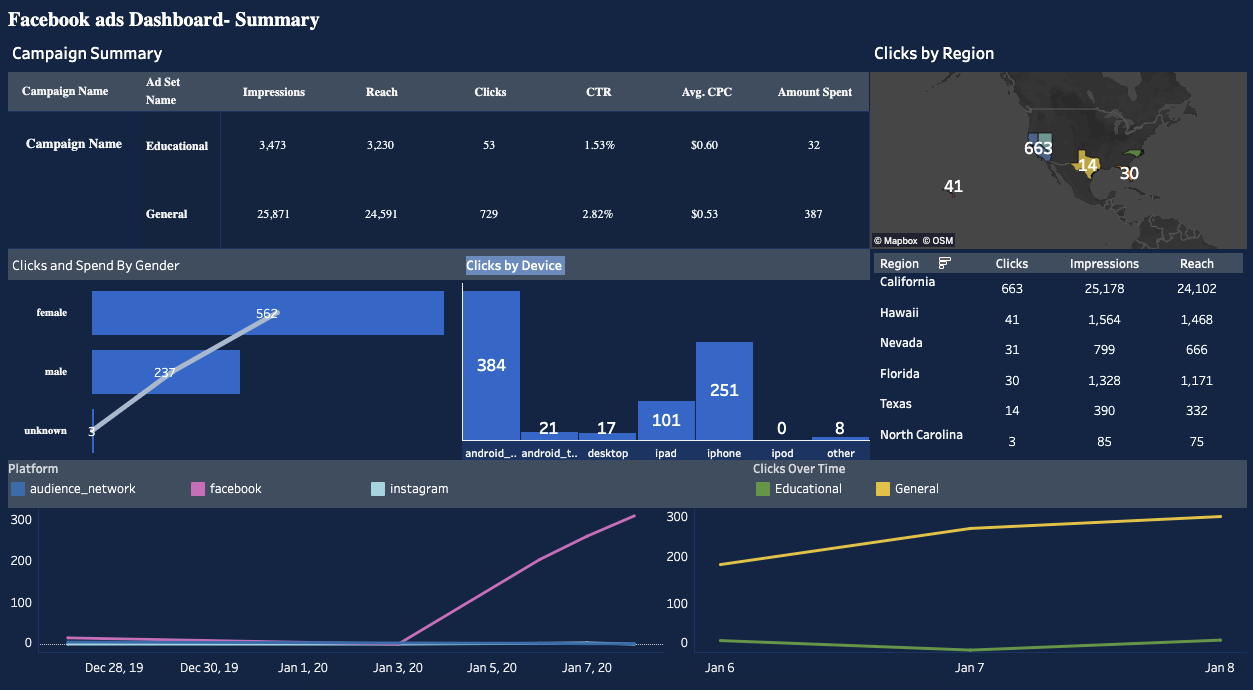
The Facebook Ads reporting template by 5I Ecom provides you with a campaign summary and includes all the essential metrics you need to understand the performance of each campaign. Some of the unique features of this dashboard are clicks by device and the chart showing clicks generated by each campaign over time.
Additionally, the report template shows Instagram Ads performance. So, you can analyze the performance on different advertising channels, understand your audience’s platform of choice, and advertise more effectively.
Facebook Ads Audience Insights Report
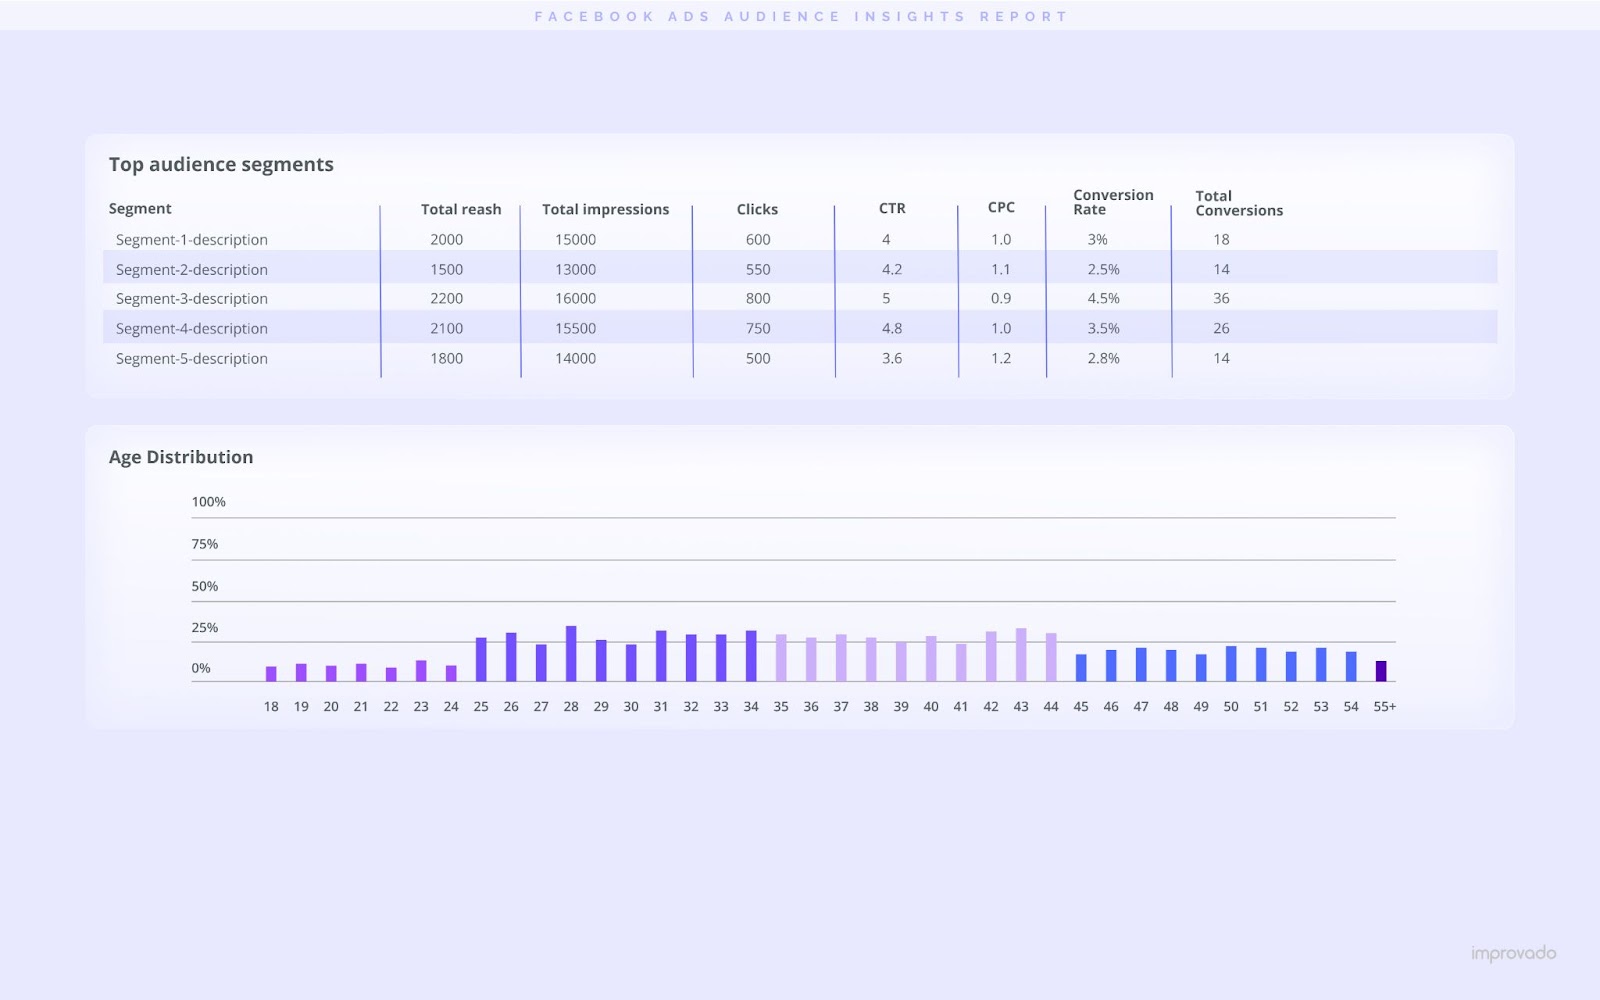
This comprehensive report unveils critical information about your audience's demographics, interests, behaviors, and more. Data such as age distribution, gender split, geographical location, and predominant interests, among others, can be extracted and scrutinized.
The Audience Insights Report enables segmentation based on specific campaigns, ad sets, or even individual ads, allowing for a comprehensive understanding of the distinct audience segments each marketing effort is reaching.
Leveraging this report, marketers are able to track changes in audience characteristics over different time frames. This empowers marketers to identify emerging trends, compare audience profiles across different periods, and anticipate shifts in audience behavior.
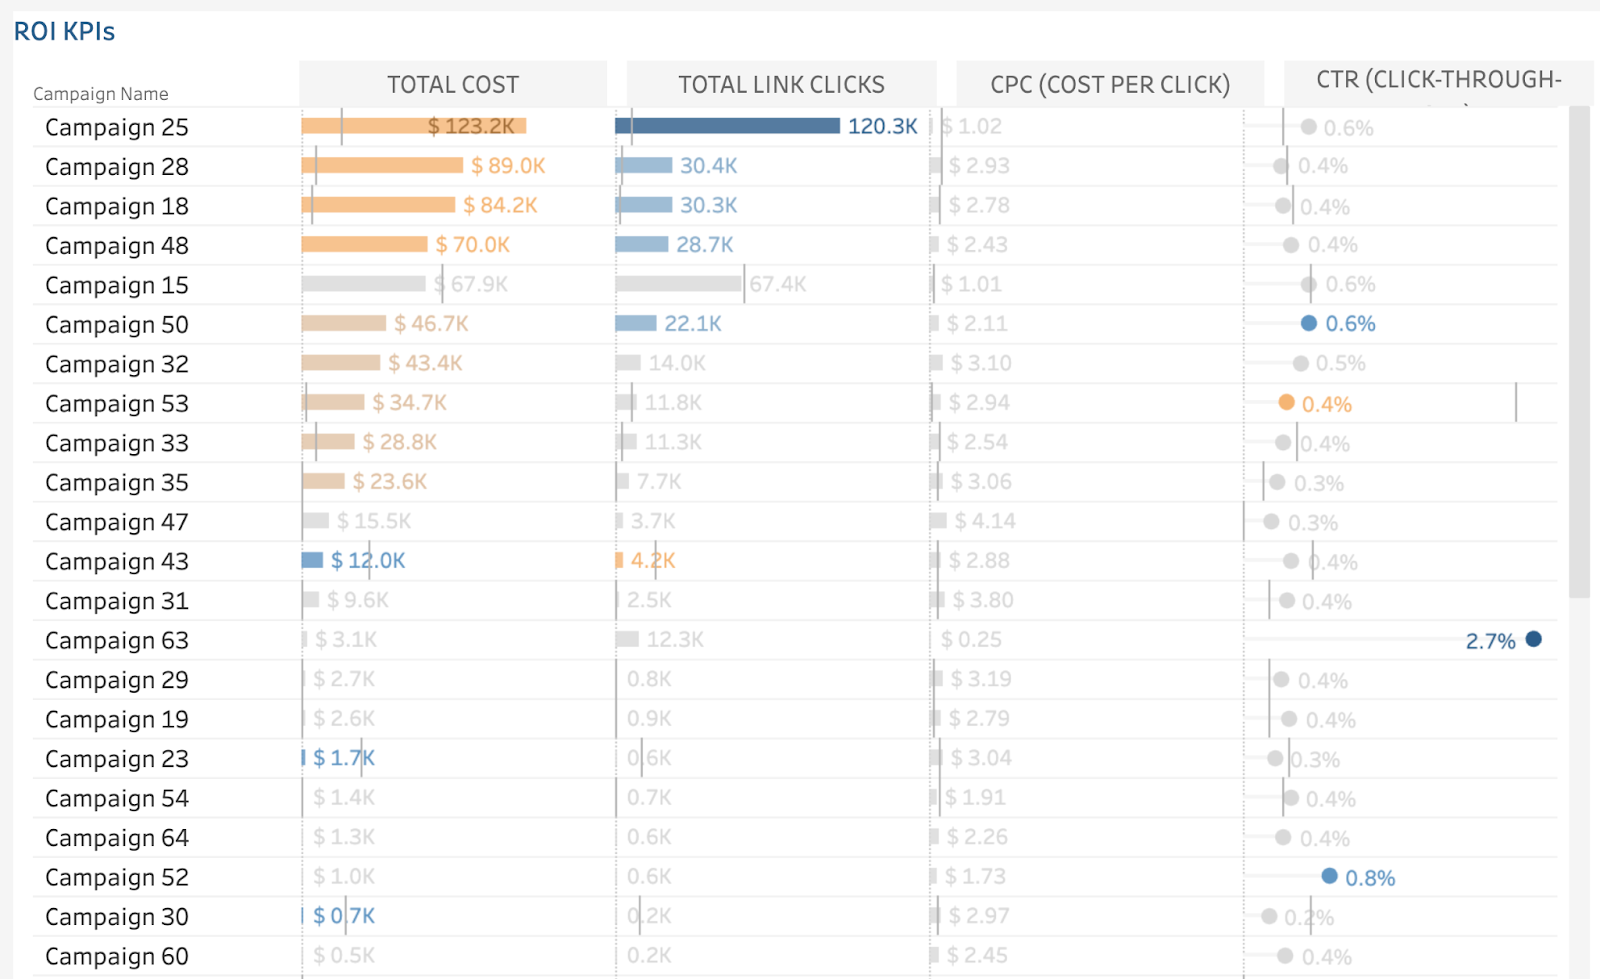
Facebook Ads KPI Dashboard

A Facebook Ads KPI dashboard provides a holistic perspective on the performance of various components of a Facebook ad campaign.
This Facebook Ads report template includes:
- Ad Performance Metrics: CTR for all ad placements, conversion rate for all ads, and engagement metrics as necessary.
- Campaign Performance Metrics: Number of impressions, reach, engagement rate, and so on.
- Conversion and sales metrics: Depending on your objectives, you may track conversions, conversion value, cost per conversion, etc.
- Real-time alerts: Alerts for significant drops in engagement and conversions, alerts for issues with ad performance.
Immediate access to granular, up-to-date insights equips marketing teams with the data needed to make informed and timely decisions, address issues impacting Facebook Ads campaign performance, and optimize overall customer experience and engagement.
Benefits of a Facebook Ads KPI dashboard:
- Quick and easy access to all relevant KPIs in one place.
- Real-time monitoring of the marketing budget and overall ROI of Facebook Ads campaigns.
- Time saved on data collection and analysis processes automation.
- Understanding of the impact of Facebook ads on customer transactions and CLV.
Tableau Facebook Ads Performance Report Template
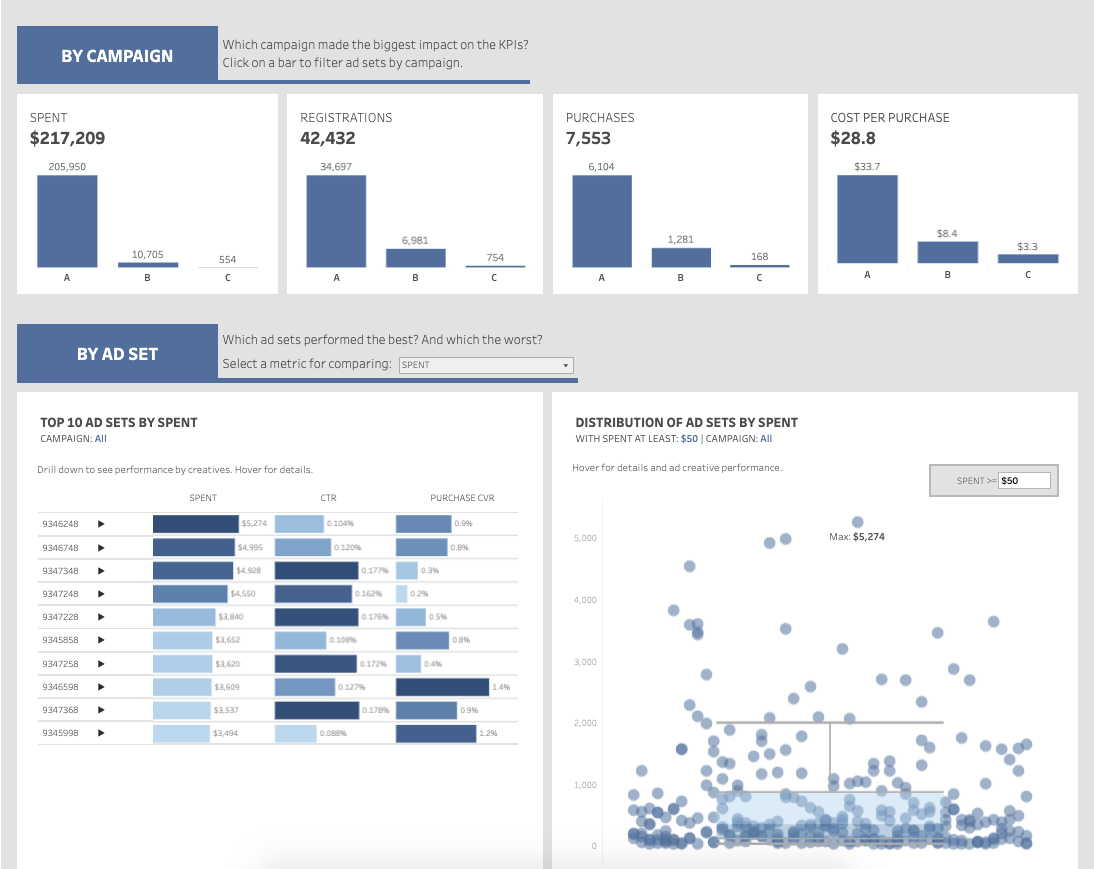
Here’s a free Tableau Facebook Ads performance report template prepared by Mariya Maziuk. It provides marketing teams with a detailed overview of all metrics and shows which of your campaigns had the most impact on marketing KPIs.
This Facebook Ads report template allows you to dig into different dimensions, ranging from campaigns to creatives. The breakdown by ad spend, registrations, and purchases across campaigns and ad sets help you understand which messages and creatives are working and which aren’t.
The Facebook Ads performance report shows which demographic groups are more likely to interact with your ads and purchase your product. The final curve chart is a summary showing you the interest group that makes the most purchases.
Tableau Digital Marketing Facebook Ads Report Template
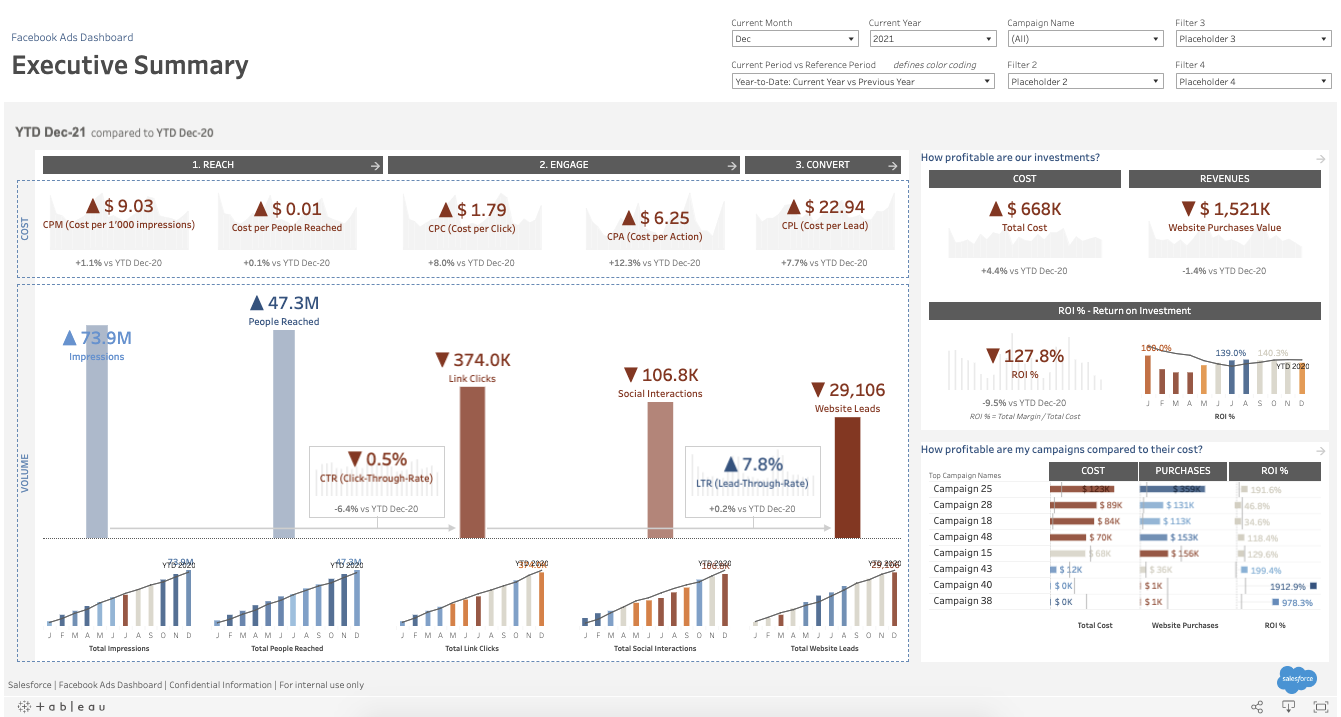
Tableau’s Facebook Ads digital marketing report template is a comprehensive dashboard displaying trends and the impact of campaigns on brand awareness, engagement, and conversions.
The 'Executive Summary' tab presents an aggregated view of all essential metrics sourced from your Facebook Ads campaigns. Metrics that can be closely monitored include impressions, reach, clicks, cost-per-click (CPC), cost-per-action (CPA), cost-per-lead (CPL), and generated revenue, among others.
The 'Awareness' tab further offers an in-depth perspective, detailing the number of impressions generated per campaign, the total audience reached, total cost, cost-per-thousand-impressions (CPM), and the cost per individual reached. This Facebook Ads report template provides options to tailor the analysis according to the campaigns of interest, historical data depth, and comparison periods.
Facebook Ads Leads Breakdown Dashboard Template

Facebook Ads Leads Breakdown Dashboard provides the necessary data to dissect leads, optimizing strategies to maximize lead conversion and ensure effective use of the advertising budget.
The dashboard offers a panoramic view of leads generated from Facebook Ad campaigns. Core metrics such as lead volume, cost per lead, lead conversion rate, and lead source can be closely monitored. Each metric provides a different dimension to the lead analysis, enabling companies to identify successful strategies and areas that need refinement.
Facebook Ads Leads Breakdown Use Cases
an unusually high cost per lead may signal the need to audit current targeting strategies. This might involve reassessing audience segments, refining geographical targeting, or redesigning ad creatives for enhanced appeal.
Similarly, analyzing the origins of the most high-paying leads can allow marketers to reallocate their budget more effectively, directing investment toward the platforms or audience segments that yield the highest return.
Digging deeper, the dashboard delivers granular insights into lead demographics, behaviors, and engagement patterns. This in-depth understanding of a potential customer base allows marketers to create more personalized, resonant marketing strategies that lead to higher engagement and increased conversions.
The Value of Custom Facebook Ads Dashboards Over Report Templates
Facebook Ads reporting templates offer a great starting point for analyzing marketing campaigns. They come pre-packaged with a set of commonly used metrics and KPIs, often based on standard industry practices, saving time and effort.
However, when it comes to deriving deeper, more nuanced insights that align with a company's specific goals and processes, custom reports prove to be more effective:
- Custom reports are tailored to a company's unique requirements and objectives.
- They can focus on specific metrics that are critical to the company's success and provide a more precise view of performance against set goals.
- The layout and visual presentation of custom reports can be designed to facilitate interpretation and decision-making within the unique context of a company. The information flow, hierarchy of metrics, and even color schemes can be adjusted to best fit the company's needs, making the data more accessible and understandable for the team.
Custom reports also offer the advantage of scalability. As the company grows, the metrics that matter may change, new data sources may emerge, and the level of complexity may increase. A custom report can adapt to these changes and remain a useful tool, while a template might become restrictive or irrelevant.
In addition, custom reports can be integrated with various data sources the company might be using. This means not just Facebook Ads data, but also data from other ad platforms, CRM systems, web analytics, and more. This results in a more comprehensive view of the marketing efforts, enabling holistic performance analysis and strategic planning.
To ensure your Facebook Ads reporting consistently drives insightful decision-making and helps maximize returns on investments, partner up with an advanced marketing analytics solution like Improvado.
Improvado is an automated reporting tool and marketing analytics platform. This end-to-end solution assists at every stage of the marketing reporting cycle, from data collection to report customization. The platform comes with over 500 data sources and integrates with Power BI, Redash, Tableau, and many other data visualization and business intelligence (BI) tools. Improvado streamlines the entire marketing analytics, not just Facebook Ads reporting.
Frequently Asked Questions
Our recommendation:
Check out The Best Marketing Analytics Tools & Software for 2022
Best agency management software for marketing agencies
The Best Marketing Dashboard Software of 2023 and How to Set it Up
Supermetrics VS Funnel.io VS Improvado - A Comprehensive Comparison
Global Digital Advertising Spend by Industry in 2023
Top Supermetrics's Alternatives & Competitors in 2023 [ New Research ]
12 Best Marketing Dashboard Examples and Templates [2023]
Learn about Best Dashboard Software

500+ data sources under one roof to drive business growth. 👇
Your vitally accurate reports to make data-driven decisions


%20(1).png)
.png)


