%20(1).png)
.png)
.png)
5 Best Domo Alternatives and Competitors: In-Depth Comparison
Domo, a recognized player in the business intelligence landscape, provides a platform designed for real-time data visualization and insights. While it has been a solution of choice for many, certain aspects of Domo might not resonate with every organization's unique requirements or preferences.
In this guide, we'll explore the top Domo competitors and alternatives, shedding light on their capabilities and how they compare, to help organizations make an informed decision in their quest for the right business analytics tool.
Domo Overview
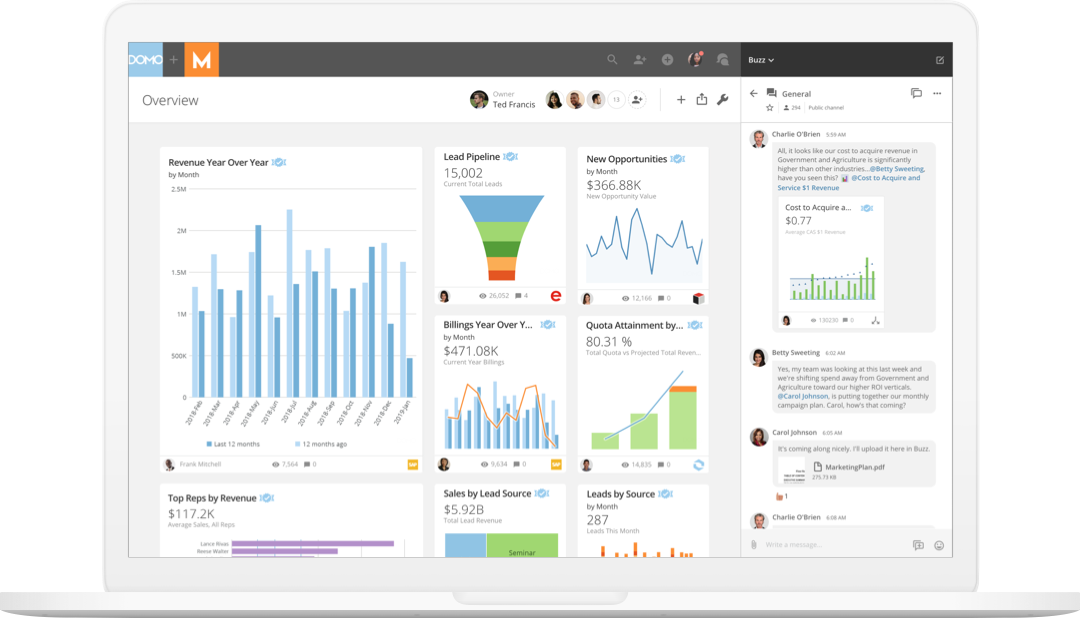
Domo is a cloud-based business intelligence (BI) platform that offers a range of tools and features to help businesses visualize, analyze, and act on their data.
Data Aggregation
To begin with, Domo offers a suite of data integration capabilities, including over 1,000 pre-built connectors, the Connector Dev Studio IDE to build custom connectors, data uploading features, and other options to ingest massive volumes of data. Aggregated data is then used as a foundation to create visualizations within Domo.
Data Transformation and Preparation
To harmonize and prepare data for analysis, Domo offers multiple data transformation options:
- Drag-and-drop Extract, Transform, Load (ETL) allows users to define and sequence operations visually and perform easy transformations like map values, split columns, filter rows, etc.
- SQL-based ETL allows analysts to perform complex transformations and combine datasets.
- The Data Science Suite provides tools in R or Python for advanced data integrations and processing.
- Additionally, Domo allows to develop and deploy machine learning models through integration with Amazon Sagemaker Autopilot or an integrated Jupyter environment using R and Python.
Data Visualization and Reporting
Domo offers a suite of visualization tools that allow users to create interactive and dynamic dashboards.
- The platform's Analyzer feature offers over 150 chart types and more than 7,000 custom maps, enabling users to refine and customize visualizations to fit specific business needs.
- The Domo Stories feature allows marketers to customize the layout and create branded dashboards.
- Beast Mode is used to create calculated fields through SQL or simple functions.
- The platform also allows users to apply filters, customize text, and create alerts.
Data Discovery
To handle and make sense of large datasets, Domo offers various tools to facilitate data discovery and interpretation.
- Domo provides a user-friendly interface for data querying. While it simplifies the process, there's a learning curve involved, especially for those unfamiliar with data platforms.
- Additionally, Domo provides augmented analytics, which utilizes AI to analyze data. The platform also supports natural language queries via text bots, where users can ask questions about their data.
- The platform also includes built-in chat for team communication and collaboration and features to create tasks and manage action points.
Additional Feature
The platform includes tools designed for app creation, allowing users to build and share custom applications. Domo also supports embedded analytics functionality.
Domo Pricing
Domo doesn't disclose any pricing details on the website, only stating that the price depends on the usage of the platform and parameters like data storage, data refresh rates, the volume of data queries, and the number of users.
Customer reviews suggest that the platform is pricy when compared to Domo competitors and other business intelligence platforms. Many features either come as an add-on or require moving to the Domo consumption model, which may be less cost-efficient for some companies. Additionally, one of the reviews notes that the company often changes its pricing model, which makes it hard to budget.
Domo Integrations
Domo's data integration capabilities present a mixed bag of features, each with its own strengths and limitations.
Domo provides 1,000+ pre-built connectors for various data sources, from databases to cloud tools. While these connectors can simplify the integration process for many standard data sources, their effectiveness can be inconsistent, especially with less common or proprietary systems.
The platform offers tools for custom data integrations, catering to businesses with unique data sources. The list includes Domo Workbench, Domo's APIs, Domo's SDK, and webhooks. Users can also use the Connector Dev Studio IDE to build custom connectors. Setting up these custom integrations often requires a deeper technical understanding and can be time-consuming.
Domo can also connect to your data warehouse or system via ODBC, data writeback connectors, and APIs. The platform supports email import and flat file ingestion.
Improvado (Best Domo Alternative)
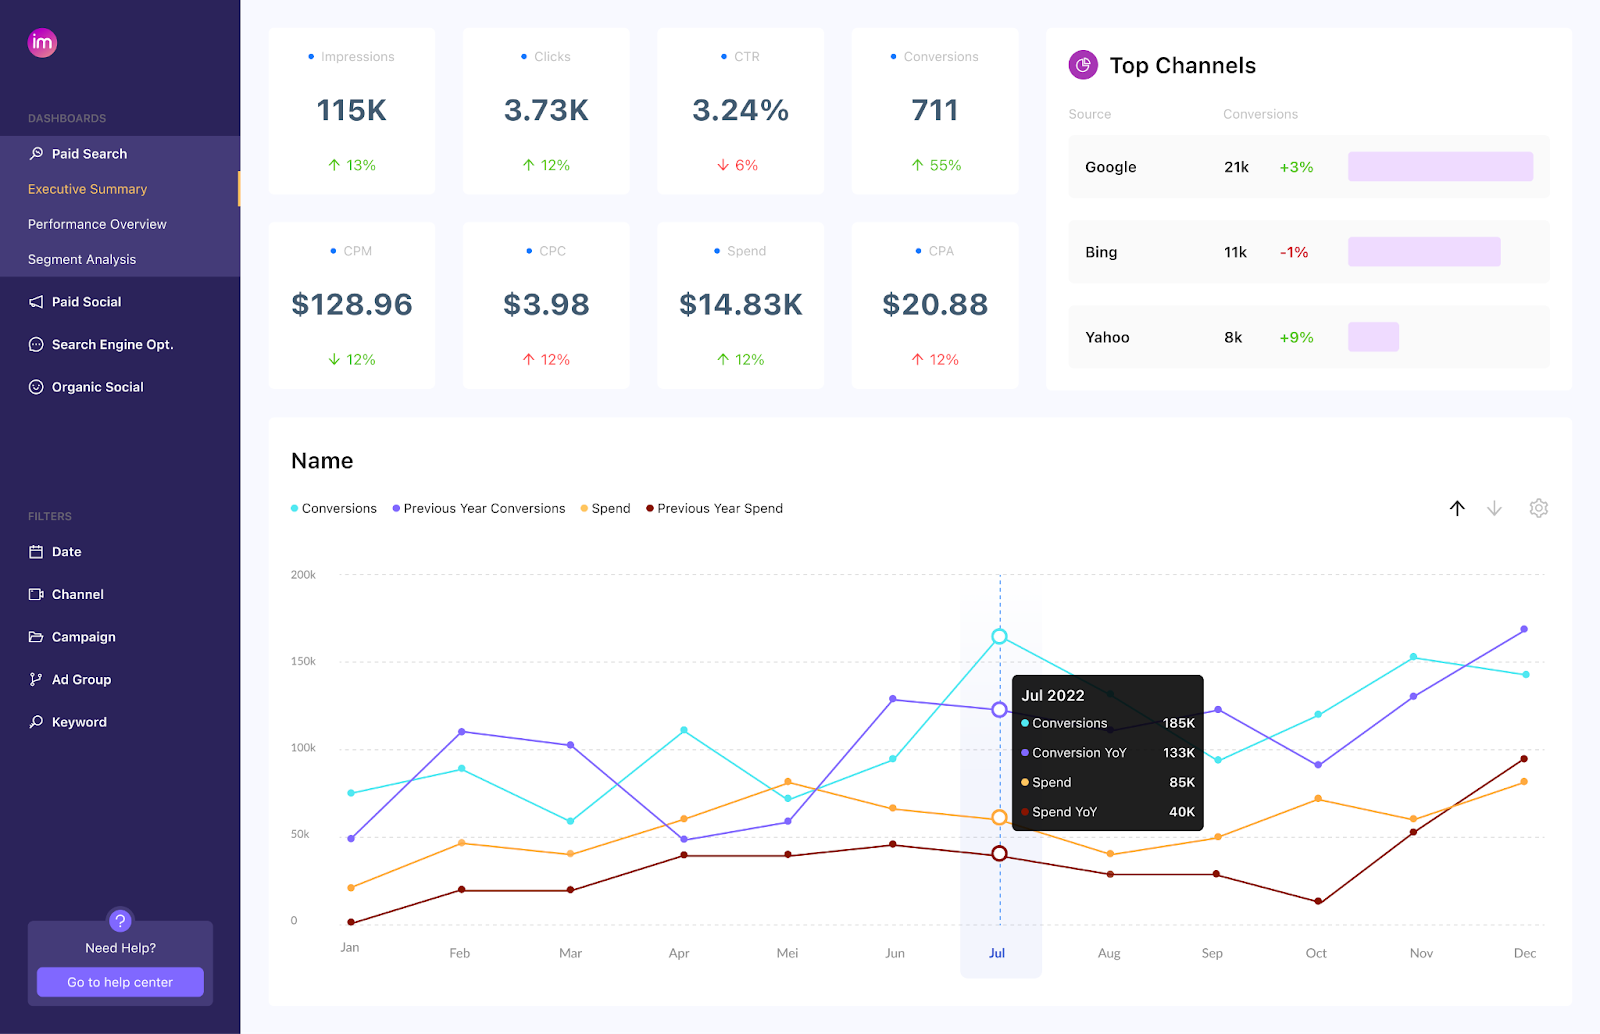
Improvado is an advanced marketing analytics solution that streamlines the entire reporting process, from data aggregation to insights discovery. The platform is powered by a robust Extract, Transform, Load (ETL) pipeline, provides extensive customization capabilities, and a short learning curve from which marketing teams of all sizes can benefit. Review modules of the platform to understand why Improvado is the best Domo alternative.
Data Aggregation
Improvado offers pre-built data connectors to over 500 marketing and sales platforms, ensuring a comprehensive view of marketing performance and reducing the risk of data silos. If you can’t find a much needed data connector in the library, you can request a custom connector, and it'll be delivered in six weeks at the most.
Alternative data aggregation tools include flat-data ingestion, raw data extraction through email, spreadsheet, Amazon S3, or FTP/SFTP.
To streamline data centralization, Improvado provides pre-built extraction templates and the flexibility to create custom ones. These templates simplify the setup process. The platform's extraction process is further enhanced with bulk editing. This feature allows users to simultaneously adjust settings or reload data across selected sources, minimizing the time spent on routine configurations.
Additionally, Improvado facilitates easy access to historical data. The solution loads two years of data by default and up to five years of data upon request per data source or as much historical data as you have in your ad platforms or data warehouse. This ensures that teams can analyze trends over time and make informed decisions based on past performance.
Data Transformation and Modeling
Improvado presents two distinct data transformation and modeling solutions:
- The Marketing Common Data Model (MCDM) serves as a ready-made solution, crafted to simplify data transformation for users of all technical levels. This automated system enables marketers to leverage pre-configured data pipelines, also called recipes, spanning from data extraction to visualization for various use cases. For example, Paid Ads recipe encapsulates everything from connecting to advertising platforms of your choice, centralizing and harmonizing the data, to its visualization in a dashboard. The tool is easy to navigate and takes two weeks at the most to get to master it.
- For those seeking a more tailored solution, Improvado provides DataPrep. It's an enterprise-grade self-service transformation solution with a spreadsheet-like UI. DataPrep boasts a set of over 300 complex transformations. DataPrep's capabilities extend to automating extensive analytics processes and enhancing data exploration. Though mastering DataPrep demands a more extended commitment—around two months—it remains a more streamlined and intuitive option compared to traditional manual data processes or SQL query utilization.
Take an interactive product tour around Improvado
Data Visualization and Analysis
Besides data visualization with MCDM, Improvado supports integration with a variety of BI, data visualization, and analytics platforms, including Power BI, Tableau, Looker Studio, and even Domo and Qlik, also present on this list.
For any unique inquiries, customers can reach out to Improvado's Professional Services team which can assist with dashboard setup and customization, the addition of new metrics and dimensions, or custom data transformations design.
Data Discovery
Improvado comes with an AI marketing assistant. Powered with text-to-SQL technology, the assistant helps marketers query data by simply asking a question in plain English about a lead, campaign, or budget. The assistant provides answers backed by data from your storage and visualizations built on top of it.
Additional Features: Marketing Attribution Modeling
Improvado also provides a marketing attribution solution, including common single-touch, multi-touch, and custom models. The platform maps and analyzes customer journeys and see the value of each marketing touchpoint.
Improvado's attribution solution doesn't require any additional tracking pixels that might slow down your website performance. The platform seamlessly integrates with existing platforms and operates cross-device and in cookieless environments.

Improvado Pricing
Improvado runs on three pricing plans which are based on the usage of the product and selected features. Proceed to the Pricing page to explore what is included in each of the packages.
Tableau
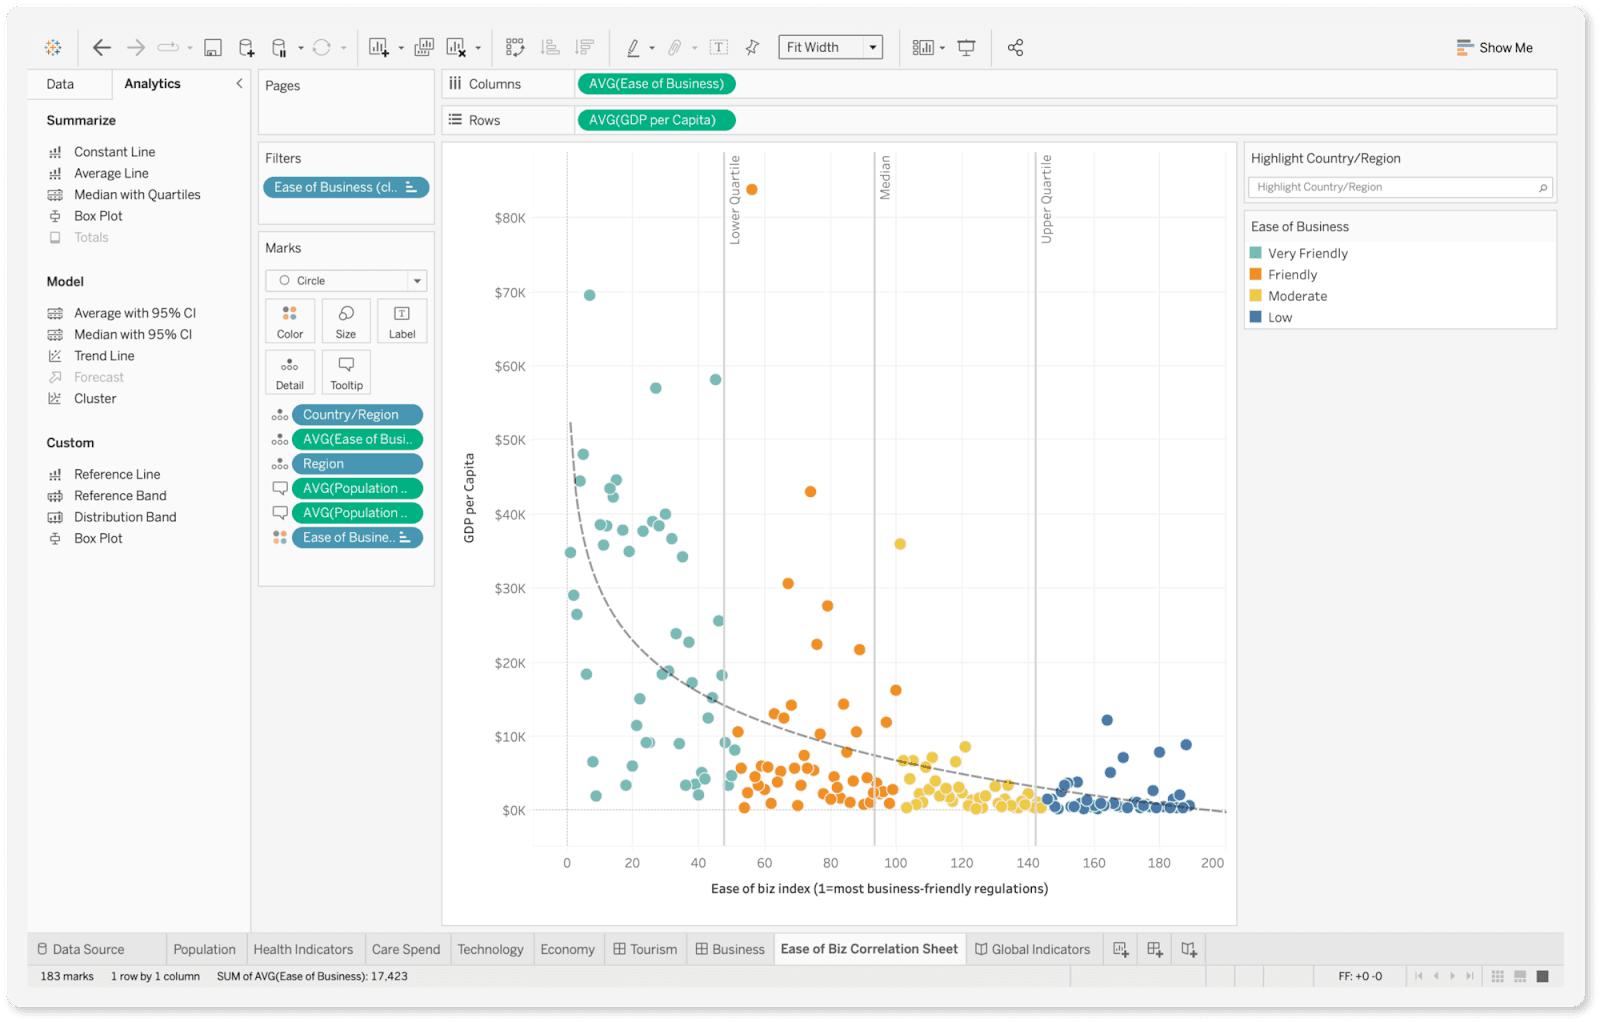
Tableau is a Salesforce-owned business intelligence software and an analytics platform that helps create interactive dashboards, run data modeling, and explore data. Going further, we'll focus on Tableau Desktop and its capabilities, as the platform's core offering.
Data Aggregation
Tableau provides a variety of data aggregation options. Unlike Domo or Improvado, the platform mostly provides connectors to databases, cloud platforms like Amazon Redshift and Google BigQuery, data warehouses, and big data platforms like Spark, instead of pulling data from marketing and sales platforms. Alternative data aggregation methods include file uploads, clipboard data, or building a connector plugin using Tableau Connector SDK.
Data Transformation and Preparation
Tableau Prep Builder is a component of Tableau's suite, focusing on data preparation.
Using a visual representation of the operations applied to the data, users can join, union, or filter their data. Users can also perform various cleaning operations directly from this panel, such as renaming fields, grouping values, changing data types, and reordering columns. Overall, it's a good tool to perform simple data transformations without reaching out to IT resources.
For more advanced data processing, Tableau suggests using R or Python scripts. Make sure the scripting capabilities are supported in the Tableau product of your choice.
Data Visualization and Reporting
Tableau comes with prebuilt functions and visualizations but also provides the flexibility for users to create custom visualizations and calculations. Augmented experiences, powered by AI and ML, are integrated to guide users to relevant answers.
One of Tableau's key features is the interactivity it embeds within visualizations. Users can drill down into data points, apply filters, and even integrate real-time data updates. This dynamic nature ensures that visualizations remain relevant and can adapt to evolving data landscapes.
Tableau Pricing
Tableau offers three core pricing tiers. The price depends on the products included in the package and the number of users. The optimal package highlighted by the platform is Tableau Creator for $70 per user a month, billed annually.
For the additional price, Tableau offers embedded analytics, data management features focused on enhancing data preparation and governance, predictive modeling, and other features.
Looker Studio
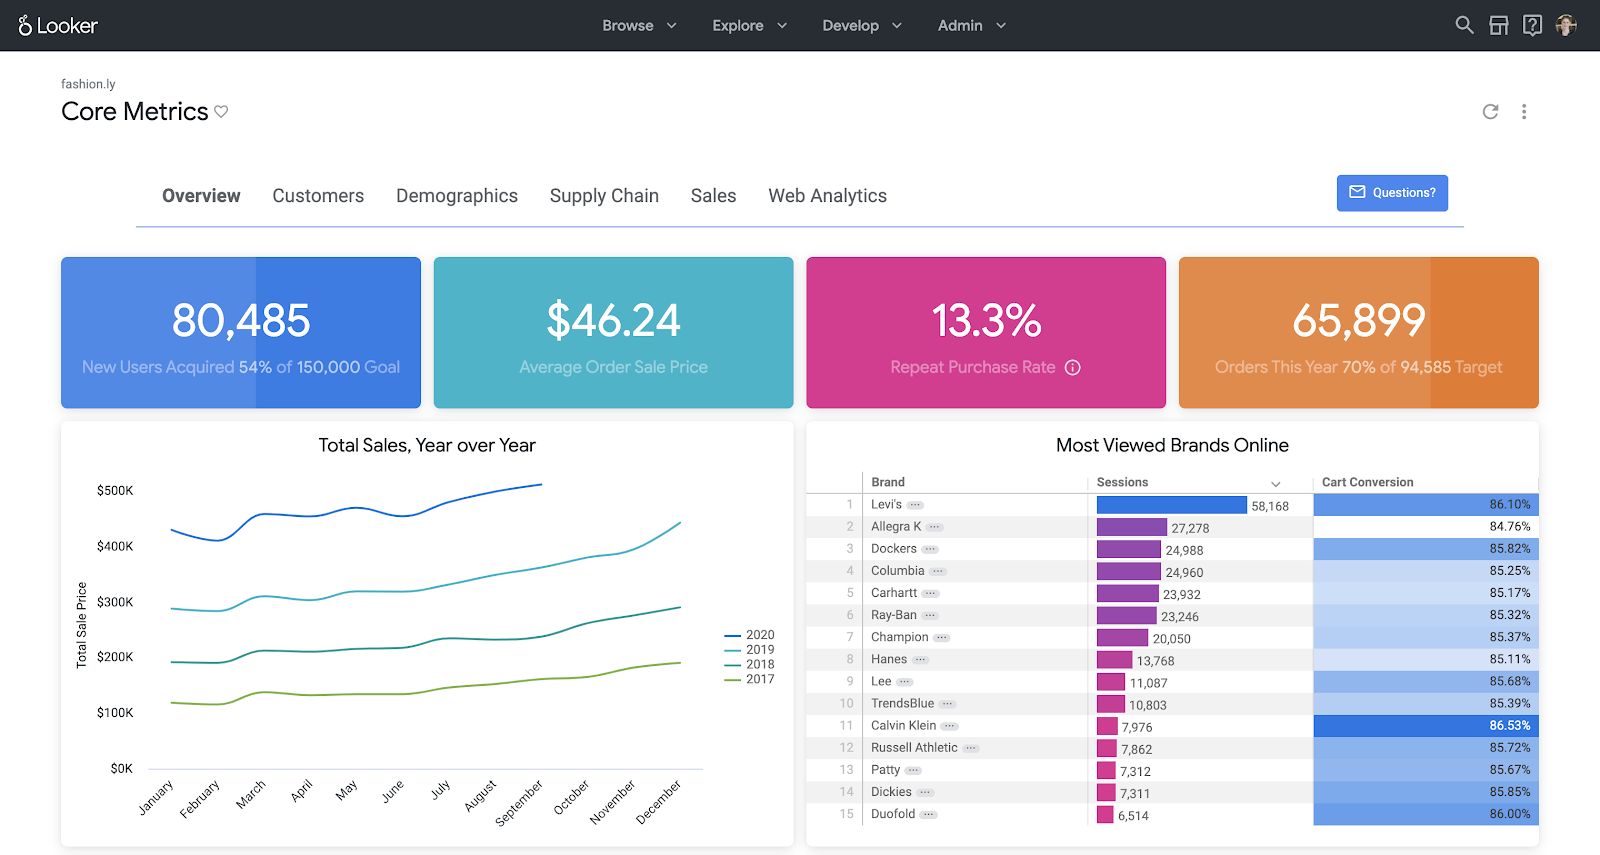
Looker Studio, previously known as Data Studio and now under Google's umbrella, serves as a comprehensive platform for self-service business intelligence, embedded analytics, and data applications.
Data Aggregation
Looker Studio offers over 800 pre-built connectors and a flexible approach to data aggregation. The platform distinguishes between embedded data sources and reusable ones:
- Embedded data sources are created within a report and are integral to that specific report. Any modifications to an embedded data source are made directly within its associated report.
- Reusable data sources are designed for repeated use across multiple reports. Their accessibility is more restricted.
Alternative data aggregation options include flat file ingestion and an option to code your own custom connector using Looker Studio Community Connectors platform.
Data Transformation and Preparation
Looker Studio users can run simple data transformations manually without deep technical know-how. To perform advanced transformations like data blending or run calculations, users need SQL knowledge.
Data Visualization
Looker Studio supports a wide array of visualization types and capabilities. The platform features over 200 templates catering to various use cases and an intuitive interface with drag-and-drop functionalities. For those who need a more tailored visualization, Looker Studio provides the ability to create custom visualizations using JavaScript.
Data Discovery & Exploration
To facilitate data exploration and analysis, Looker Studio presents LookML, short for Looker Modeling Language, its proprietary language of Looker designed to create semantic data models.
The core use cases of LookML are data modeling, custom calculations, and data exploration. For instance, by defining different views in LookML, data analysts can tailor the exploration experience, ensuring users see only relevant fields or tables
Looker Studio Pricing
To some extent, Looker Studio is a free-to-use platform. Enterprise customers can upgrade to Looker Studio Pro to receive technical support for Looker Studio-related issues, expanded administrative features, manage access and share Looker Studio, and other advanced enterprise functionalities.
Customer reviews on G2 suggest that Looker Studio Pro is an incredibly pricey solution, even for large enterprises. The billing is based on the user's data usage and underlying queries, which quickly piles up and might stand in the way of scaling analytics operations.
Cyfe
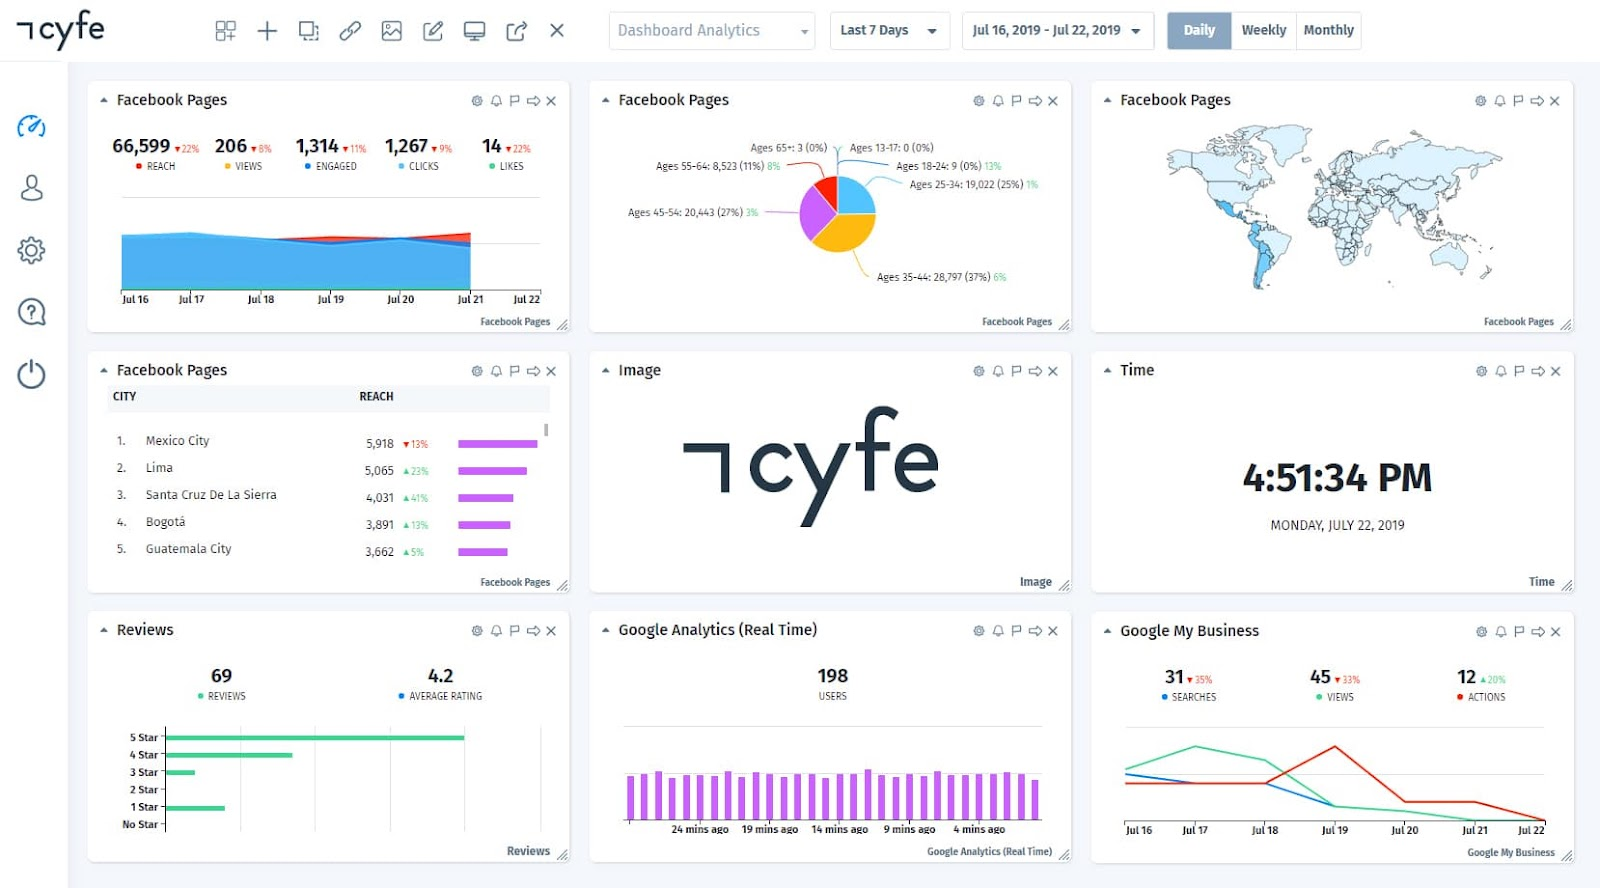
Cyfe is a simple business dashboard tool. Its straightforward nature is compromised by the limited functionality, especially when compared to other Domo competitors on the list.
Data Aggregation
Cyfe provides 100 pre-built data connectors and access to 1,500+ apps in Zapier’s ecosystem. Additionally, Cyfe supports flat file ingestion and offers the Cyfe Push API to push custom data to the dashboard using the JSON data format. The API has a limit of 100k requests per account.
Data Transformation and Preparation
Cyfe provides basic functionality like the ability to "slice and dice unrelated metrics" but other than that the data will be visualized as it is. The platform doesn't support data transformation or calculations, meaning users have to run data transformations, naming unifications, and data cleansing manually.
Data Visualization and Reporting
Cyfe provides a foundation for dashboard design and marketing reporting with its collection of pre-built widgets and dashboard templates. However, current customers note that pre-built widgets are not customizable, while building a widget from scratch takes time.
Cyfe Pricing
Cyfe has four pricing plans:
- Starter, priced at $19/month, that is limited to 1 user and 2 dashboards;
- Standard, priced at $29/month, coming with 2 users and 5 dashboards;
- Pro, priced at $49/month, that includes 5 users and 10 dashboards;
- And Premier pricing plan for $89/month that includes 20 dashboards and an unlimited number of users.
Qlik
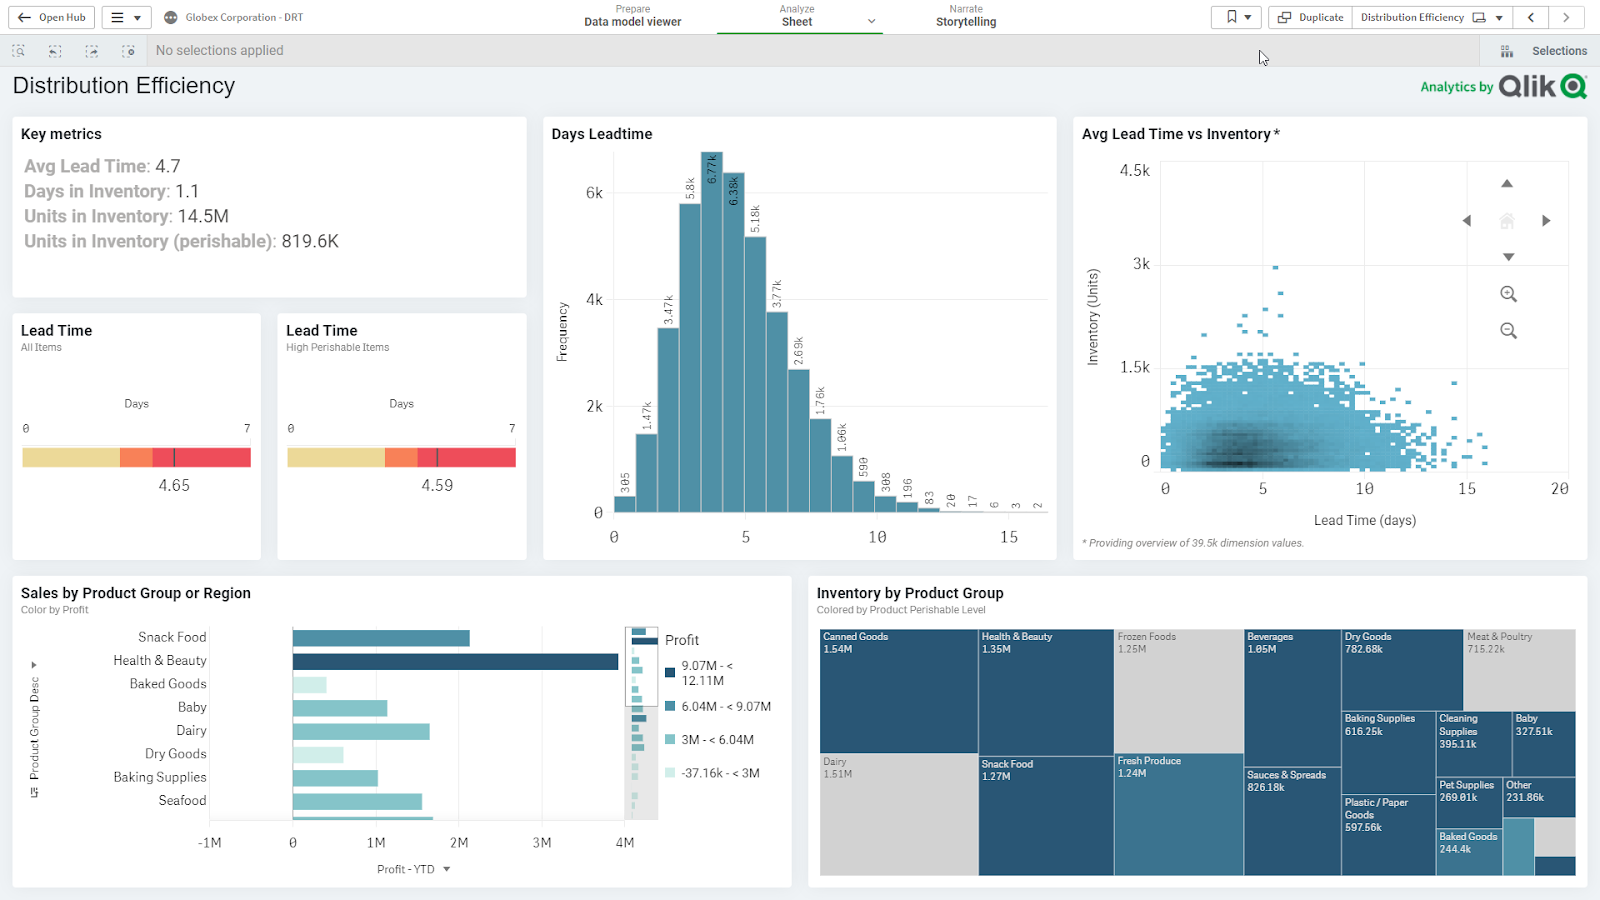
Qlik, or Qlik Sense, is a data integration and analytics platform, offering a diverse toolkit for data aggregation, development, execution, and governance of integration flows.
Data Aggregation
To streamline data integration, Qlik leverages Change Data Capture (CDC) technology that ensures that as soon as data changes at the source, it's immediately reflected at the destination. To set up and manage data flows, Qlik offers a user-friendly interface.
As a part of Qlik Data Integration, the platform also offers data warehouse automation services and managed data lake creation.
Data Transformation and Preparation
Qlik provides multiple data transformation options, both no-code and SQL-based:
- For simple table-based transformations, users can leverage a visual editor to create workflows;
- For running advanced transformations, Qlik supports data modeling that might require SQL, Java, or C++ knowledge.
- To perform custom transformations, users can add custom SQL code;
- Users can rely on third-party data transformation solutions.
Data Visualization and Reporting
Qlik provides both in-app visualization and the ability to push data to BI and data visualization tools like Tableau and Power BI.
Data Discovery
Qlik's platform offers a suite of tools centered around data discovery, including an augmented analytics suite, search and natural language interactions, and AutoML technology for predictive analytics.
Qlik Pricing
Qlik runs on a four-tier pricing model: Qlik Data Integration, Qlik Cloud Data Integration, Qlik Sense Business, and Qlik Sense Enterprise SaaS. The company website doesn't mention any specific price ranges, however, customers mention in their reviews that the pricing model isn't sustainable, and it can get very expensive if you have a lot of users that will be accessing the platform.
Navigating the Landscape of Domo Alternatives
Domo. like any tool, comes with its strengths and areas of improvement. Exploring competitors and alternatives to Domo provides a broader perspective. It allows businesses to gauge which platform aligns best with their specific needs, be it in terms of data integration, visualization, or real-time analytics.
Improvado is the best fit for enterprise and mid-market brands, processing large volumes of data on their multi-regional and multi-brand campaigns. It is an automated marketing analytics solution powered by an advanced data transformation engine, AI copilot, multiple customization options, and a team with extensive experience in the marketing field.

500+ data sources under one roof to drive business growth. 👇
We prioritize consistent product enhancements over endless additions


%20(1).png)
.png)


