%20(1).png)
.png)
.png)
Instagram Analytics Dashboard: The Best Solution for Tracking Social Media Metrics
Instagram is a central hub for sharing content, experiences, thoughts, and perspectives. In terms of engagement rate Instagram confidently holds second place after Tiktok. Even though Instagram's 0,6% is well away from TikTok's whopping 4,25%, it's still miles better than Facebook's 0,15% and Twitter's 0,05%.
Growing your presence on IG is a must for a D2C brand. However, advertising on Instagram without analyzing your marketing efforts may quickly drain your marketing budget.
In this guide, we discuss how to build a comprehensive Instagram analytics dashboard, what metrics to include, and how to get the most out of Instagram data.
Why Instagram Analytics Matter
Which one of your recent posts got the most engagement in the past two weeks?
How about last month?
Which hashtags are the most valuable for your audience?
Which ones are you using most frequently?
These are important questions that require answers if you want to achieve more with your marketing campaigns, creatives, or messaging. Tracking your Instagram metrics will help you find those answers.
With all the data about your Instagram efforts, you can diagnose what isn’t working—and adjust your strategy accordingly. A insights-driven strategy considers all past mistakes and failures. This guarantees more cost-efficient and scalable campaigns.
Why You Should Use an Instagram Dashboard
When you think about analytics for Instagram, you likely envision long, grueling spreadsheets and enormous piles of data. However, it doesn’t have to be this way.
Manual reporting and building charts in spreadsheets is only good if you need to test something or find a quick answer to your question. However, using this approach in your day-to-day activities always results in wasted time and untrustworthy data. And - why so?
An Instagram dashboard centralizes key metrics, offering a streamlined, comprehensive view of your Instagram performance, including:
- Centralized data visualization: An Instagram dashboard aggregates data from various Instagram metrics into one accessible location. This centralization simplifies the process of monitoring multiple aspects of your activity, including follower growth, engagement rates, and content performance.
- Time efficiency: The dashboard automates the process, rapidly generating insights that allow marketers to focus on strategic planning and creative development, rather than on data aggregation tasks.
- Real-time monitoring: With an Instagram dashboard, marketers can immediately gauge the impact of their content and campaigns, enabling swift adjustments to optimize performance and audience engagement.
- Campaign tracking: For campaigns spanning multiple posts or involving diverse content types, a dashboard simplifies tracking overall campaign effectiveness. It allows for the evaluation of individual posts and the aggregate impact, aiding in understanding what resonates with the audience.
- Reporting simplification: Creating reports for stakeholders or team members is made easier with a dashboard. Customizable report features enable the extraction of relevant data in a presentable format, facilitating clear communication of Instagram performance and strategy efficacy.
The Basics of Instagram Analytics
There are two ways to monitor your Instagram analytics and visualize your data:
- Use a third-party dashboard builder
- Use Instagram’s in-app analytics platform.
Both carry pros and cons, so let’s start with an overview of the in-app offering.
1. In-App Analytics
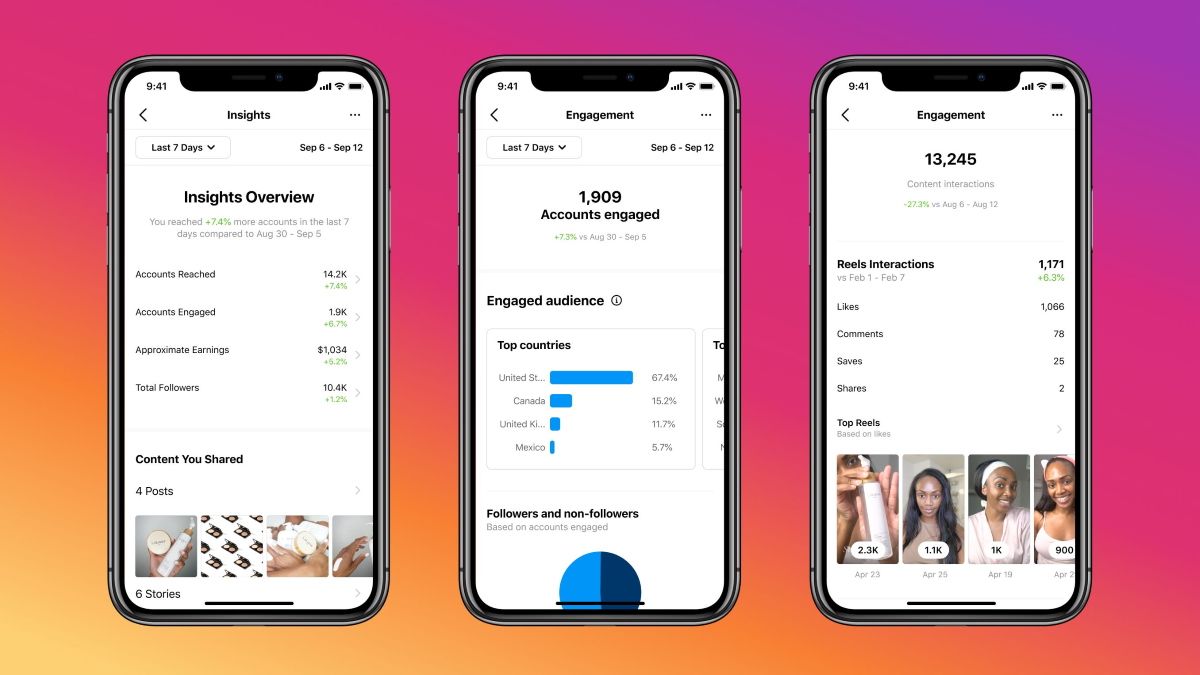
Instagram’s in-app analytics is a useful resource for marketing professionals, but it comes with a decent number of limitations. The built-in reporting tool provides basic insights into your account performance, which can be useful when checking on a data point you’re already familiar with.
Moreover, Instagram's native tools often provide a limited window for historical data access, usually just a few months. This constraint makes it challenging to perform long-term trend analysis, assess seasonal variations, or compare year-over-year performance, which is vital for strategic planning.
2. Third-Party Tools
A third-party analytics tool is essential for marketing professionals who need more than a basic glance at simple metrics.
Third-party analytics tools excel in aggregating data from various sources, not just Instagram. They can combine Instagram metrics with data from other social platforms, e-commerce sites, CRM systems, and offline channels. This integration offers a holistic view of marketing efforts and customer interactions across all touchpoints.
Unlike Instagram's native analytics, third-party tools often provide extended, sometimes unlimited, access to historical data.
Offering highly customizable dashboards and reporting capabilities, third-party tools allow brands to create tailored reports that align with specific business goals and KPIs. This customization ensures that stakeholders have access to relevant, actionable insights presented in an easily digestible format.
Third-party analytics tools provide real-time data monitoring and alerting capabilities. Brands can receive immediate notifications about significant changes or anomalies in their Instagram performance, enabling swift responses to emerging trends or issues.
Instagram Metrics to Include In the Dashboard
As with any marketing channel, your data is only as good as the metrics you’re tracking. Below, you’ll find some of the most important metrics to track when building your analytics dashboard.
Engagement Rate

Social media marketing is about one thing above all others—engagement. Though you can pop into your audience's inbox with email marketing and develop valuable resources on your website, no marketing channel facilitates direct engagement quite like social media.
Instagram is no exception, which is why it’s vital to track your engagement rate.
Think of engagement rate tracking as keeping a pulse on your Instagram marketing efforts. This metric acts as a lifeline, letting you know how things are truly doing. Your engagement rate is the percentage of your following that regularly interacts with your content, considering the number of likes and comments you receive on a post in relation to your overall follower count.
Impressions

If you’ve ever dabbled in analytics, you’re likely already familiar with this metric. Impressions on Instagram work largely in the same way they do on the web. This metric is tracking the number of people who have been exposed to your account.
You can filter that data by a specified period if you want to understand how a certain campaign has impacted your impressions.
Follower Growth
Follower tracking on Instagram is similarly crucial. Unlike simply tracking the number of likes you’re getting on a post, your follower growth is not a vanity metric. You aren’t just keeping tabs on your existing follower count—you’re actively monitoring the growth rate of your following.
Gaining a large number of followers quickly doesn’t always equate to actual conversions, but that doesn’t mean your following shouldn’t grow steadily if your campaigns are effective. Tracking your follower growth is important to see whether you’re trending upward or downward.
Top Performing Posts
Another common social media metric that remains applicable and valuable for Instagram is your top-performing posts. When your team begins crafting the next campaign, knowing what has worked best in the past is helpful. This can assist you in understanding what your audience is drawn to and how to reach them in future campaigns.

3 Best Practices For Building An Instagram Dashboard
When building your ideal Instagram analytics dashboard, you must ensure you’re creating the most valuable central hub you can. To do that, follow these best practices for building an Instagram data hub.
1. Combine Data to See the Big Picture
Using a dashboard can be incredibly beneficial in allowing teams to see the big picture. With in-app analytics your marketing vision is limited to a single channel. But a dashboard lets you combine your data and KPIs into a single source of truth to get a bird’s-eye-view. So, combining your data is crucial to make unbiased decisions and optimize your cross-channel marketing effort.
2. Automate When Possible
Automation is critical in any analytics-tracking venture. Don’t waste your time with DIY solutions with manual data collection—opt for a solution that automatically sources data from Instagram and generates actionable insights based on said information.
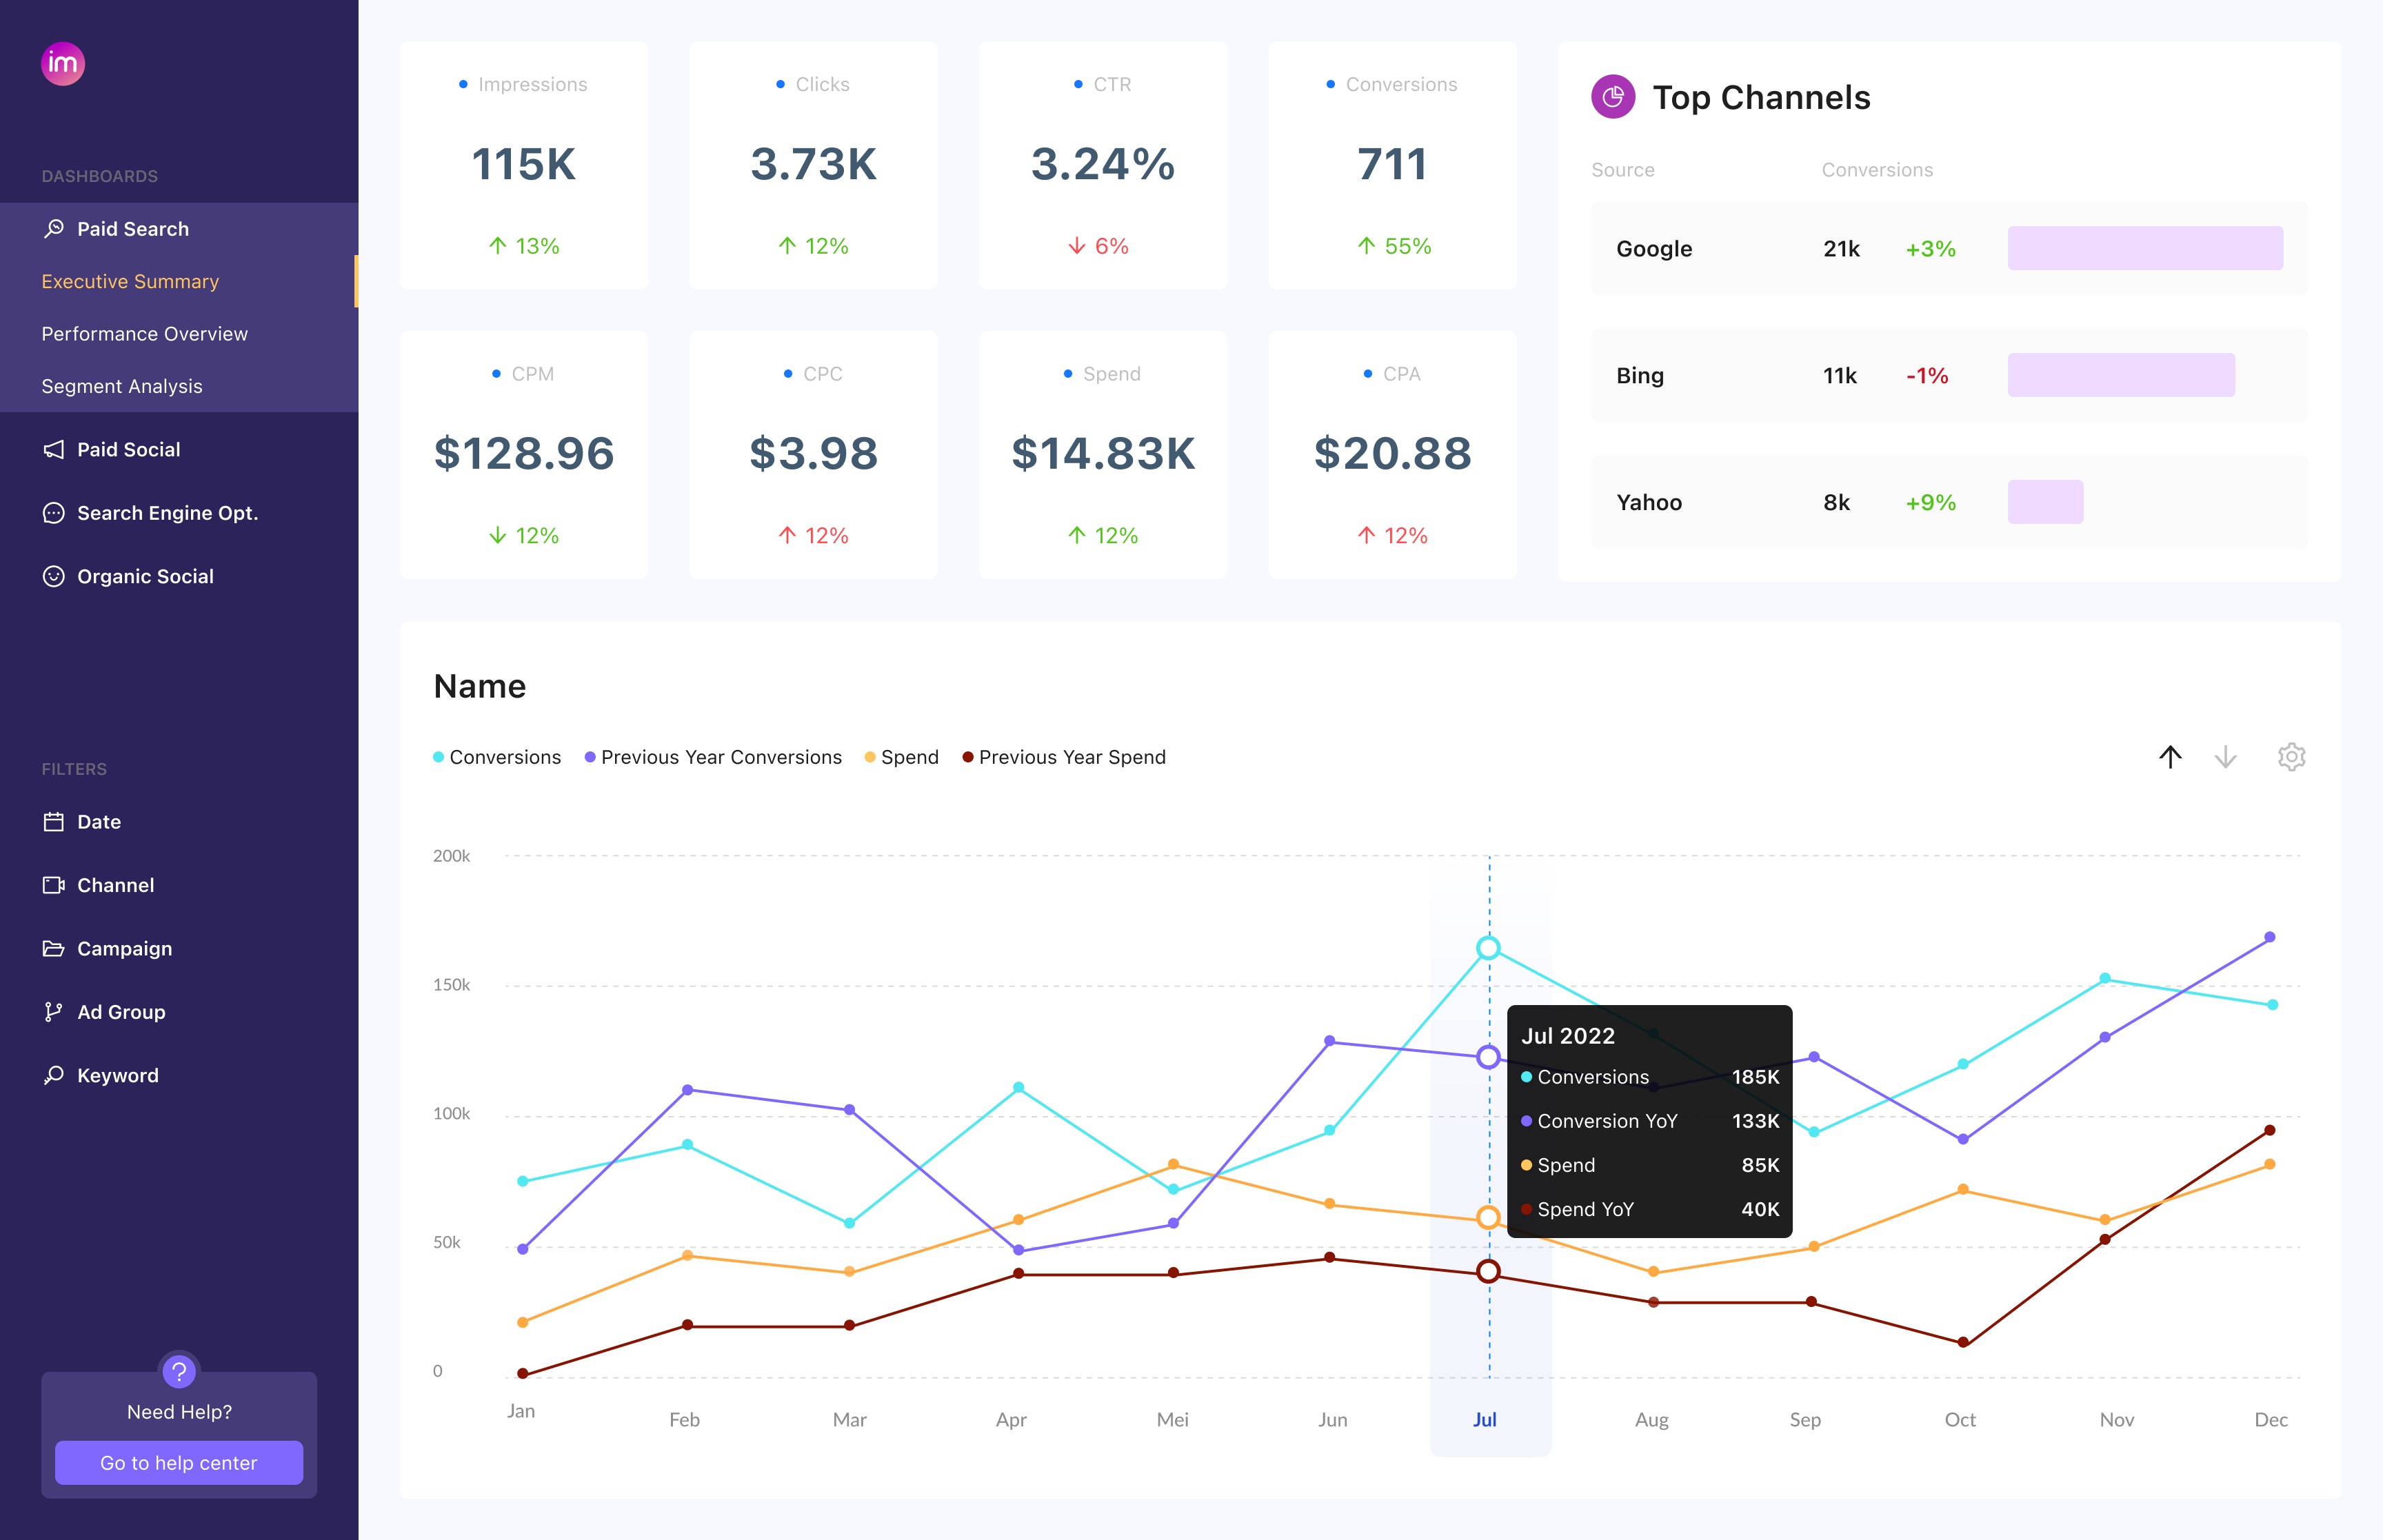
Improvado is just what it takes to create an actionable analytics dashboard. The platform integrates with 500+ marketing and sales data sources to pull required metrics, turn it into a digestible form, and streamline to a visualization tool of your choice.
Instead of wasting time drawing identical pie and bar charts in spreadsheets you get access to a library of customizable dashboard templates for social media, paid ads, web analytics, and other use cases. Improvado’s templates allow you to start analyzing in days, not weeks or even months.
3. Use Data Storytelling and Visualizations
Telling a story with data is one of the most important skills to have when communicating results to stakeholders. Use your Instagram dashboard to show how each metric relates to the next. What effect do your top-performing posts have on your engagement rate? How does your follower growth impact your reach? Find the story in the numbers, then convey that story on your dashboard for best results.
Use a Marketing Analytics Platform to Squeeze the Most out of Instagram Data
Focusing on social media performance is crucial to understanding marketing’s team impact on the organization’s bottom line. However, you need clear-cut data to design your perfect Instagram analytics dashboard that’ll fuel your decision-making. Opting for a platform that only provides data visualization without automating the sourcing of that data and transforming it into actionable insights is not an efficient way to operate.
Instead, use a platform designed to handle all steps of the data journey, from extraction to visualization.
Improvado is an automated marketing analytics platform that sources data from 500+ sources (including Instagram and other social media platforms). With Improvado you get all the same features as when using SQL and BI tools, but in a zero-code environment. Connect your data sources, choose a template, and Improvado will automatically visualize data in a way you need.
In case your needs go beyond Improvado’s library of data sources or metrics, Improvado can fulfill any custom needs in the shoretest terms. The platform can help you develop custom dashboards from scratch or take care of advanced data queries with Professional Services offering. So, whether you’re aiming for a plug-and-play Instagram dashboard or a customized dashboard for your specific use case, Improvado got you covered.

500+ data sources under one roof to drive business growth. 👇
Improvado simplifies complex IG data analysis


%20(1).png)
.png)


