Are currently using the Chartio or trying to get a better understanding of your options when it comes to collecting accurate marketing data? Here is the list of top alternatives to the Chartio.
Lorem ipsum dolor sit amet, consectetur adipiscing elit. Suspendisse varius enim in eros elementum tristique. Duis cursus, mi quis viverra ornare, eros dolor interdum nulla, ut commodo diam libero vitae erat. Aenean faucibus nibh et justo cursus id rutrum lorem imperdiet. Nunc ut sem vitae risus tristique posuere.
Chartio
What is Chartio? Chartio is a cloud-based business intelligence platform that helps manage day-to-day business operations, as well as track marketing efforts.
Website:
Year founded::
2010
Company size:
50 - 200
Who should use Chartio?
The software provides business owners, product teams, data analysts, and marketers with helpful organizational tools. Chartio offers a central dashboard and functions for data exploration with the ability to present data from multiple sources in a variety of charts. The main fault with Chartio, however, is that is some users may be faced with a steep learning curve, particularly if they are new to business intelligence or don’t have any knowledge of SQL.
Use Cases
Pricing
Chartio does custom pricing. You can contact the company for a quote.
Integrations
Company rating
4.0
out of
5
Easy to setup
4.0
out of
5
Quality of support
4.5
out of
5
Top 10 Alternatives to Chartio in 2021
Improvado is a tool built by marketers, for marketers to get all their data into one place, in real-time, with automated dashboards and reports.
Improvado is an enterprise-grade, no-code Revenue Data Platform that automates how marketing, sales, and revenue teams extract, transform and load data from source to destination.
The platform offers prebuilt connectors to over 500 data sources, making it convenient for users who want to efficiently aggregate and push data to data warehouses or to BI, visualization, or analytics tools. Improvado’s clients can also request custom connectors if they need to work with a data source not listed in the integration catalog. Furthermore, the platform offers a high level of granularity, allowing you to explore insights at any level.
Improvado is known for its advanced data transformation engine, known as the Marketing Data Common Model (MCDM). This functionality automatically unifies disparate naming conventions that usually occur when pulling related data from different sources, removes errors and duplicates, and runs automated data mapping and transformation sequences using self-service or prebuilt templates. That way, you can get access to analysis-ready data in no time and start analyzing it in built-in dashboards.
Thanks to its compliance with HIPAA, SOC-2, and enterprise SLA, Improvado is compatible with businesses in privacy-sensitive industries, like health, insurance, and finance.
Automate omnichannel marketing reporting with Improvado
Improvado is specifically designed for marketing, sales, and revenue teams. Thus, it is fully fitted with features that cater to the needs of these departments and requires zero technical skills.
Marketing, sales, and revenue teams use Improvado to access insights on all revenue-generating efforts across their channels and customer touchpoints. This is powered by Improvado’s efficient marketing attribution modeling functionality that enables users to build custom data pipelines that automatically attribute conversions to the right channels.
As a no-code platform, Improvado is suitable for teams with zero coding skills and SQL knowledge. Improvado also provides professional services to customers who need help with building custom data dashboards, handling data migration, and providing team-wide training. As an add-on, Improvado provides data warehouse maintenance services, freeing up your company’s valuable time and resources.
The platform has users from several industries, encompassing professionals in mid-market brands, large-scale enterprises, and agencies.
Improvado Pricing
Improvado doesn’t tie its users to a specific contract value. Improvado assesses your company’s unique needs when you request a quote and calculates a custom pricing plan best suited for your business.
Improvado’s flexible pricing means you get access to and pay only for the features and bandwidth you need.
Furthermore, Improvado offers a token, called DECS points, which you can spend on APIs, flat file ingestion, report type development and modification, and other development needs.
Improvado Integrations
Improvado has a library of over 500 data sources across several categories, including advertising platforms, CRMs, payment gateways, eCommerce tools, and more. If you can’t find a specific data source in the integration library, you can always request a custom connector, and it will be built for you.
The platform also supports leading data warehouses like Google BigQuery, Amazon RedShift, Snowflake, and more.
Its amazing how Improvado had the ability to get us the data we need. I highly recommend anyone looking to aggregate their data to use Improvado.
Alex C
CEO at PenPath
Its amazing how Improvado had the ability to get us the data we need. Simply put, we need to have a lot of flexibility in this industry. I highly recommend anyone looking to aggregate their data to use Improvado.
They really have been a major part of our success and the people there are great to work with.
Improvado provide a reliable foundation that are building our business on top of. The kind of partnership we have with them has truly paid off.
Read the case study
Get a tour around the product from the Improvado team
Thank you! Your submission has been received!
Oops! Something went wrong while submitting the form.
Looker
What is Looker? Looker is a business intelligence and data visualization tool that is one hundred percent in-database, capitalizing on the fastest and most recent analytic databases for real-time results. Users can easily customize and create an array of interactive visualization from the assortment of charts and graphs the platform provides.
What is Looker? Looker is a business intelligence and data visualization tool that is one hundred percent in-database, capitalizing on the fastest and most recent analytic databases for real-time results. Users can easily customize and create an array of interactive visualization from the assortment of charts and graphs the platform provides.
Looker is a useful business intelligence tool for teams across nearly all business departments. The tool is a good choice for anyone looking for something simple to use, but still provides plenty of insightful information in a visual way.
Company rating
3.5
out of
5
Easy to setup
3.5
out of
5
Quality of support
3.5
out of
5
Use Cases
Pricing
Looker customizes their prices based on your need. For a quote contact the company directly.
Integrations
Pros
Great customer support
Easy to use
Integrates with databases and big data platforms
Cons
Larger dashboard sometimes take a bit longer to load
Not as flexible due its simplicity
Without an external tool, getting your marketing data into Looker is a very manual process - you can either use spreadsheets or build APIs in house (which is very resource intensive)
Alternatives
Sisense
Sisense is a business intelligence and data visualization tool for creating visually appealing graphs and reports. The visualization capabilities allows users to create dashboards, charts, and other forms of data visualization with easy through its drag-and-drop feature.
Sisense is a business intelligence and data visualization tool for creating visually appealing graphs and reports. The visualization capabilities allows users to create dashboards, charts, and other forms of data visualization with easy through its drag-and-drop feature.
Sisense was designed for businesses who want the ability to view their data in a visual way with minimal help from the IT department. The business intelligence software lets the various business departments gain insight into data to help make data-driven decisions. The company claims that it empowers business analysts, data engineers, and developers to simplify complex data.
Sisense is a business intelligence solution that gives businesses advanced tools to manage and support business data through analytics, visualization, and reporting. It allows businesses to analyze big datasets, gain valuable insights from them, and generate business trends according to the data. To do this, it allows businesses to source and combine data from many sources and use them in one single database where it transforms and rearranges the data into a single format that the platform can use. It includes features like dashboards, score cards, data warehousing, ETL tools, and reporting.
Sisense offers many integrations with well-known platforms and services which include: Amazon Redshift, Snowflake, Google BigQuery, MongoDB, Singlestore, Access, Apache Cassandra, Apache Hbase, Apache Phoenix, Apache Spark, Azure Data Lake Storage, Clickhouse, Cosmos DB, Couchbase, DynamoDB, ElasticSearch, Exasol, Google Cloud Spanner, Greenplum, Heroku Postgres, Hive, IBM Cloud SQL Query, IBM Cloudant, IBM DB2, Impala, MariaDB, MarkLogic, MySQL, Neo4j, Oracle, PostgreSQL, Presto, Redis, SAP HANA, SAP Sybase, SAP Sybase IQ, Splunk
Company rating
3.5
out of
5
Easy to setup
3.5
out of
5
Quality of support
3.5
out of
5
Use Cases
Pricing
Sisense charges customers based on their business needs. You will need to ontact the company for customized pricing details.
Integrations
Pros
Drag-and-drop dashboard
Wide variety of widgets, including graphs and charts
Aggregates data from numerous data sources
Cons
Slight learning curve with some features
Less customization with drag-and-drop dashboard
Not as much flexibility as several competitors
Images sometimes don’t look the same after exporting
Limitations with sorting data
Alternatives
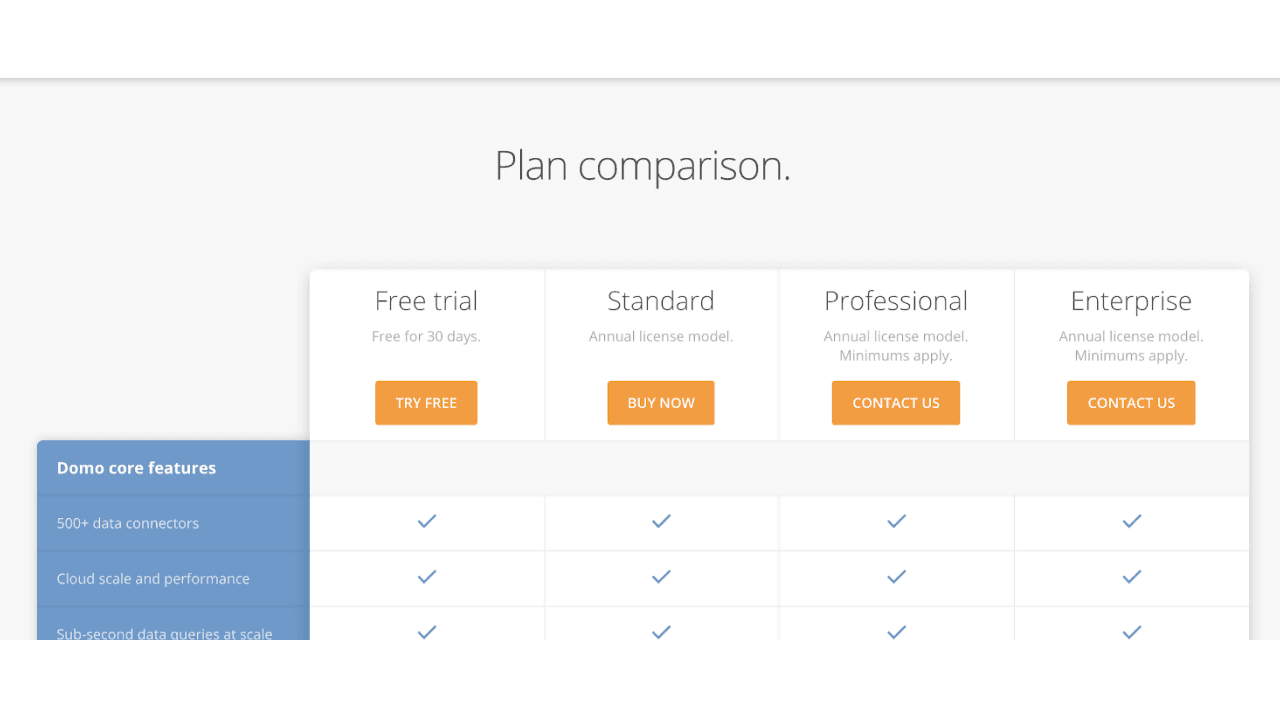
Domo
What is Domo? Domo is software that specializes in data visualization and business intelligence.
Domo is best for C-level executives at enterprise companies looking for a company-wide (non-marketing specific) BI tool to create executive level dashboards.
The important thing to note is that it is not specifically focused on marketing data, just business data in general. That means, it's capacity is vast when it comes to business intelligence and executive dashboards company-wide, but may not be the best pick for aggregating and visualizing marketing data specifically, because marketing integrations are limited, the connectors don't run as deeply and the tool overall may be too expensive for just the marketing team's use.
Company rating
4.5
out of
5
Easy to setup
4.0
out of
5
Quality of support
4.5
out of
5
Use Cases
Pricing
Pricing is offered on an annual subscription basis, and depends upon the number of users that need access. The company does offer a 30 day free trial.
Integrations
Pros
Offers more than 500 connectors across Finance, HR, IT, Operations, Sales and Marketing.
Ability to view real-time data in one dashboard
Don't need to get IT department involved in implementation
Cons
Not focused specifically on marketing, so marketing integrations are limiting
Domo is completely cloud-based which may be a drawback if you have most of your data on-site.
You have to view your data on the Domo dashboard, you can't export it, save it as a file, or view it on the BI tool of your choice.
Domo is fairly secretive about their pricing and is cost prohibitive for many businesses.
Lack of improvement. There hasn’t been a major refresh of the platform in years, or much product innovation to speak of.
Requires tons of professional services to get up and running
Customer support is sub-par - there are fees associated with all of the customer service trainings and onboardings
No database provided with the software package, you need a separate budget allocation for that
Alternatives
Qlik
What is Qlik? Qlik, or more specifically Qlik Sense, connects to your data sources and provides the ability to discover insights beyond that of SQL queries. Users can search and explore their data, pivoting analytics to investigate data further. Qlik indexes all possible relationships in the data, without being restricted to a partial view of the data.
What is Qlik? Qlik, or more specifically Qlik Sense, connects to your data sources and provides the ability to discover insights beyond that of SQL queries. Users can search and explore their data, pivoting analytics to investigate data further. Qlik indexes all possible relationships in the data, without being restricted to a partial view of the data.
Qlik offers robust collaboration and visualization features, making it a great data analysis software for teams. The free Qlik Sense Desktop lets you create interactive dashboards and reports, along with great looking graphs and charts. This visualization software makes analysis easier, helping businesses make informed decisions quicker.
Company rating
4.5
out of
5
Easy to setup
4.0
out of
5
Quality of support
3.5
out of
5
Use Cases
Pricing
Qlik is free for up to 5 users for Cloud Basic. Pricing for Cloud Business is starts from $15 per user.
Integrations
Pros
Customization
Extended self-service capabilities
Cloud-based and scalable
Robust and fast aggregation
Cons
Security settings and complicated and can be difficult to comprehend
No guided analytics aspects, even navigation between sheets can't be controlled.
Corporate Information For general inquiries, please send an e-mail to info@ModeMediaCorp.com. Press Inquiries If you are a member of the press and would like information about Mode Media...
Company rating
4.0
out of
5
Easy to setup
4.0
out of
5
Quality of support
4.5
out of
5
Use Cases
Pricing
Integrations
Pros
Cons
Alternatives
Tableau
What is Tableau? Tableau is a visualization tool that helps businesses transform their data into insights that can lead to action. The tool makes it easy to connect data in almost any format from almost any source. Interactive dashboard with visual analytics can be created with simple dragging and dropping, and data transformed in graphs, maps, charts, and other visualizations.
What is Tableau? Tableau is a visualization tool that helps businesses transform their data into insights that can lead to action. The tool makes it easy to connect data in almost any format from almost any source. Interactive dashboard with visual analytics can be created with simple dragging and dropping, and data transformed in graphs, maps, charts, and other visualizations.
Tableau is a visual analytics platform that helps businesses explore, manage, and share data. Its portfolio of products includes tools that work together to help businesses prepare, analyze, secure, and collaborate with data. The platform has the ability to query relational databases, spreadsheets, cloud databases, and OLAP cubes to generate graphical data visualizations.
Company rating
4.5
out of
5
Easy to setup
4.0
out of
5
Quality of support
3.5
out of
5
Use Cases
Pricing
There is a set of plans starting at $12 per month for hosting the tool on public cloud or on-premise, and another set of plans starting at $15 per month for being fully hosted by Tableau.
Integrations
Pros
Versatile features
Intuitive user interface
Customizable dashboards
Extensive offering of data source integrations
Cons
Dashboards can sometimes be a bit slow
Somewhat limited graphs
Larger data files can take some longer to load
Alternatives
Can't decide what's the most suitable software for you? Set up a call with our team?


.png)


.png)


